ARCHER Tips and Tricks A few notes from


![Placement (cont. ) [PE_0]: [PE_0]: … MPI rank order: Using default aprun rank ordering. Placement (cont. ) [PE_0]: [PE_0]: … MPI rank order: Using default aprun rank ordering.](https://slidetodoc.com/presentation_image_h/a60f1a610b9a493817b8cc35bc0025a9/image-9.jpg)
![Placement (cont. ) [PE_0]: cpumask set to 1 cpu on nid 02421, cpumask = Placement (cont. ) [PE_0]: cpumask set to 1 cpu on nid 02421, cpumask =](https://slidetodoc.com/presentation_image_h/a60f1a610b9a493817b8cc35bc0025a9/image-10.jpg)
- Slides: 16

ARCHER Tips and Tricks A few notes from the CSE team

Reusing this material This work is licensed under a Creative Commons Attribution. Non. Commercial-Share. Alike 4. 0 International License. http: //creativecommons. org/licenses/by-nc-sa/4. 0/deed. en_US This means you are free to copy and redistribute the material and adapt and build on the material under the following terms: You must give appropriate credit, provide a link to the license and indicate if changes were made. If you adapt or build on the material you must distribute your work under the same license as the original. Note that this presentation contains images owned by others. Please seek their permission before reusing these images.

Outline • Using Intel MKL • Impact of Hyper. Threads • Showing process/thread placement • Performance analysis: hardware counters on ARCHER • Debugging: Disabling autotuning in Cray BLAS • Enabling and using ATP

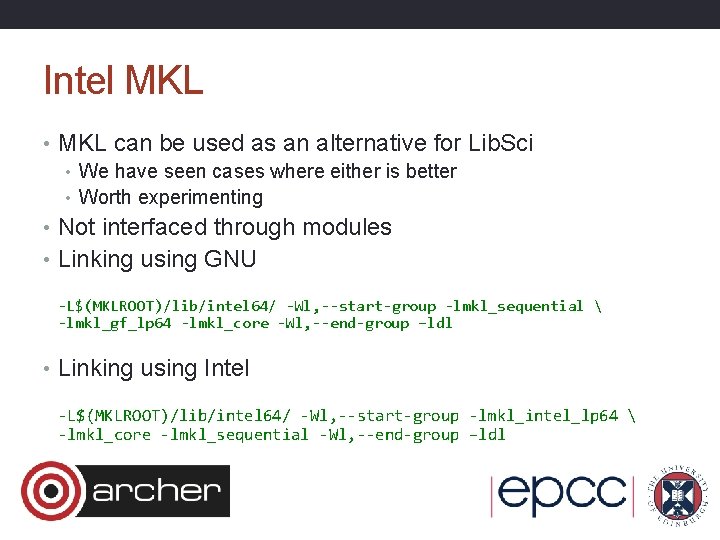
Intel MKL • MKL can be used as an alternative for Lib. Sci • We have seen cases where either is better • Worth experimenting • Not interfaced through modules • Linking using GNU -L$(MKLROOT)/lib/intel 64/ -Wl, --start-group -lmkl_sequential -lmkl_gf_lp 64 -lmkl_core -Wl, --end-group –ldl • Linking using Intel -L$(MKLROOT)/lib/intel 64/ -Wl, --start-group -lmkl_intel_lp 64 -lmkl_core -lmkl_sequential -Wl, --end-group –ldl

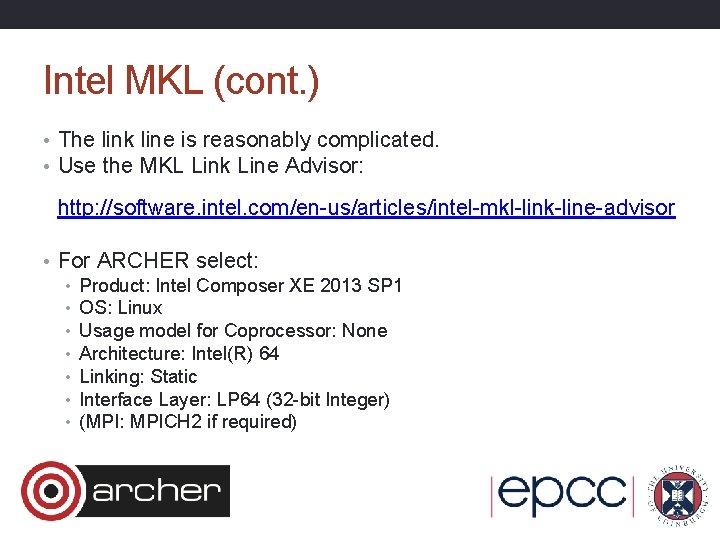
Intel MKL (cont. ) • The link line is reasonably complicated. • Use the MKL Link Line Advisor: http: //software. intel. com/en-us/articles/intel-mkl-link-line-advisor • For ARCHER select: • Product: Intel Composer XE 2013 SP 1 • OS: Linux • Usage model for Coprocessor: None • Architecture: Intel(R) 64 • Linking: Static • Interface Layer: LP 64 (32 -bit Integer) • (MPI: MPICH 2 if required)

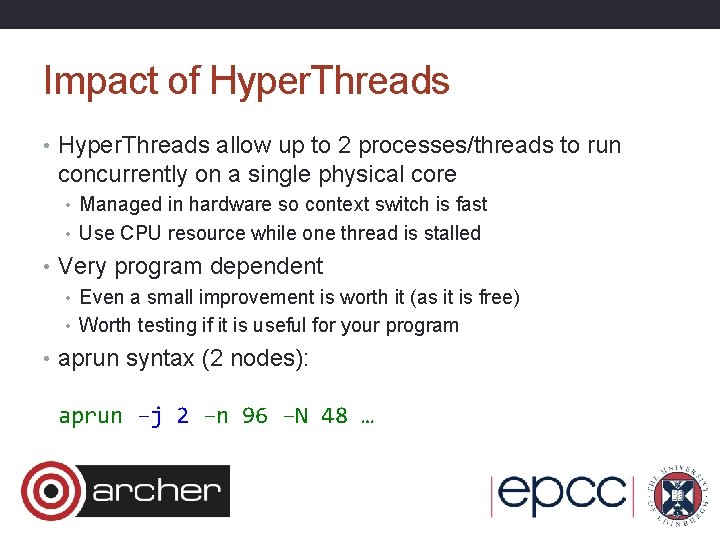
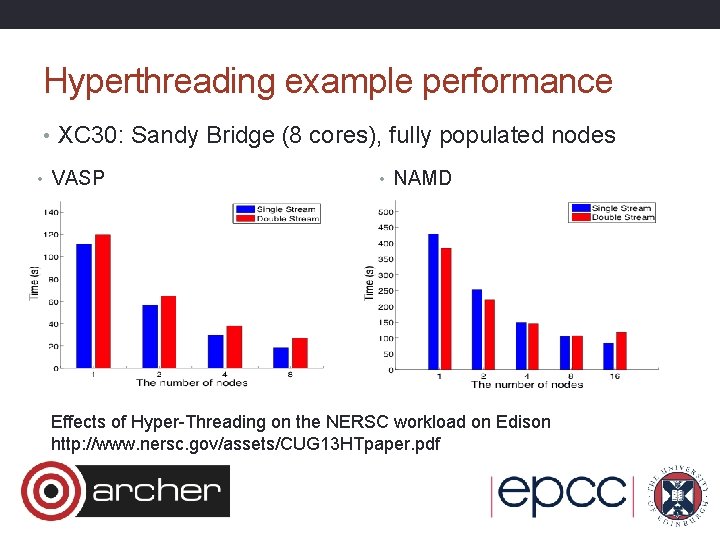
Impact of Hyper. Threads • Hyper. Threads allow up to 2 processes/threads to run concurrently on a single physical core • Managed in hardware so context switch is fast • Use CPU resource while one thread is stalled • Very program dependent • Even a small improvement is worth it (as it is free) • Worth testing if it is useful for your program • aprun syntax (2 nodes): aprun –j 2 –n 96 –N 48 …

Hyperthreading example performance • XC 30: Sandy Bridge (8 cores), fully populated nodes • VASP • NAMD Effects of Hyper-Threading on the NERSC workload on Edison http: //www. nersc. gov/assets/CUG 13 HTpaper. pdf

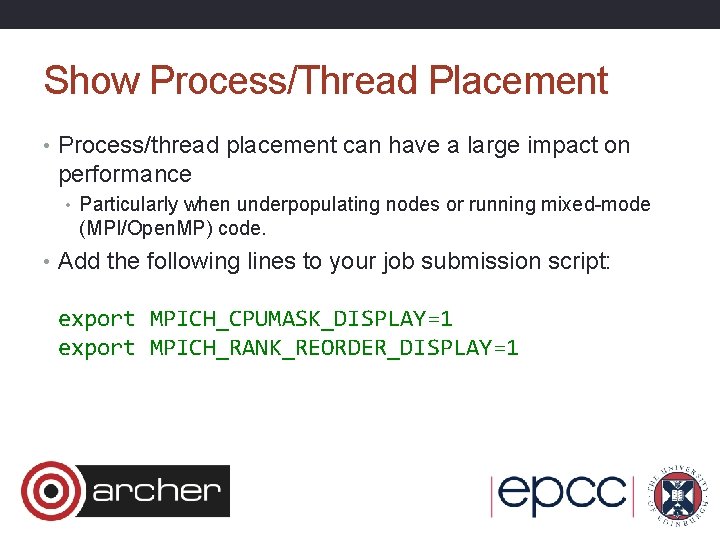
Show Process/Thread Placement • Process/thread placement can have a large impact on performance • Particularly when underpopulating nodes or running mixed-mode (MPI/Open. MP) code. • Add the following lines to your job submission script: export MPICH_CPUMASK_DISPLAY=1 export MPICH_RANK_REORDER_DISPLAY=1
![Placement cont PE0 PE0 MPI rank order Using default aprun rank ordering Placement (cont. ) [PE_0]: [PE_0]: … MPI rank order: Using default aprun rank ordering.](https://slidetodoc.com/presentation_image_h/a60f1a610b9a493817b8cc35bc0025a9/image-9.jpg)
Placement (cont. ) [PE_0]: [PE_0]: … MPI rank order: Using default aprun rank ordering. rank 0 is on nid 02421 rank 1 is on nid 02421 rank 24 is on nid 02505 rank 25 is on nid 02505 rank 26 is on nid 02505
![Placement cont PE0 cpumask set to 1 cpu on nid 02421 cpumask Placement (cont. ) [PE_0]: cpumask set to 1 cpu on nid 02421, cpumask =](https://slidetodoc.com/presentation_image_h/a60f1a610b9a493817b8cc35bc0025a9/image-10.jpg)
Placement (cont. ) [PE_0]: cpumask set to 1 cpu on nid 02421, cpumask = 0000000000000000000000001 [PE_34]: cpumask set to 1 cpu on nid 02505, cpumask = 0000000000000000000100000 [PE_33]: cpumask set to 1 cpu on nid 02505, cpumask = 0000000000000000000100000 [PE_35]: cpumask set to 1 cpu on nid 02505, cpumask = 0000000000000000001000000 [PE_47]: cpumask set to 1 cpu on nid 02505, cpumask = 0000000000001000000000000 …

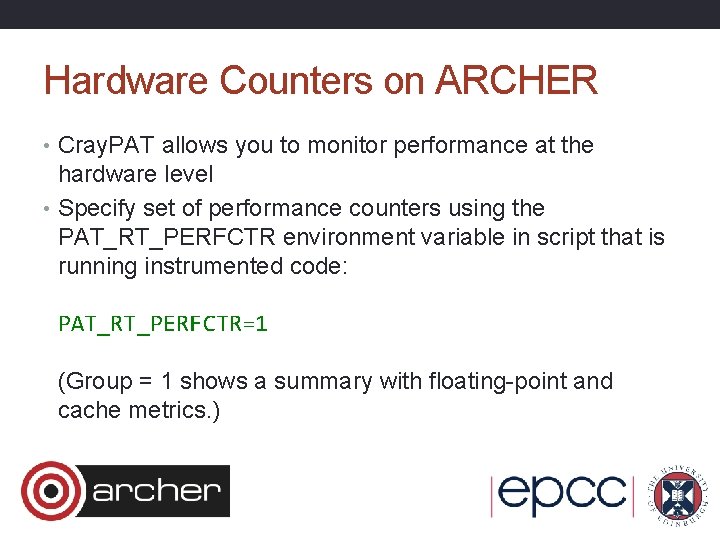
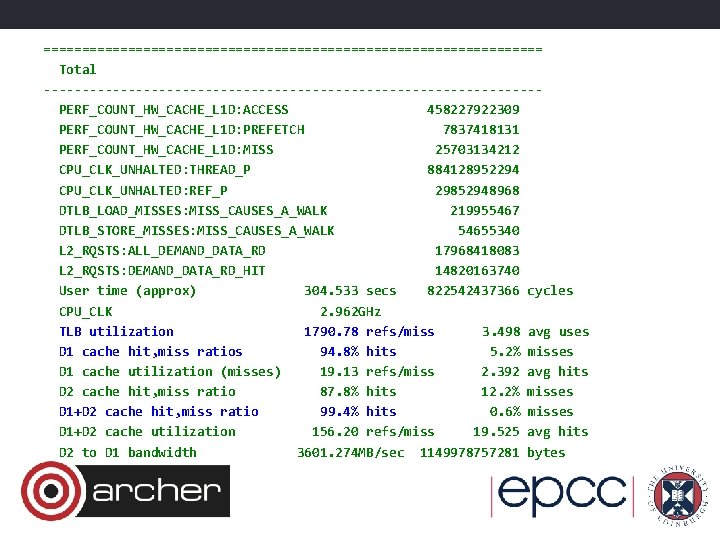
Hardware Counters on ARCHER • Cray. PAT allows you to monitor performance at the hardware level • Specify set of performance counters using the PAT_RT_PERFCTR environment variable in script that is running instrumented code: PAT_RT_PERFCTR=1 (Group = 1 shows a summary with floating-point and cache metrics. )

================================= Total --------------------------------PERF_COUNT_HW_CACHE_L 1 D: ACCESS 458227922309 PERF_COUNT_HW_CACHE_L 1 D: PREFETCH 7837418131 PERF_COUNT_HW_CACHE_L 1 D: MISS 25703134212 CPU_CLK_UNHALTED: THREAD_P 884128952294 CPU_CLK_UNHALTED: REF_P 29852948968 DTLB_LOAD_MISSES: MISS_CAUSES_A_WALK 219955467 DTLB_STORE_MISSES: MISS_CAUSES_A_WALK 54655340 L 2_RQSTS: ALL_DEMAND_DATA_RD 17968418083 L 2_RQSTS: DEMAND_DATA_RD_HIT 14820163740 User time (approx) 304. 533 secs 822542437366 cycles CPU_CLK 2. 962 GHz TLB utilization 1790. 78 refs/miss 3. 498 avg uses D 1 cache hit, miss ratios 94. 8% hits 5. 2% misses D 1 cache utilization (misses) 19. 13 refs/miss 2. 392 avg hits D 2 cache hit, miss ratio 87. 8% hits 12. 2% misses D 1+D 2 cache hit, miss ratio 99. 4% hits 0. 6% misses D 1+D 2 cache utilization 156. 20 refs/miss 19. 525 avg hits D 2 to D 1 bandwidth 3601. 274 MB/sec 1149978757281 bytes

Disable Cray BLAS autotuning • If you are debugging and use the Cray Lib. Sci library then you may want to disable autotuning. • Ensures autotuning is not causing the error. • Add: CRAYBLAS_AUTOTUNING_OFF=1 to your job scripts.

Using ATP • ATP (Abnormal Termination Processing) catches dying applications and produces a merged stack backtrace • Useful for getting more information on crashes • Set: ATP_ENABLED=1 in your job submission script. • There is no need to recompile to use ATP

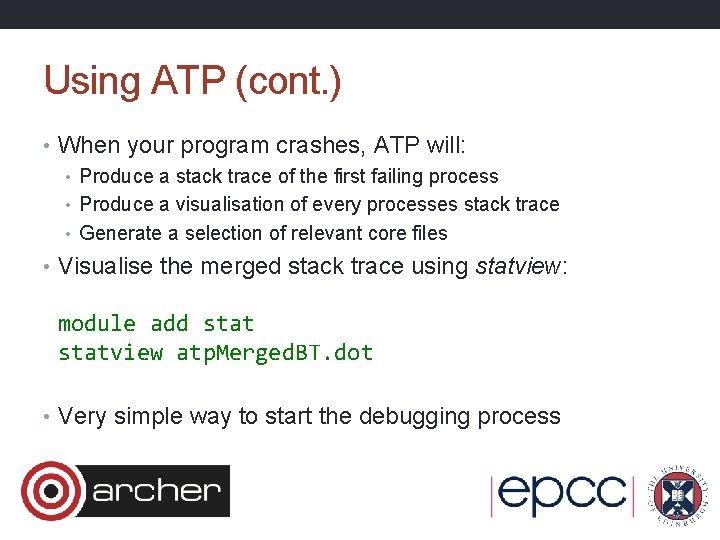
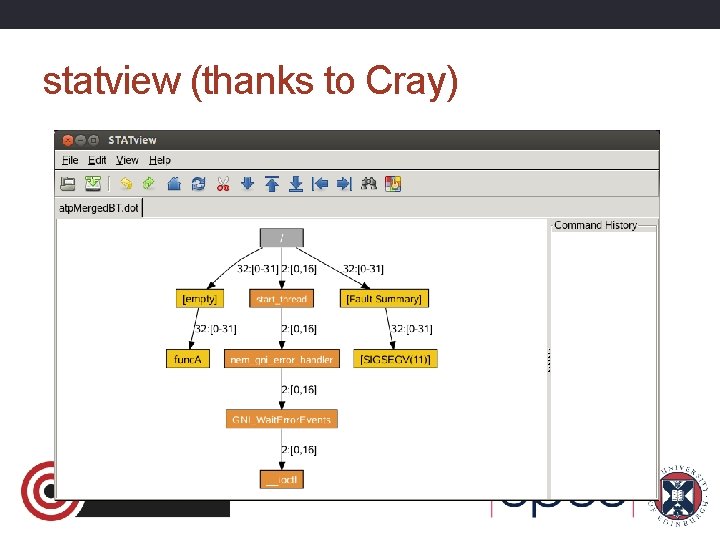
Using ATP (cont. ) • When your program crashes, ATP will: • Produce a stack trace of the first failing process • Produce a visualisation of every processes stack trace • Generate a selection of relevant core files • Visualise the merged stack trace using statview: module add statview atp. Merged. BT. dot • Very simple way to start the debugging process

statview (thanks to Cray)