Arc Sight Enterprise Security Analyst AESA Using Dashboards

Arc. Sight Enterprise Security Analyst (AESA) Using Dashboards and Data Monitors ESMSA 50. v 3
Module 8: Topics • • Dashboards Custom View Dashboards Displaying Custom View Dashboards Data Monitors – Event-based Data Monitors – Correlation Data Monitors – Non-event Based Data Monitors • Types of Event-based Data Monitors • Correlation Data Monitors • Non-event Based Data Monitors
Module 8: Objectives At the end of this module, you will be able to: • Define Data Monitors and Dashboards • List the functions and characteristics of Dashboards • Identify Data Monitor types and their characteristics
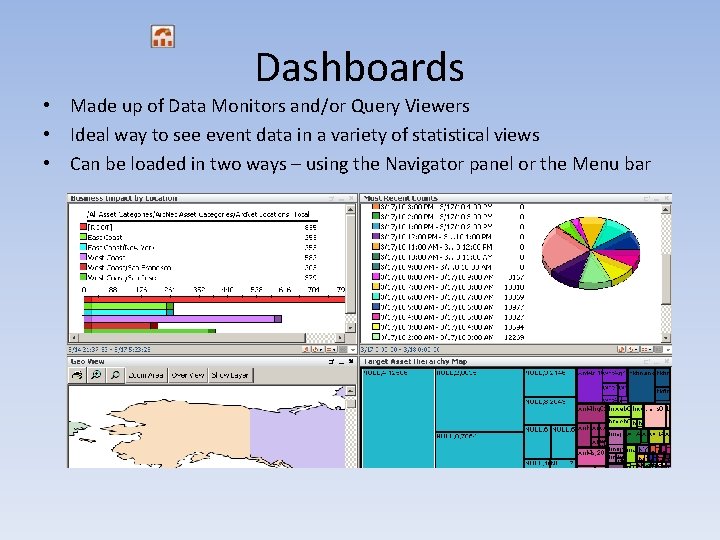
Dashboards • Made up of Data Monitors and/or Query Viewers • Ideal way to see event data in a variety of statistical views • Can be loaded in two ways – using the Navigator panel or the Menu bar
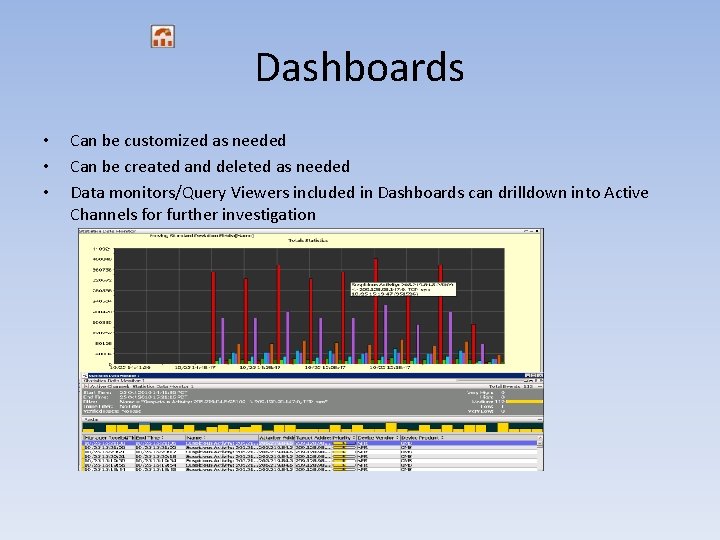
Dashboards • • • Can be customized as needed Can be created and deleted as needed Data monitors/Query Viewers included in Dashboards can drilldown into Active Channels for further investigation
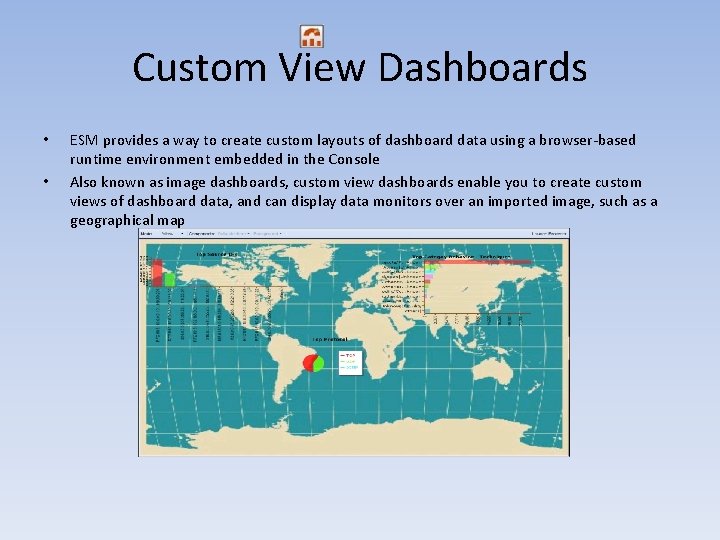
Custom View Dashboards • • ESM provides a way to create custom layouts of dashboard data using a browser-based runtime environment embedded in the Console Also known as image dashboards, custom view dashboards enable you to create custom views of dashboard data, and can display data monitors over an imported image, such as a geographical map
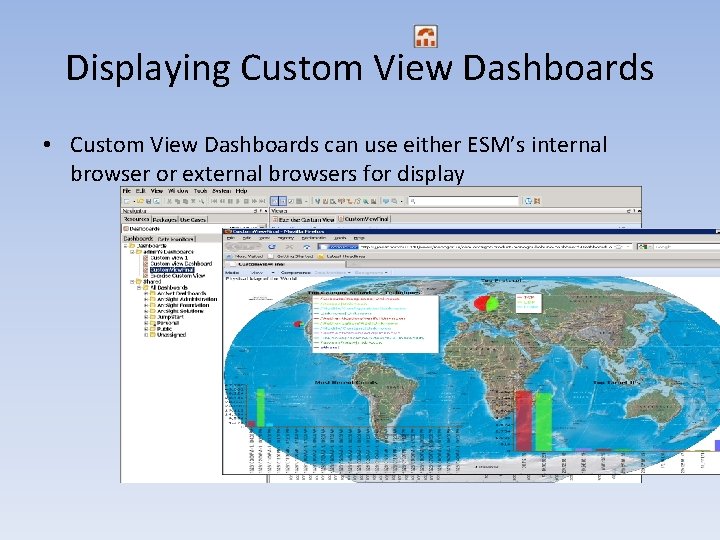
Displaying Custom View Dashboards • Custom View Dashboards can use either ESM’s internal browser or external browsers for display
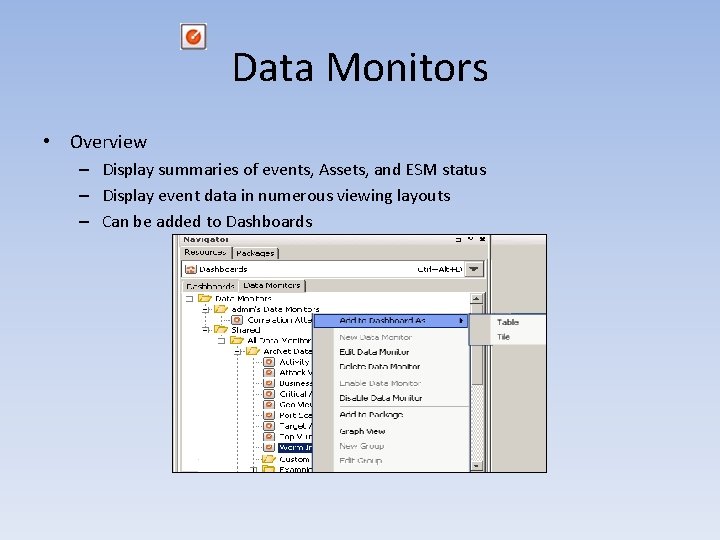
Data Monitors • Overview – Display summaries of events, Assets, and ESM status – Display event data in numerous viewing layouts – Can be added to Dashboards
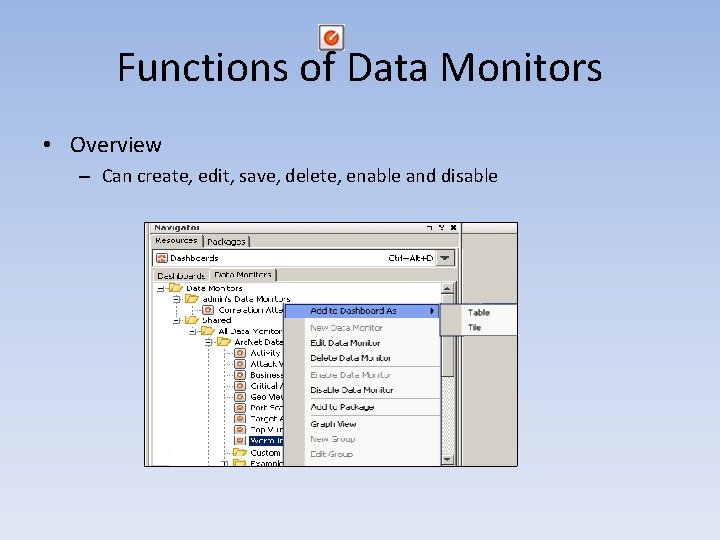
Functions of Data Monitors • Overview – Can create, edit, save, delete, enable and disable
Types of Event-based Data Monitors Types of Data Monitors: • Asset Category Count • Event Graph • Geographic Event Graph • Hierarchy Map • Hourly Counts • Last N Events • Last State • Top Value Counts (Bucketized)
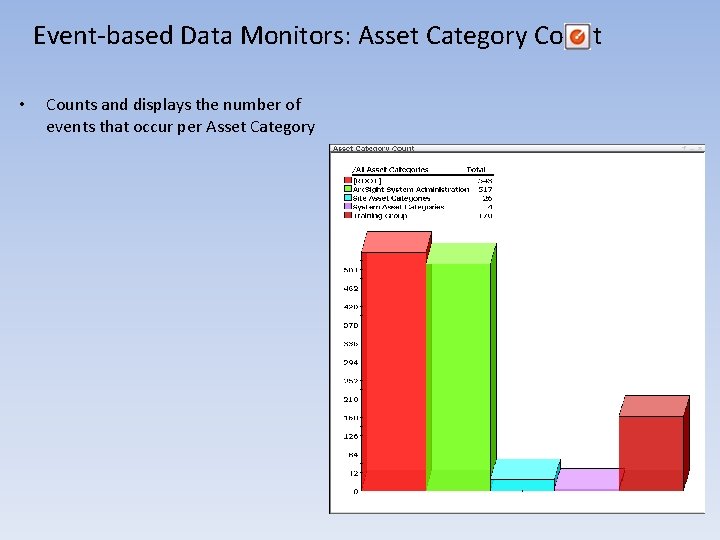
Event-based Data Monitors: Asset Category Count • Counts and displays the number of events that occur per Asset Category
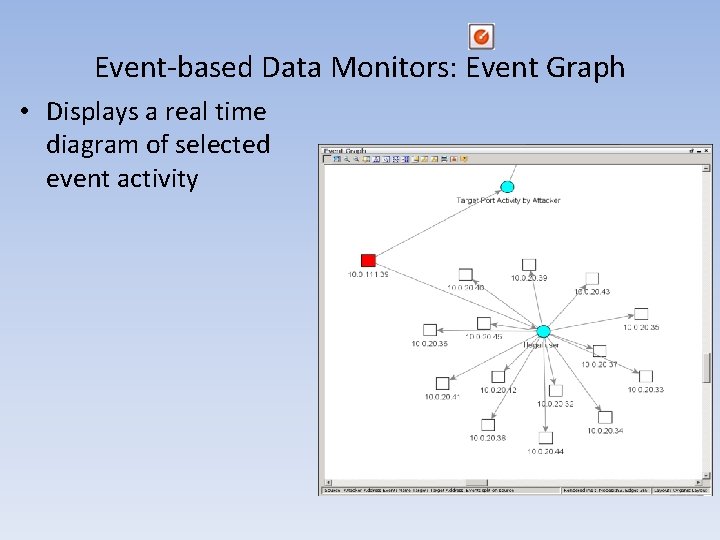
Event-based Data Monitors: Event Graph • Displays a real time diagram of selected event activity
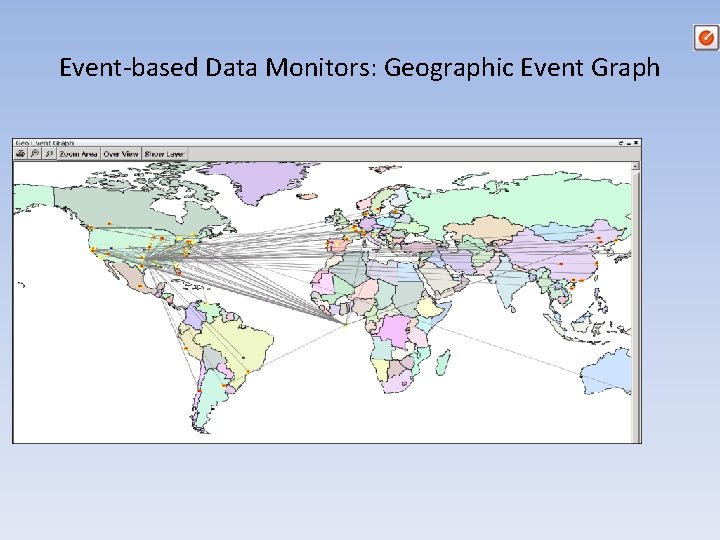
Event-based Data Monitors: Geographic Event Graph • Displays a real time geographic map of selected event activity
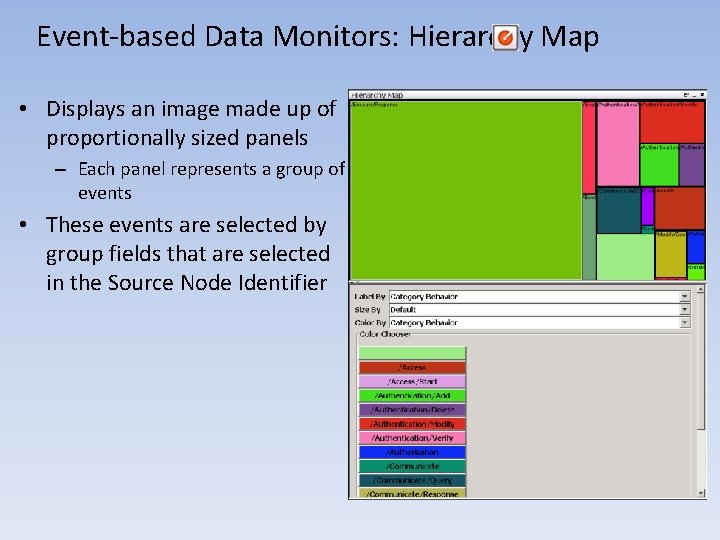
Event-based Data Monitors: Hierarchy Map • Displays an image made up of proportionally sized panels – Each panel represents a group of events • These events are selected by group fields that are selected in the Source Node Identifier
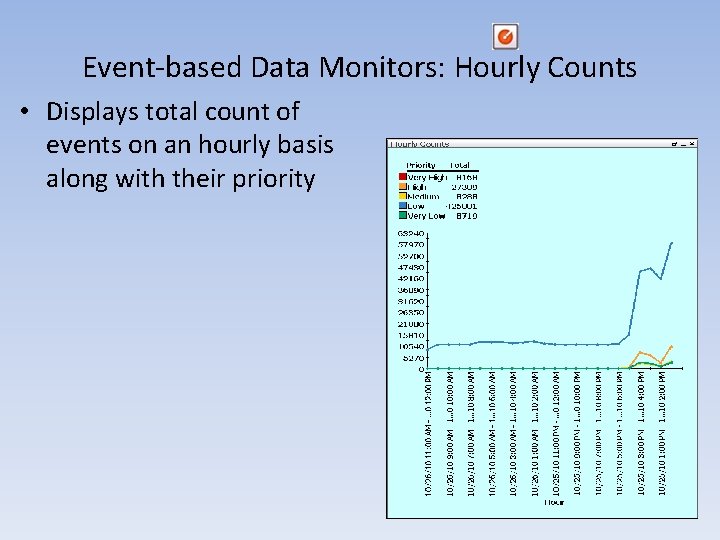
Event-based Data Monitors: Hourly Counts • Displays total count of events on an hourly basis along with their priority
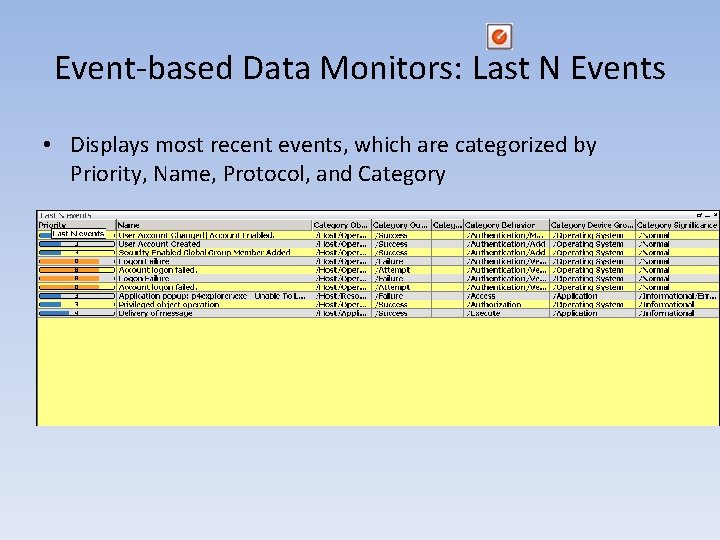
Event-based Data Monitors: Last N Events • Displays most recent events, which are categorized by Priority, Name, Protocol, and Category
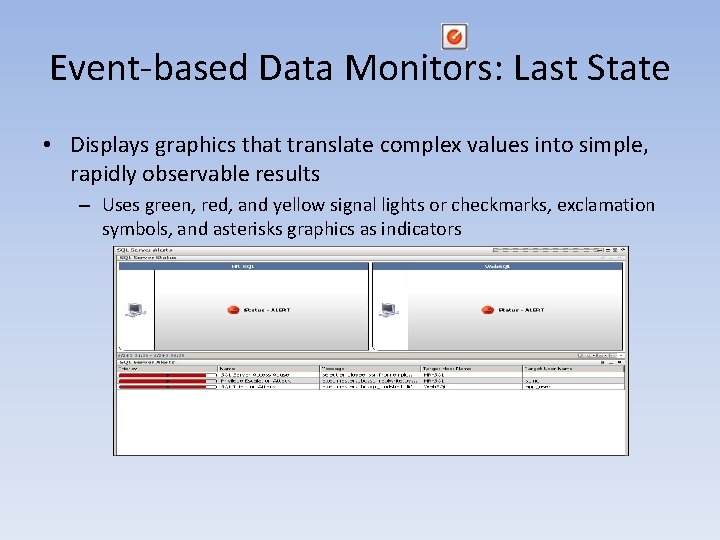
Event-based Data Monitors: Last State • Displays graphics that translate complex values into simple, rapidly observable results – Uses green, red, and yellow signal lights or checkmarks, exclamation symbols, and asterisks graphics as indicators
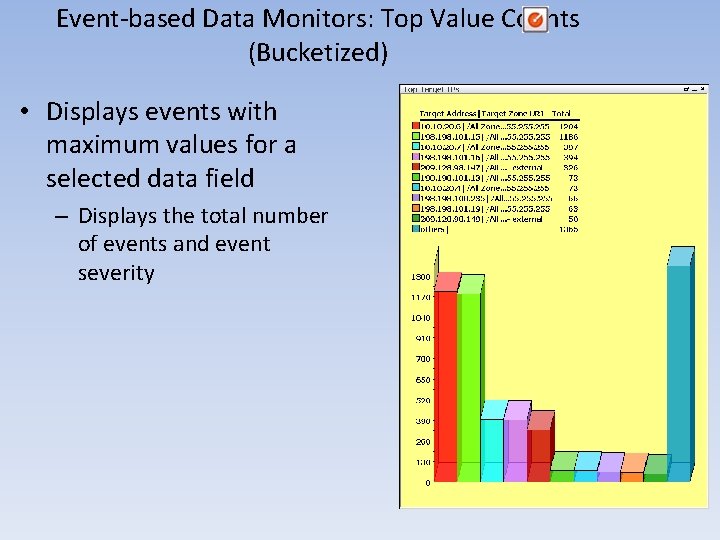
Event-based Data Monitors: Top Value Counts (Bucketized) • Displays events with maximum values for a selected data field – Displays the total number of events and event severity
Types of Correlation Data Monitors • • • Event Correlation Event Reconciliation Moving Average Session Reconciliation Statistics
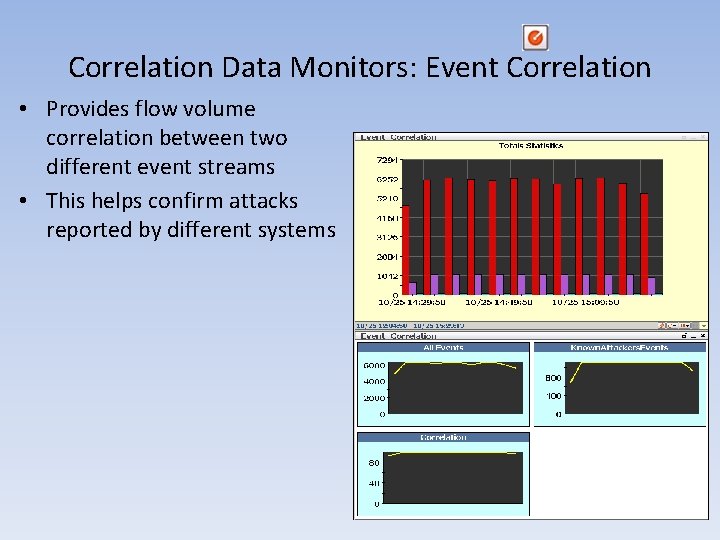
Correlation Data Monitors: Event Correlation • Provides flow volume correlation between two different event streams • This helps confirm attacks reported by different systems
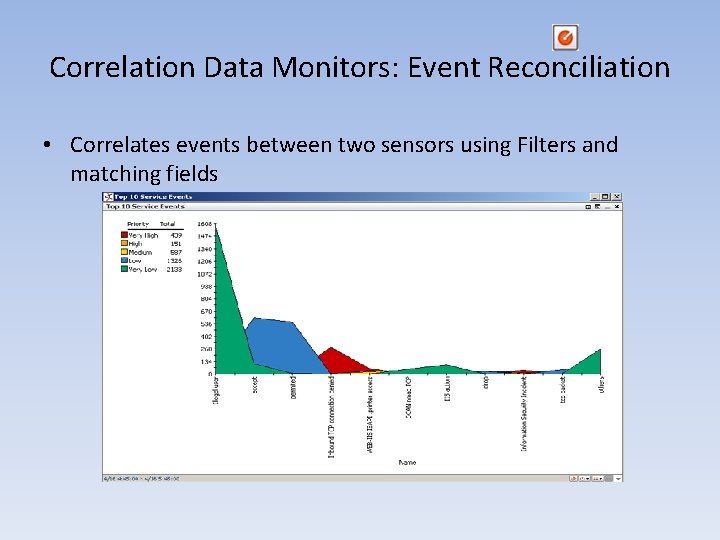
Correlation Data Monitors: Event Reconciliation • Correlates events between two sensors using Filters and matching fields
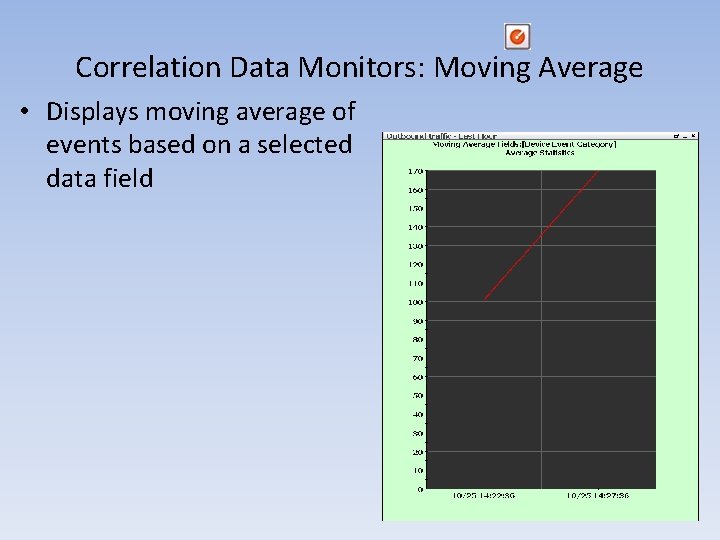
Correlation Data Monitors: Moving Average • Displays moving average of events based on a selected data field
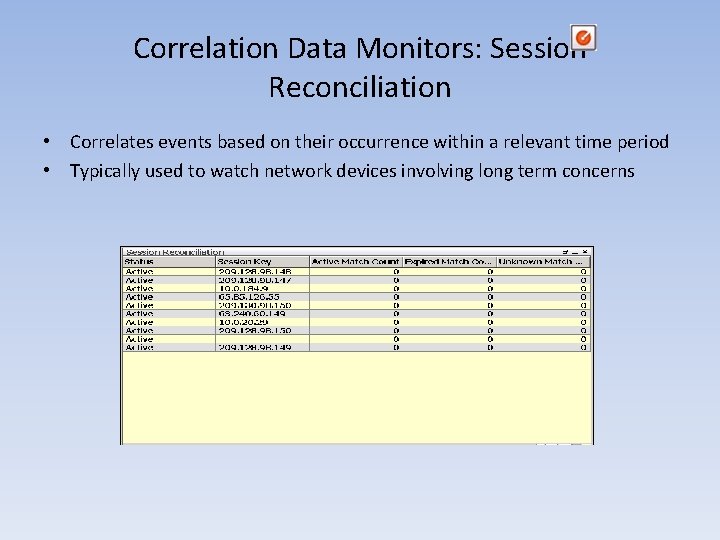
Correlation Data Monitors: Session Reconciliation • Correlates events based on their occurrence within a relevant time period • Typically used to watch network devices involving long term concerns
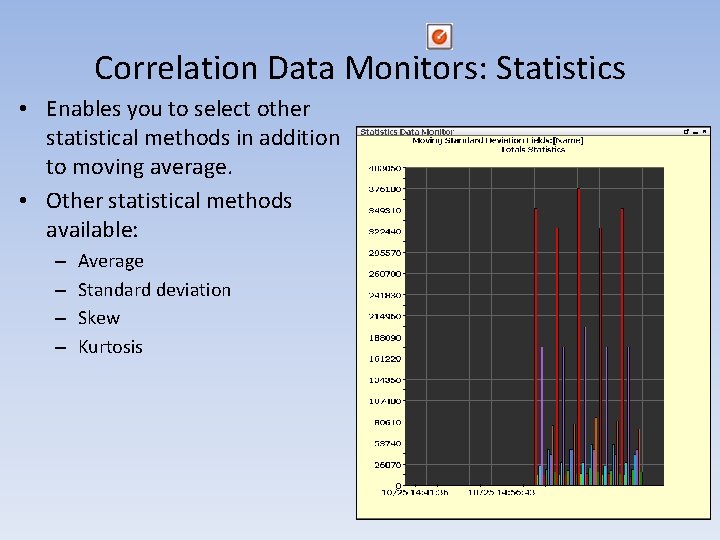
Correlation Data Monitors: Statistics • Enables you to select other statistical methods in addition to moving average. • Other statistical methods available: – – Average Standard deviation Skew Kurtosis
Types of Non-event Based Data Monitors • System Monitor –Displays measurements based on ESM Manager’s internal systems, Java classes, and attributes • System Monitor Attribute – Displays specific attributes of a given internal Arc. Sight Java class • Rules Partial Match – Displays Rules that have partial matches and the total number of partially matched events within a specified time frame
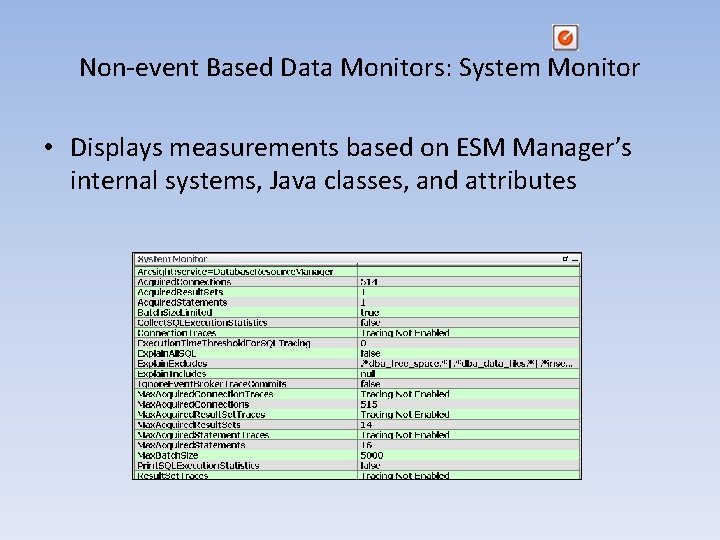
Non-event Based Data Monitors: System Monitor • Displays measurements based on ESM Manager’s internal systems, Java classes, and attributes
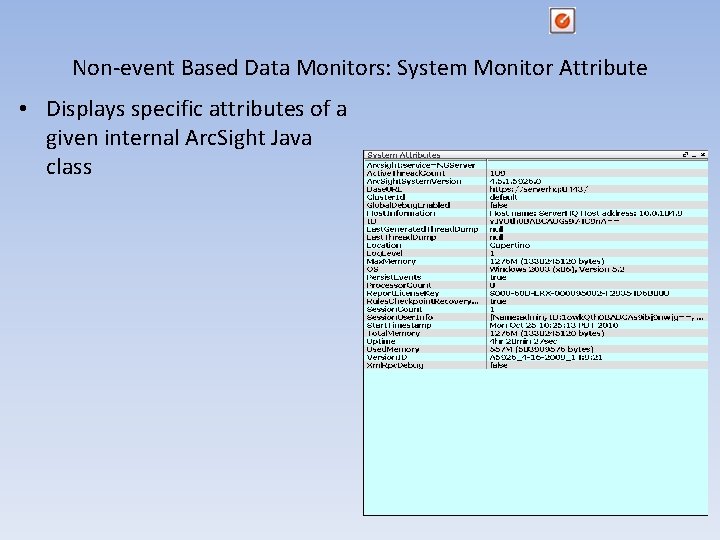
Non-event Based Data Monitors: System Monitor Attribute • Displays specific attributes of a given internal Arc. Sight Java class
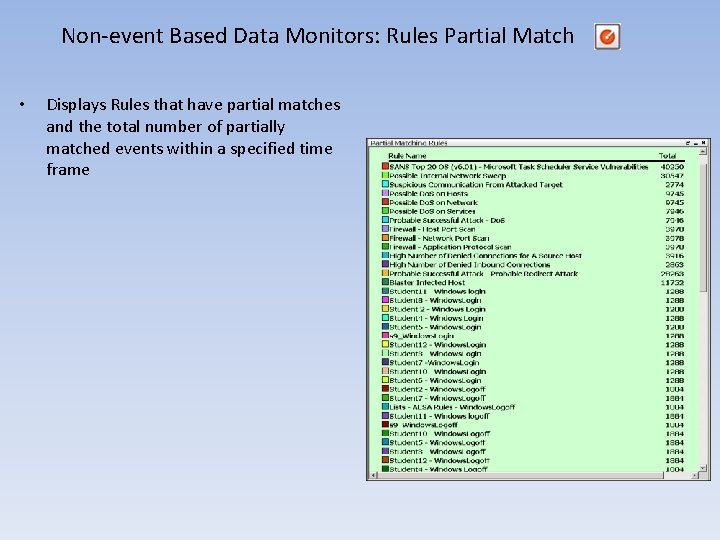
Non-event Based Data Monitors: Rules Partial Match • Displays Rules that have partial matches and the total number of partially matched events within a specified time frame
- Slides: 28