Arc elasticity of demand or Mid point method


 Q 1 – Q (")


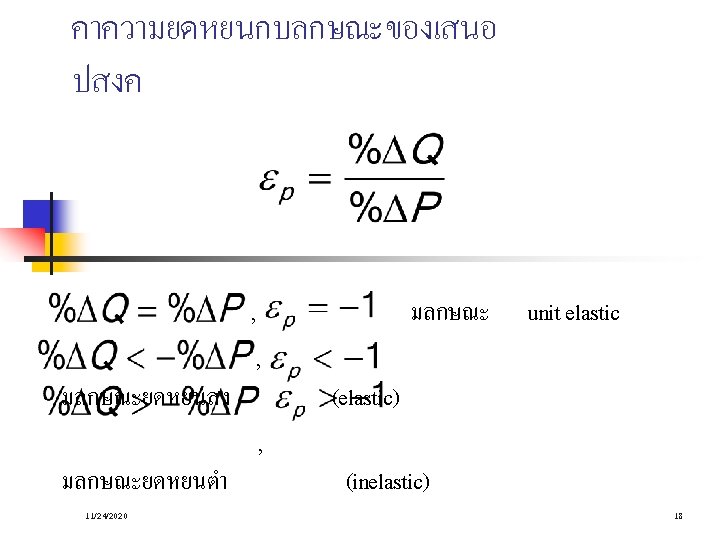


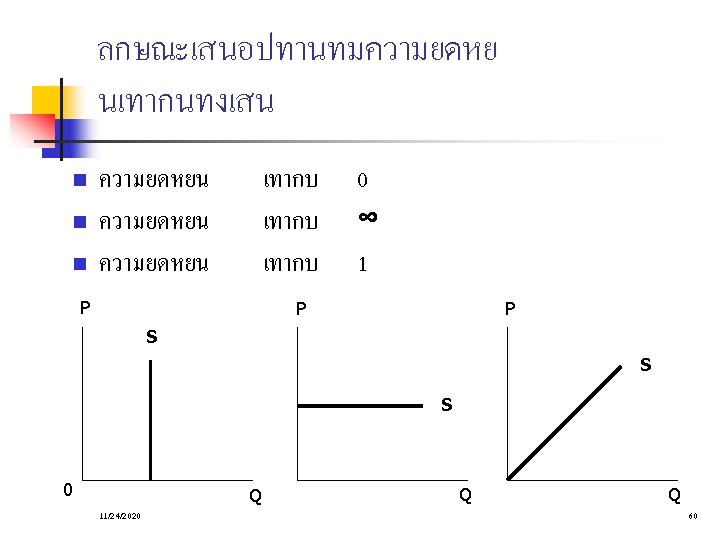
 Perfectly Inelastic Demand: Elasticity Equals 0")
 Inelastic Demand: Elasticity Is Less Than")
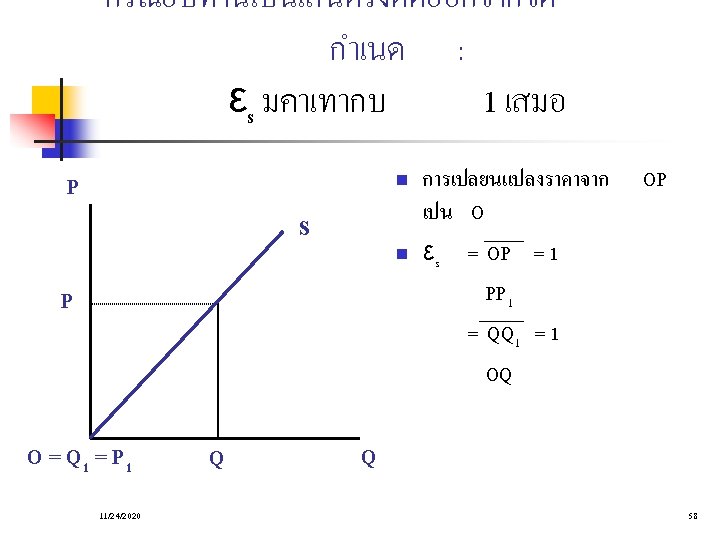
 Unit Elastic Demand: Elasticity Equals 1")
 Elastic Demand: Elasticity Is Greater Than")
 Perfectly Elastic Demand: Elasticity Equals Infinity")
 P 0")


- Slides: 67
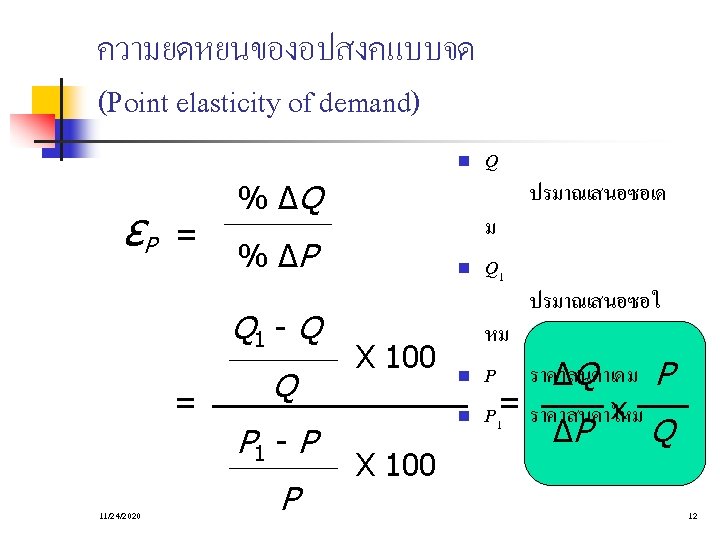
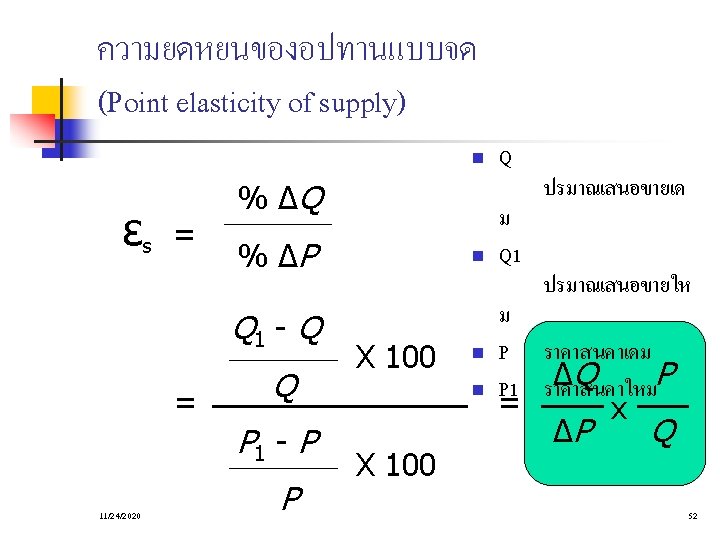
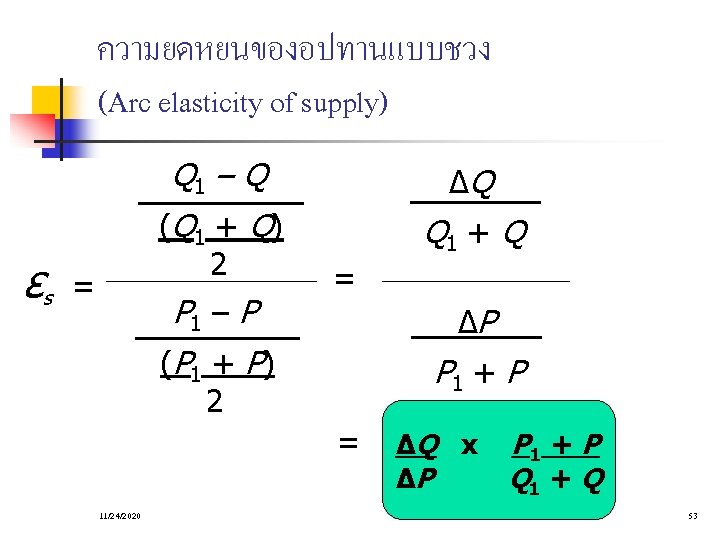
ความยดหยนของอปสงคแบบชวง (Arc elasticity of demand or Mid point method) Q 1 – Q ( Q 1 + Q) εP 2 = P 1 – P ( P 1 + P) ΔQ Q 1 + Q = ΔP P 1 + P 2 = 11/24/2020 ΔQ x ΔP P 1 + P Q 1 + Q 13
The Variety of Demand Curves n Because the price elasticity of demand measures how much quantity demanded responds to the price, it is closely related to the slope of the demand curve. 11/24/2020 20
Figure 1 The Price Elasticity of Demand (a) Perfectly Inelastic Demand: Elasticity Equals 0 Price Demand $5 4 1. An increase in price. . . 0 100 Quantity 2. . leaves the quantity demanded unchanged. 11/24/2020 21 Copyright© 2003 Southwestern/Thomson Learning
Figure 1 The Price Elasticity of Demand (b) Inelastic Demand: Elasticity Is Less Than 1 Price $5 4 1. A 22% increase in price. . . Demand 0 90 100 Quantity 2. . leads to an 11% decrease in quantity demanded. 11/24/2020 22
Figure 1 The Price Elasticity of Demand (c) Unit Elastic Demand: Elasticity Equals 1 Price $5 4 Demand 1. A 22% increase in price. . . 0 80 100 Quantity 2. . leads to a 22% decrease in quantity demanded. 11/24/2020 23 Copyright© 2003 Southwestern/Thomson Learning
Figure 1 The Price Elasticity of Demand (d) Elastic Demand: Elasticity Is Greater Than 1 Price $5 4 Demand 1. A 22% increase in price. . . 0 50 100 Quantity 2. . leads to a 67% decrease in quantity demanded. 11/24/2020 24
Figure 1 The Price Elasticity of Demand (e) Perfectly Elastic Demand: Elasticity Equals Infinity Price 1. At any price above $4, quantity demanded is zero. $4 Demand 2. At exactly $4, consumers will buy any quantity. 0 3. At a price below $4, quantity demanded is infinite. 11/24/2020 Quantity 25
Figure 2 Total Revenue Price $4 P × Q = $400 (revenue) P 0 Demand 100 11/24/2020 Q Quantity 27 Copyright© 2003 Southwestern/Thomson Learning
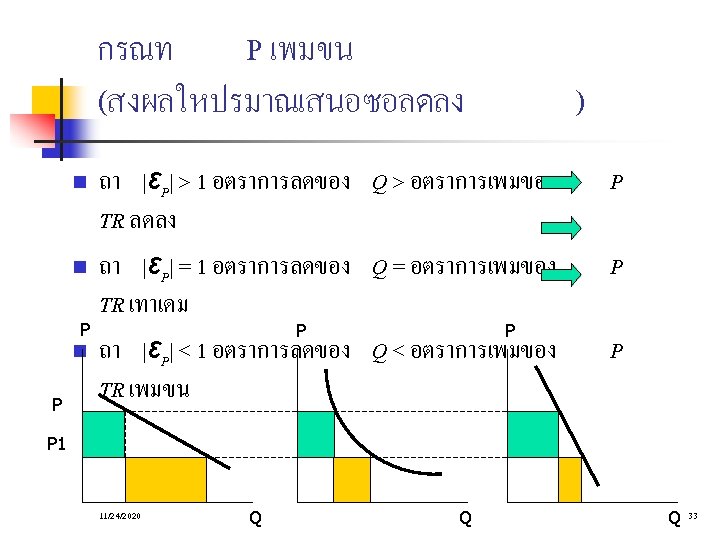
Elasticity and Total Revenue along a Linear Demand Curve n With an inelastic demand curve, an increase in price leads to a decrease in quantity that is proportionately smaller. Thus, total revenue increases. 11/24/2020 28
Figure 3 How Total Revenue Changes When Price Changes: Inelastic Demand Price An Increase in price from $1 to $3 … … leads to an Increase in total revenue from $100 to $240 $3 Revenue = $240 $1 Demand Revenue = $100 0 100 11/24/2020 Quantity Demand 0 80 Quantity 29 Copyright© 2003 Southwestern/Thomson Learning
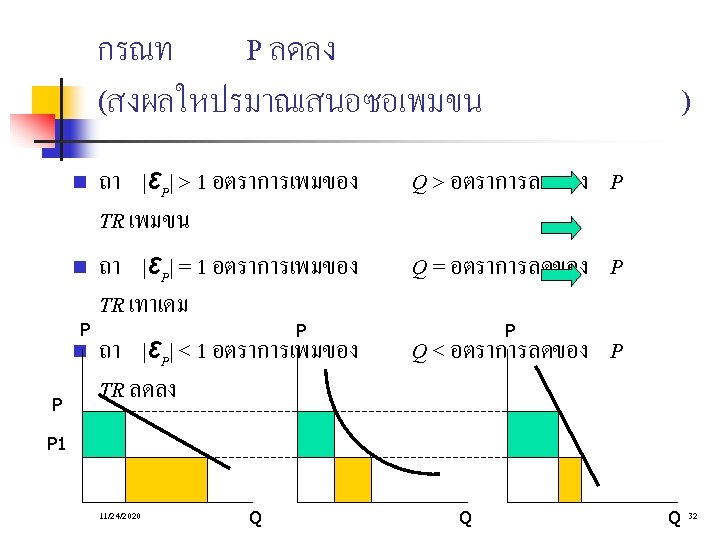
Elasticity and Total Revenue along a Linear Demand Curve n With an elastic demand curve, an increase in the price leads to a decrease in quantity demanded that is proportionately larger. Thus, total revenue decreases. 11/24/2020 30
Figure 4 How Total Revenue Changes When Price Changes: Elastic Demand Price An Increase in price from $4 to $5 … … leads to an decrease in total revenue from $200 to $100 $5 $4 Demand Revenue = $200 0 50 11/24/2020 Revenue = $100 Quantity 0 20 Quantity 31 Copyright© 2003 Southwestern/Thomson Learning
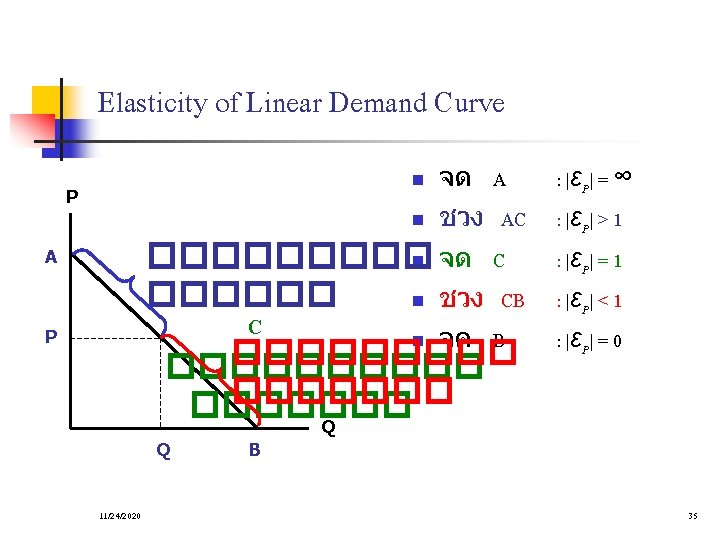
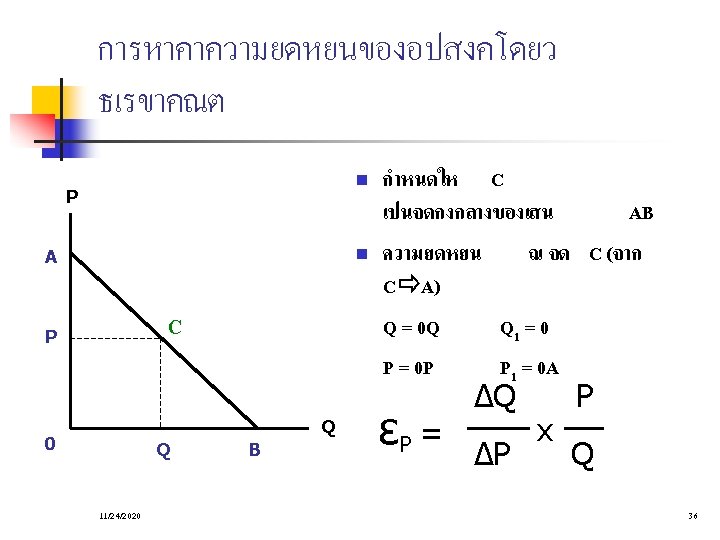
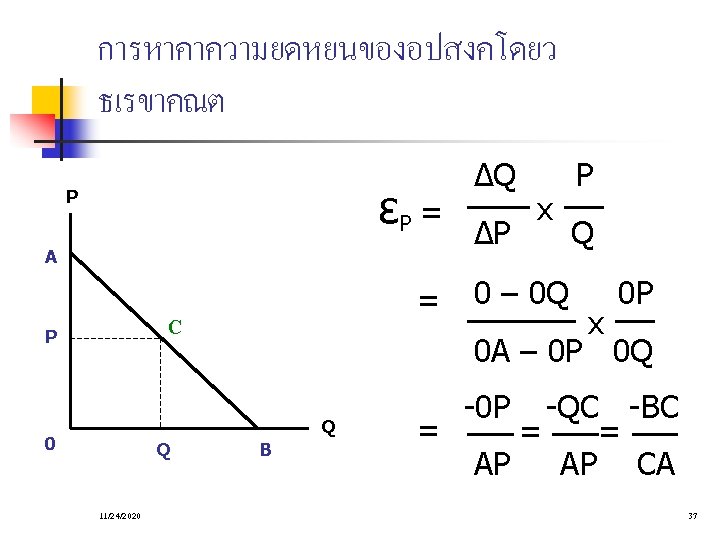
Elasticity of a Linear Demand Curve 11/24/2020 34
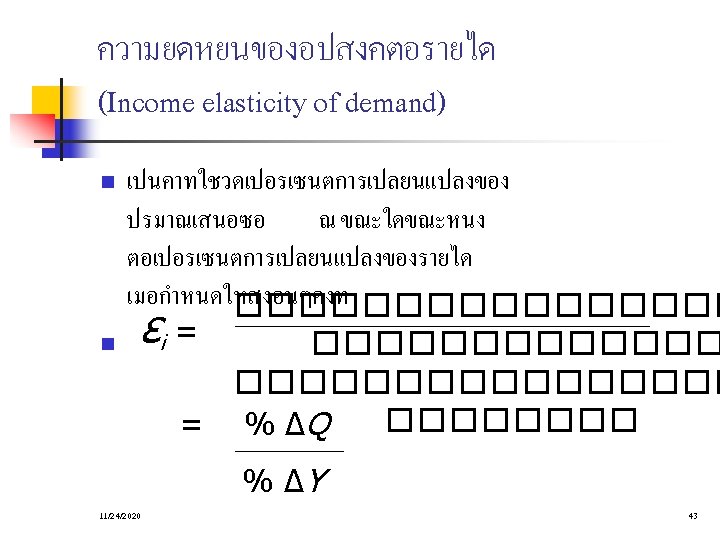
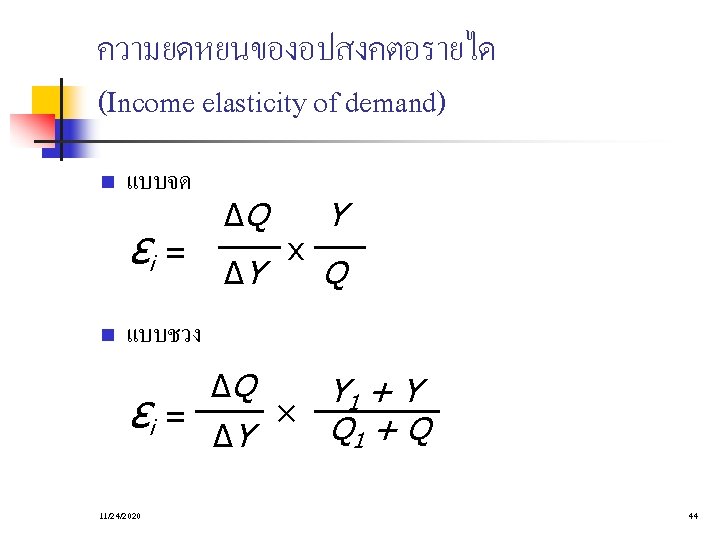
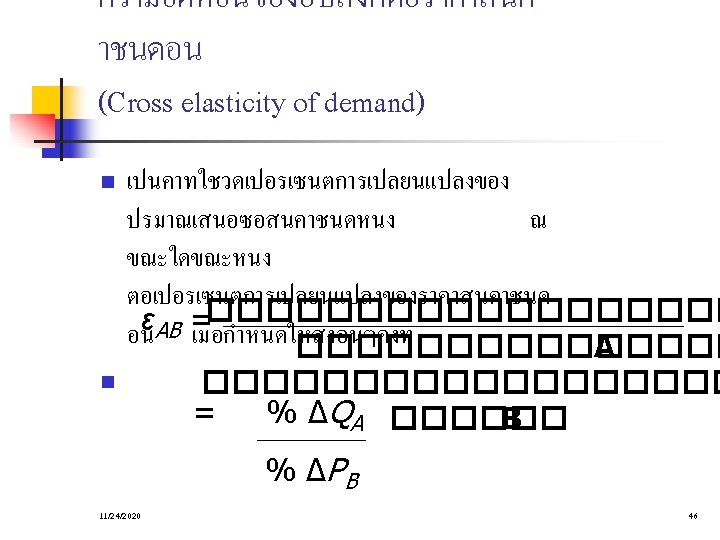
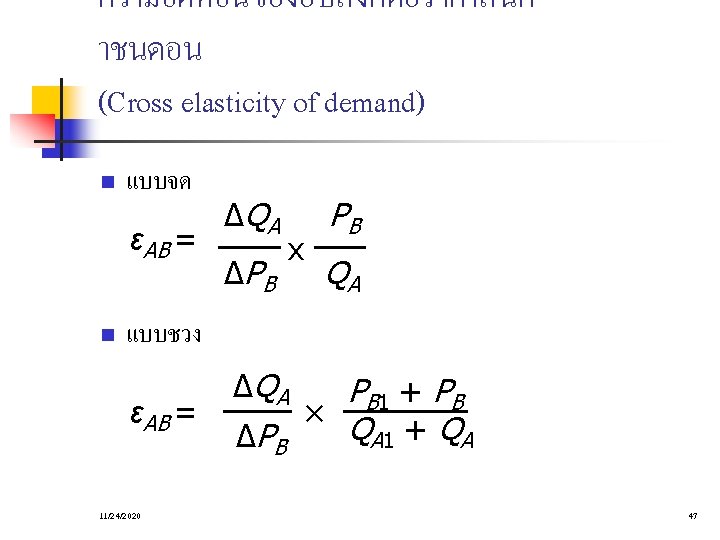
Other Demand Elasticities n The income elasticity of demand n n Measure how quantity demanded change as consumer income changes. The cross-price elasticity of demand n 11/24/2020 Measure how the quantity demanded of one good changes as the price of another good changes. 42
APPLICATION of ELASTICITY Can good news for farming be bad news for farmers? n What happens to wheat farmers and the market for wheat when university agronomists discover a new wheat hybrid that is more productive than existing varieties? n 11/24/2020 63
THE APPLICATION OF SUPPLY, DEMAND, AND ELASTICITY Examine whether the supply or demand curve shifts. n Determine the direction of the shift of the curve. n Use the supply-and-demand diagram to see how the market equilibrium changes. n 11/24/2020 64
Figure 8 An Increase in Supply in the Market for Wheat Price of Wheat 2. . leads to a large fall in price. . . 1. When demand is inelastic, an increase in supply. . . S 1 S 2 $3 2 Demand 0 11/24/2020 100 110 Quantity of Wheat 3. . and a proportionately smaller increase in quantity sold. As a result, revenue falls from $300 to $220. 65 Copyright© 2003 Southwestern/Thomson Learning