
April 25 Exam April 27 bring calculator with

April 25 • Exam April 27 (bring calculator with exp) – 15 multiple choice – 4 problems • • Cox-Regression Review notes Practice questions Description of project
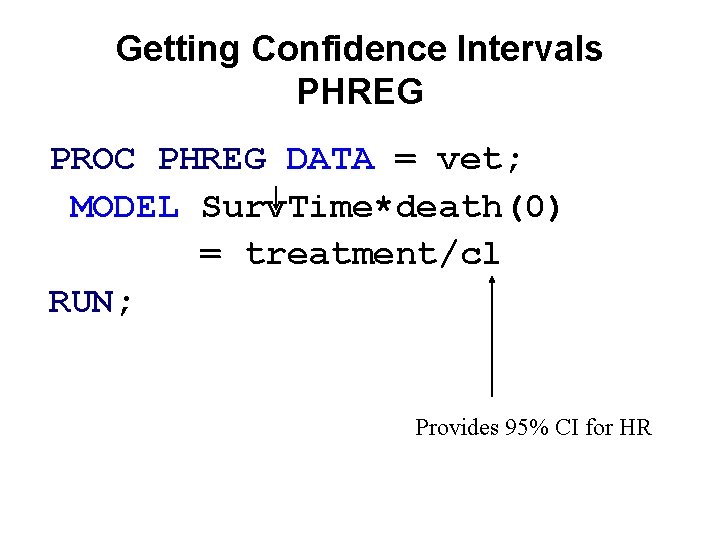
Getting Confidence Intervals PHREG PROC PHREG DATA = vet; MODEL Surv. Time*death(0) = treatment/cl RUN; Provides 95% CI for HR
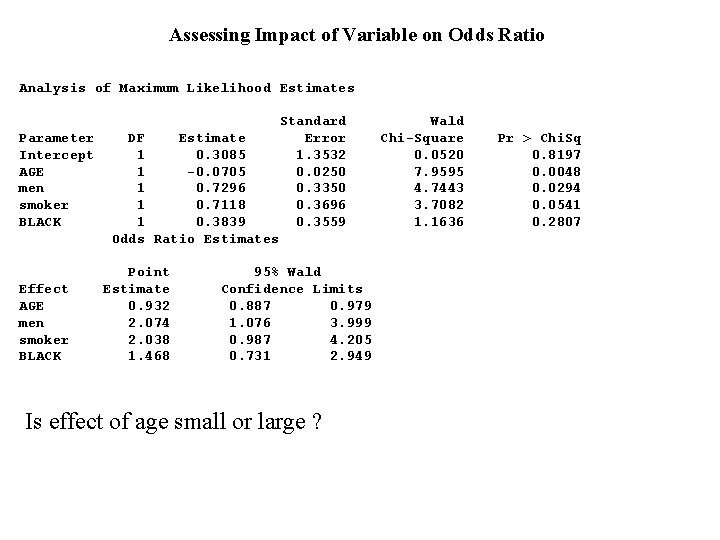
Assessing Impact of Variable on Odds Ratio Analysis of Maximum Likelihood Estimates Parameter Intercept AGE men smoker BLACK Effect AGE men smoker BLACK Standard Error 1. 3532 0. 0250 0. 3350 0. 3696 0. 3559 DF Estimate 1 0. 3085 1 -0. 0705 1 0. 7296 1 0. 7118 1 0. 3839 Odds Ratio Estimates Point Estimate 0. 932 2. 074 2. 038 1. 468 95% Wald Confidence Limits 0. 887 0. 979 1. 076 3. 999 0. 987 4. 205 0. 731 2. 949 Is effect of age small or large ? Wald Chi-Square 0. 0520 7. 9595 4. 7443 3. 7082 1. 1636 Pr > Chi. Sq 0. 8197 0. 0048 0. 0294 0. 0541 0. 2807
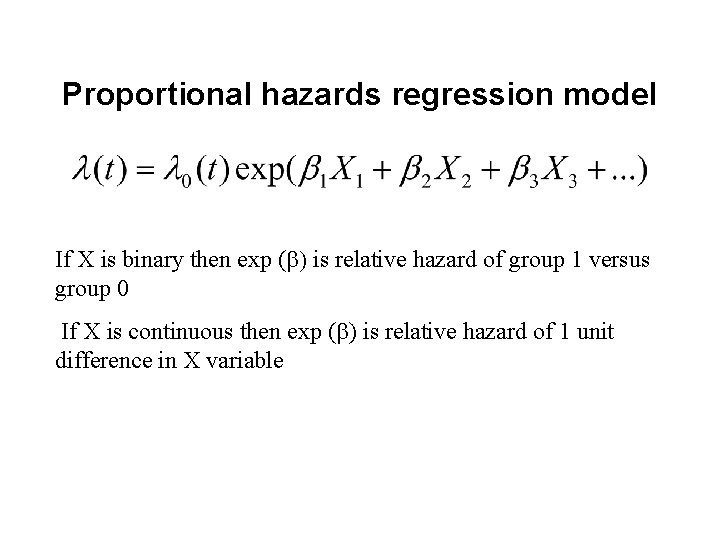
Proportional hazards regression model If X is binary then exp (b) is relative hazard of group 1 versus group 0 If X is continuous then exp (b) is relative hazard of 1 unit difference in X variable
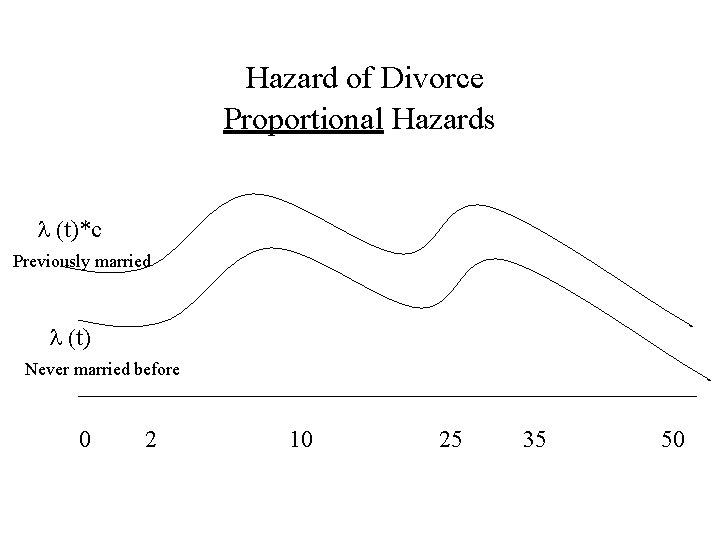
Hazard of Divorce Proportional Hazards l (t)*c Previously married l (t) Never married before 0 2 10 25 35 50
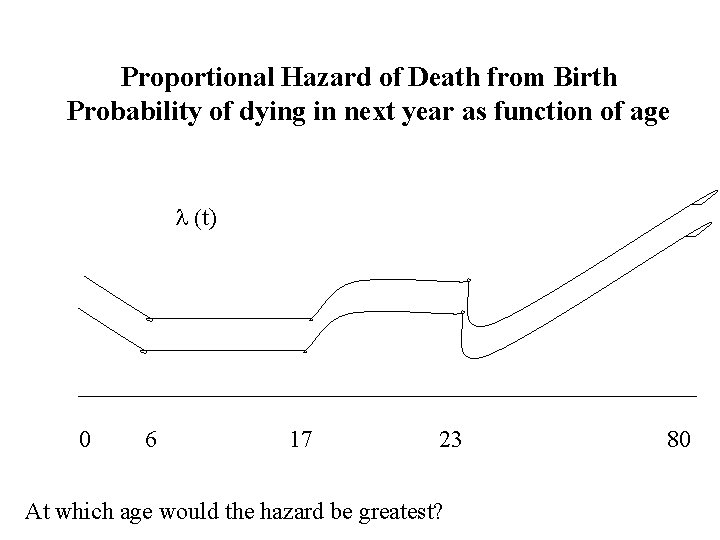
Proportional Hazard of Death from Birth Probability of dying in next year as function of age l (t) 0 6 17 23 At which age would the hazard be greatest? 80
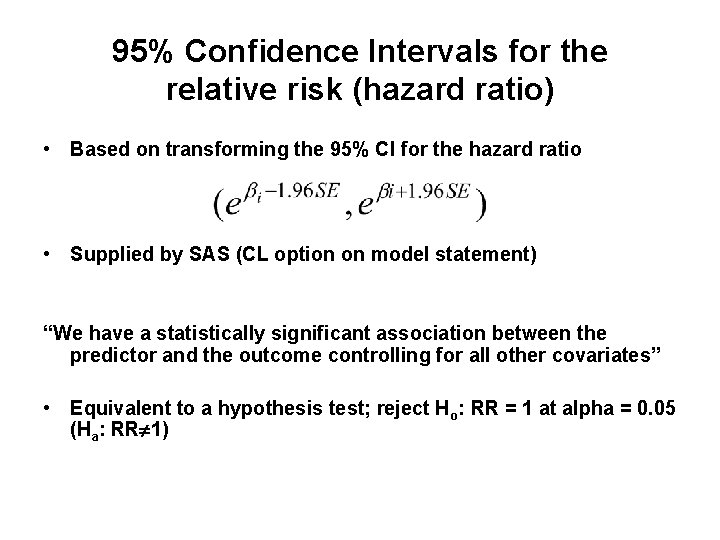
95% Confidence Intervals for the relative risk (hazard ratio) • Based on transforming the 95% CI for the hazard ratio • Supplied by SAS (CL option on model statement) “We have a statistically significant association between the predictor and the outcome controlling for all other covariates” • Equivalent to a hypothesis test; reject Ho: RR = 1 at alpha = 0. 05 (Ha: RR 1)
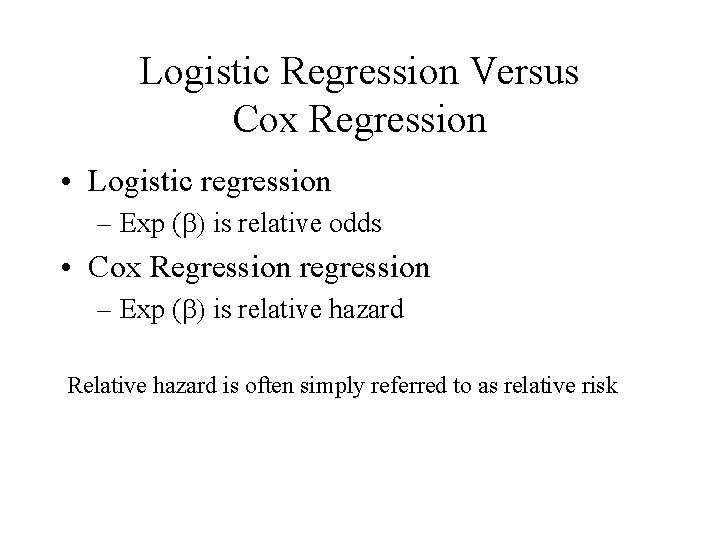
Logistic Regression Versus Cox Regression • Logistic regression – Exp (b) is relative odds • Cox Regression regression – Exp (b) is relative hazard Relative hazard is often simply referred to as relative risk
Example survival analysis • Veteran’s Administration lung cancer data • 137 Males with inoperable lung cancer • Randomized to standard or new chemo therapy • Primary endpoint; time to death • 9 observations censored – 9 patients survived for length of study
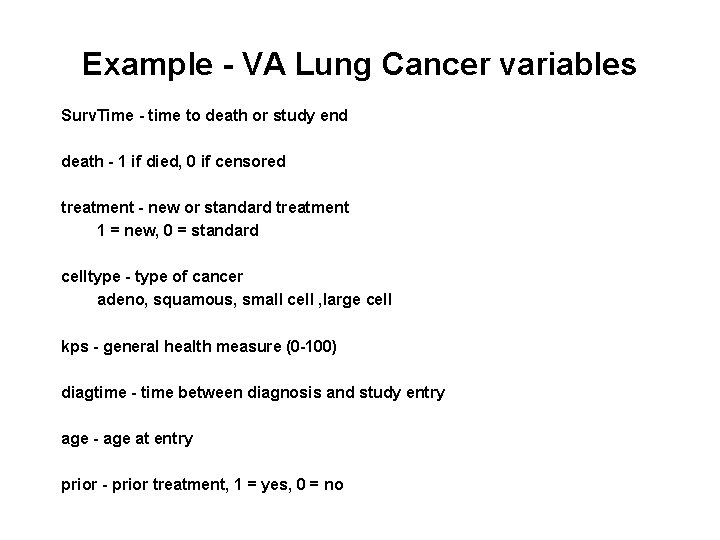
Example - VA Lung Cancer variables Surv. Time - time to death or study end death - 1 if died, 0 if censored treatment - new or standard treatment 1 = new, 0 = standard celltype - type of cancer adeno, squamous, small cell , large cell kps - general health measure (0 -100) diagtime - time between diagnosis and study entry age - age at entry prior - prior treatment, 1 = yes, 0 = no
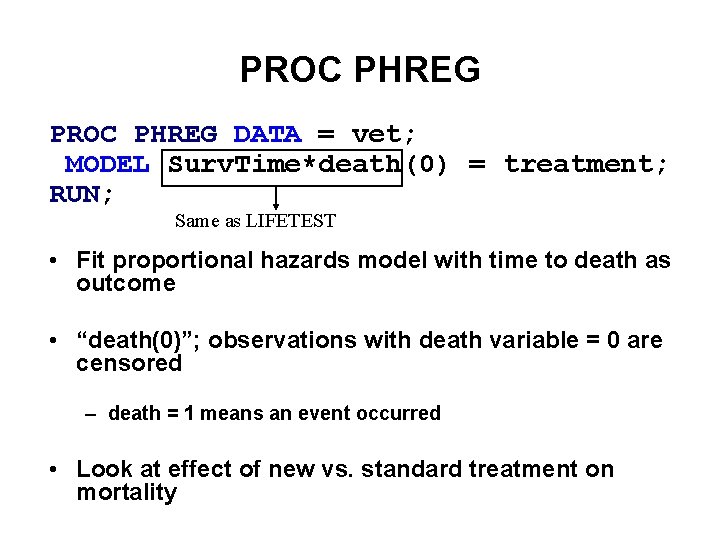
PROC PHREG DATA = vet; MODEL Surv. Time*death(0) = treatment; RUN; Same as LIFETEST • Fit proportional hazards model with time to death as outcome • “death(0)”; observations with death variable = 0 are censored – death = 1 means an event occurred • Look at effect of new vs. standard treatment on mortality
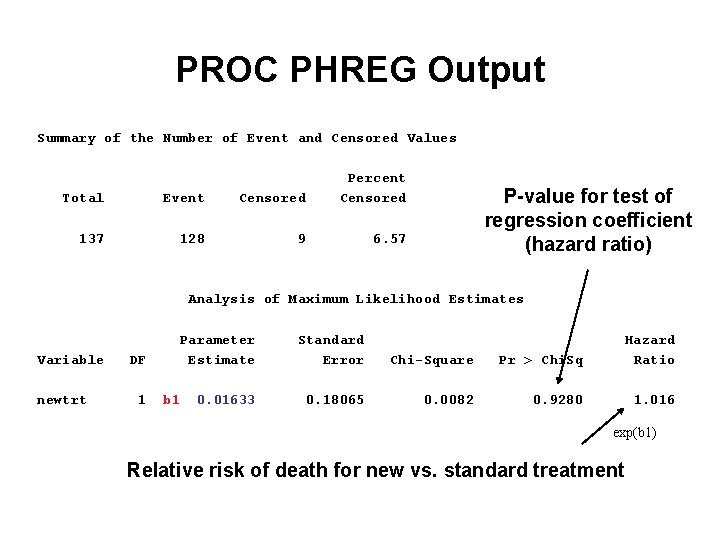
PROC PHREG Output Summary of the Number of Event and Censored Values Total Event Censored Percent Censored 137 128 9 6. 57 P-value for test of regression coefficient (hazard ratio) Analysis of Maximum Likelihood Estimates Variable newtrt DF 1 Parameter Estimate b 1 0. 01633 Standard Error Chi-Square Pr > Chi. Sq Hazard Ratio 0. 18065 0. 0082 0. 9280 1. 016 exp(b 1) Relative risk of death for new vs. standard treatment
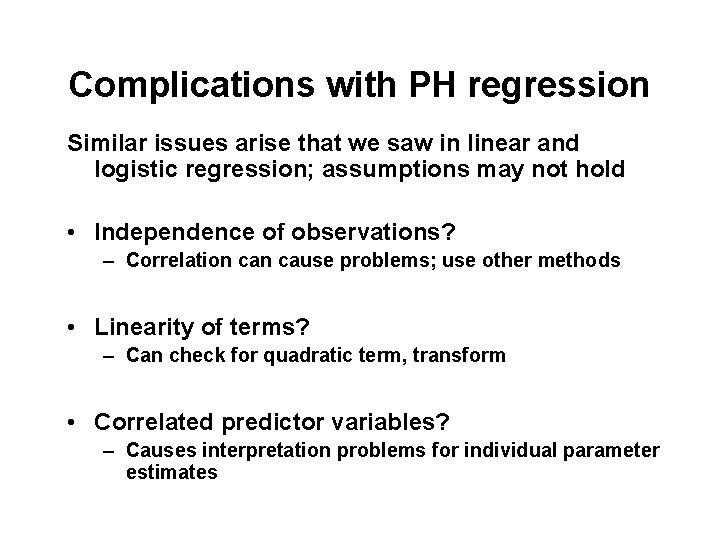
Complications with PH regression Similar issues arise that we saw in linear and logistic regression; assumptions may not hold • Independence of observations? – Correlation cause problems; use other methods • Linearity of terms? – Can check for quadratic term, transform • Correlated predictor variables? – Causes interpretation problems for individual parameter estimates
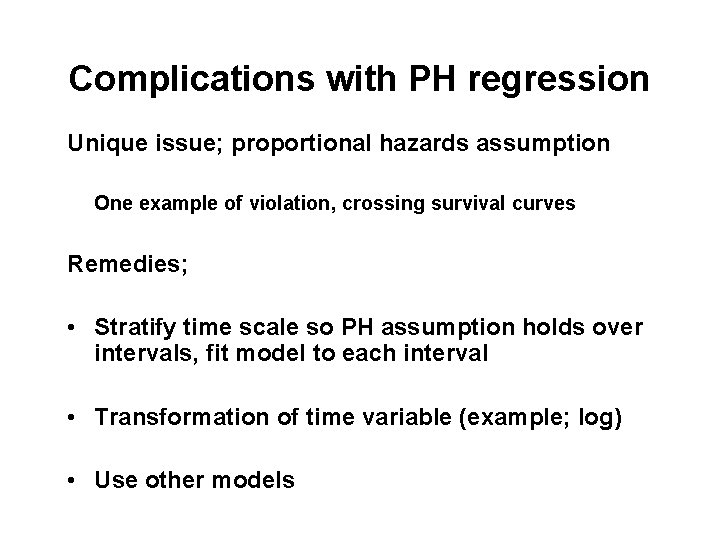
Complications with PH regression Unique issue; proportional hazards assumption One example of violation, crossing survival curves Remedies; • Stratify time scale so PH assumption holds over intervals, fit model to each interval • Transformation of time variable (example; log) • Use other models
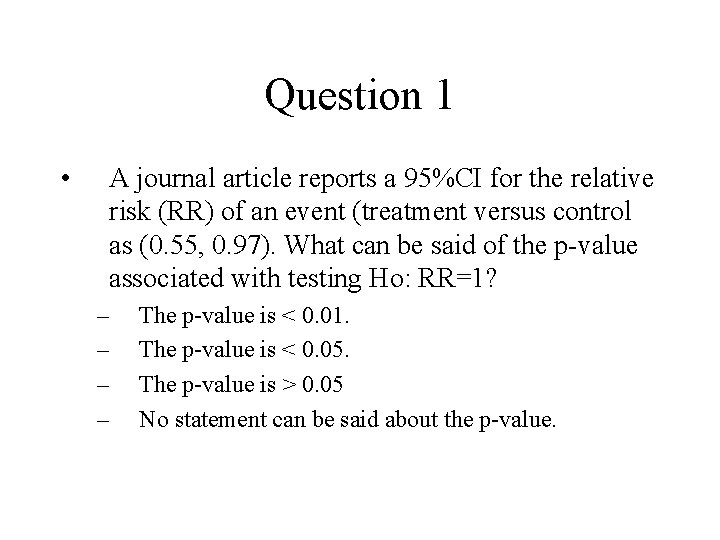
Question 1 • A journal article reports a 95%CI for the relative risk (RR) of an event (treatment versus control as (0. 55, 0. 97). What can be said of the p-value associated with testing Ho: RR=1? – – The p-value is < 0. 01. The p-value is < 0. 05. The p-value is > 0. 05 No statement can be said about the p-value.
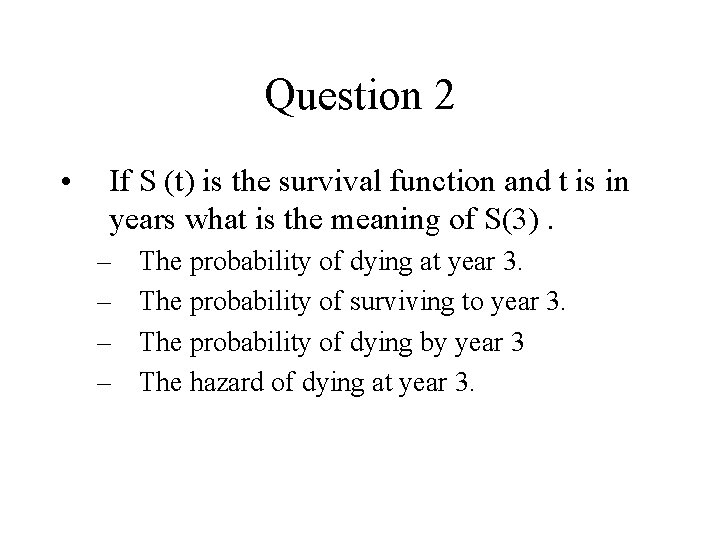
Question 2 • If S (t) is the survival function and t is in years what is the meaning of S(3). – – The probability of dying at year 3. The probability of surviving to year 3. The probability of dying by year 3 The hazard of dying at year 3.
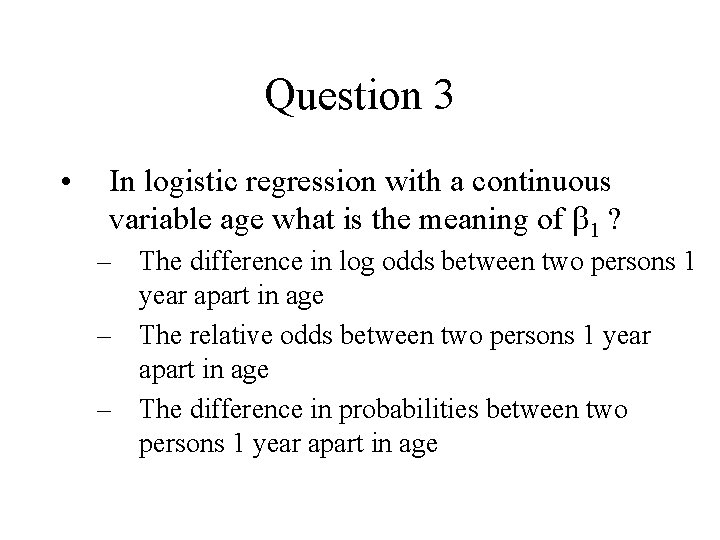
Question 3 • In logistic regression with a continuous variable age what is the meaning of b 1 ? – The difference in log odds between two persons 1 year apart in age – The relative odds between two persons 1 year apart in age – The difference in probabilities between two persons 1 year apart in age
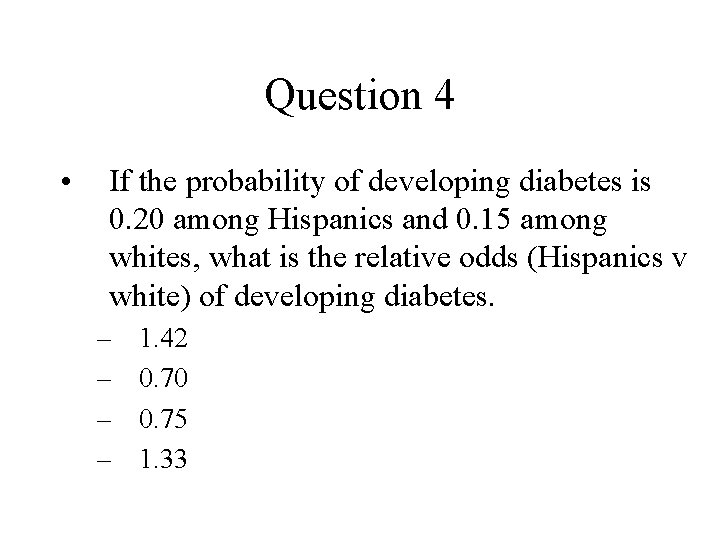
Question 4 • If the probability of developing diabetes is 0. 20 among Hispanics and 0. 15 among whites, what is the relative odds (Hispanics v white) of developing diabetes. – – 1. 42 0. 70 0. 75 1. 33
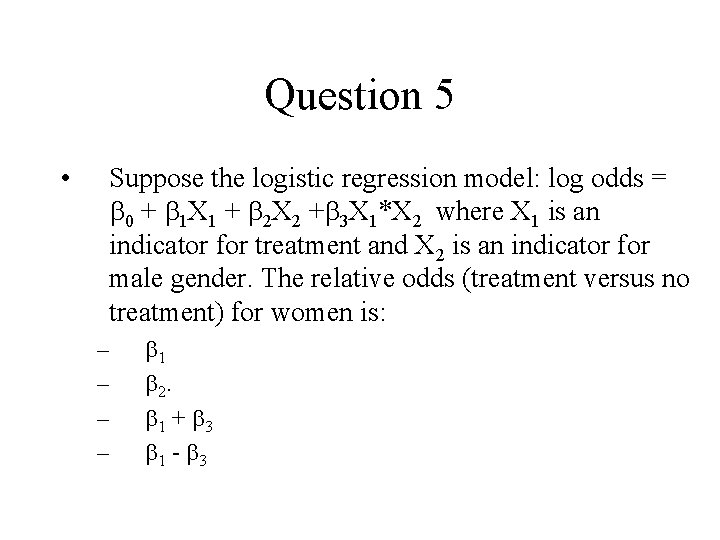
Question 5 • Suppose the logistic regression model: log odds = b 0 + b 1 X 1 + b 2 X 2 +b 3 X 1*X 2 where X 1 is an indicator for treatment and X 2 is an indicator for male gender. The relative odds (treatment versus no treatment) for women is: – – b 1 b 2. b 1 + b 3 b 1 - b 3
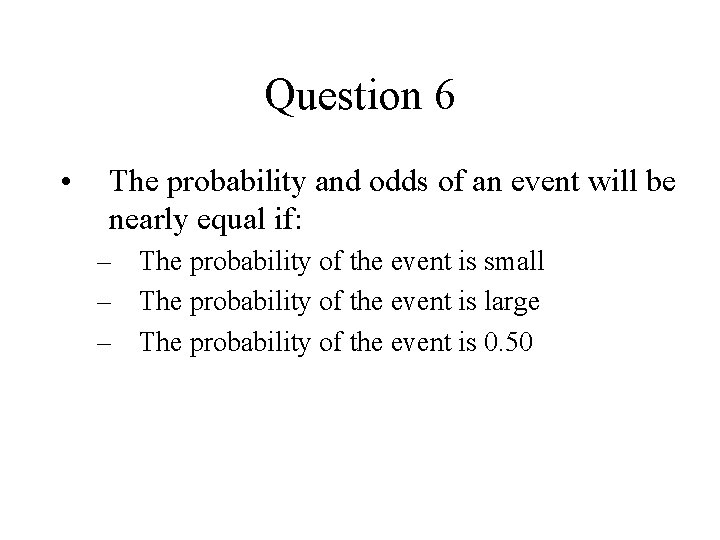
Question 6 • The probability and odds of an event will be nearly equal if: – The probability of the event is small – The probability of the event is large – The probability of the event is 0. 50
- Slides: 20