Approaching NELA data How to access process your

 guide to")


 is plotted over time (x-axis)")


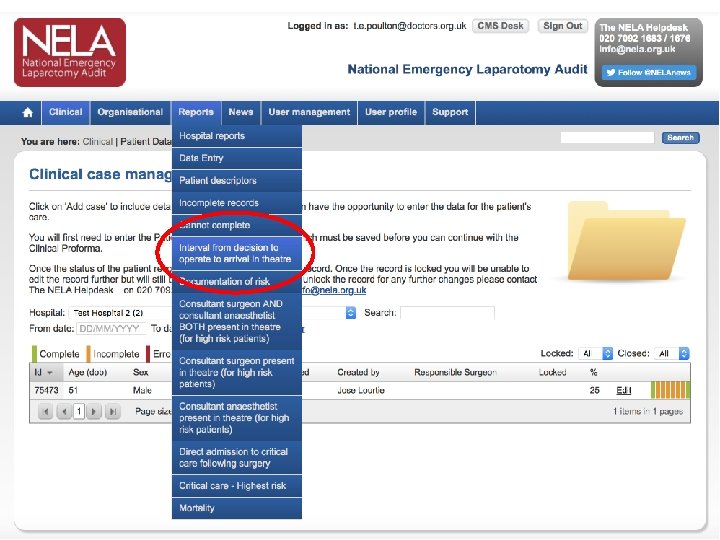
 chart Control limits Set mathematically, if measures go outside these then the")


- Slides: 22
Approaching NELA data
• How to access & process your NELA data • (Short) guide to run charts • (Even shorter) intro to SPC
Log in to your NELA data….
Access QI dashboard reports
Access QI dashboard reports Chose date range Chose locked/unlocked
Access QI dashboard reports National data Hospital median Hospital data
Exporting dataset
Exporting data
NELA data approaches: using run charts
Establishing measures • Outcome measures • Reflect the impact on a patient and demonstrate the end result of doing things • NELA outcomes are mortality, length of stay and complications (unplanned returns to theatres, unplanned admission to ITU) • Process measures • Reflect the things that you do (processes) and how systems are operating • NELA process measures include admission to ITU, treatment parameters in sepsis, consultant delivered care etc
Why use a run chart?
Why use a run chart?
Run chart • Line graph where your measure (y-axis) is plotted over time (x-axis) • Usually plotted with a median • Effects of changes or interventions can be easily visualised and understood over time
Run chart
Run chart rules- 1. Trend - 6 data points moving in same direction
Run chart rules: 2. Shift - 5 data points in a row below/above the median line
Run chart rules: 3. Astronomical data point
NELA data access: A short bit on SPC charts
SPC (Shewhart) chart Control limits Set mathematically, if measures go outside these then the process is not stable Control limits
Recap of this session • Understand how to access and manipulate your NELA data • Understand the basis for using run charts and some simple rules of interpretation • (Introduction to SPC charts)
Any questions?