
Applying Mesoscopic Simulation to Evacuation Planning for the








- Slides: 57
Applying Meso-scopic Simulation to Evacuation Planning for the Houston Region Chi Ping Lam, Houston-Galveston Area Council Colby Brown, Citilabs Chris Van Slyke, Houston-Galveston Area Council Heng Wang, Houston-Galveston Area Council
Acknowledge § Special thanks to Alan Clark, the executive director of Houston-Galveston Area Council, for his supports for this project § Special thanks to Matthew Martimo for his vigorous testing on DTA assignments § Citilabs and Texas Transportation Institute
Outlines 1. 2. 3. 4. Background Introduction to Meso-scopic Assignment Improve Model Performance Re-generate Real World Scenario a) Detect Network and Demand coding issues through normal daily run b) Evacuation results 5. Sensitivity for Different Evacuaton Scenarios 6. Next Steps
Background
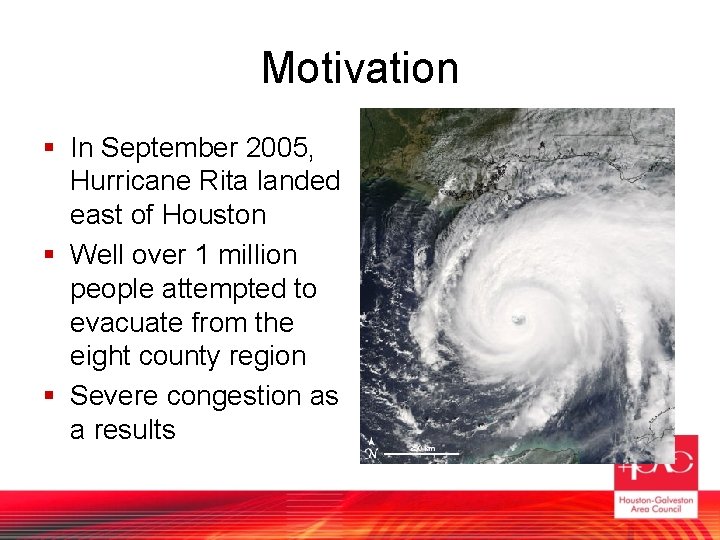
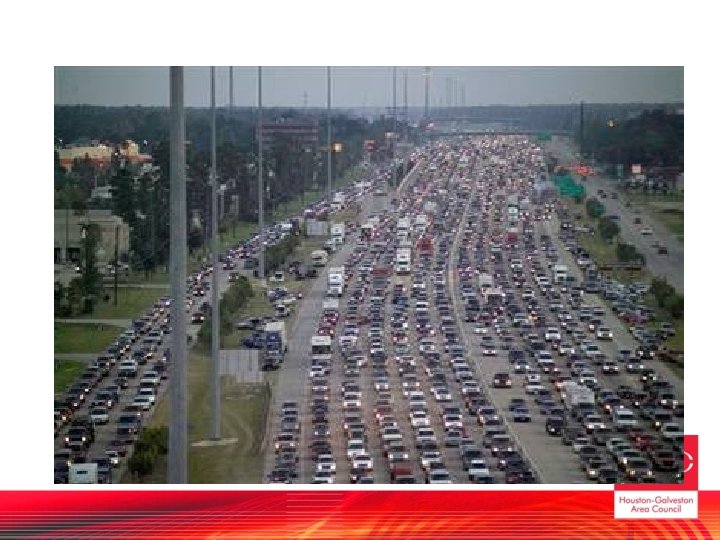
Motivation § In September 2005, Hurricane Rita landed east of Houston § Well over 1 million people attempted to evacuate from the eight county region § Severe congestion as a results
In response… § H-GAC coordinated with various governmental agencies to develop a hurricane evacuation plan. § H-GAC was asked to develop a tool for evacuation planning – an evacuation model
Goal of this model § § Re-generate the Rita evacuations Provide evacuation demands Estimate traffic volumes and delays Sensitive to various scenarios and plans
Project Management § Joint project of Citilabs and H-GAC § H-GAC and TTI develops the trip table (presented in last planning conference) § Citilabs provides the Dynamic Traffic Assignment software and constantly enhancing it, partly based on our recommendations. (Special thanks to Matthew Martimo) § Citilabs delivers a draft version of the model in summer 2008 § H-GAC is currently on validate the results and enhance the models to our needs.
Introduction to Mesoscopic Assignment
Why not use traditional methods? § Why NOT use traditional (Static) assignment? – Cannot model impact of queues to adjacent links – Not conducive to time-series analysis – Allow volume over capacity § Why NOT use traffic micro-simulation? – – – Usually for smaller scale project Study area of interest too large and complex Too much data Too many uncertainties to model accurately Likely crashed in regional scale
Meso. Scopic Models § Possible to quickly analyze larger areas with a more detailed model which overcomes the pitfalls of the macroscopic travel demand models. – Takes into account intersection configurations and controls – More detailed estimates of delay, travel time, and capacities – Enforces capacity limitations and the effects of queues ‘blocking back’ – Models flow curves and changing demand throughout an analysis period
Transportation modeling tools § Macroscopic Modeling § Mesoscopic Modeling § Microscopic Modeling
What is mesoscopic model? § Method of system-level (regional) assignment analysis which seeks to track the progress of a trip through the regional network over time § Accounts for buildup of queues due to congestion and/or incidents § Track movement of individual packets over time § Flow-based calculation § A bridge between traditional region-level static assignment and corridor-level micro-simulation
Improve Model Performance
Performance Issues § Initial testing were dodged with problems – Long running time: Takes days to complete the model – the model may crash before it completes – Results not make sense: calibration and validation needed § Four major causes of the slow and unreliable performance issues – Large number of zones and packets – Overloading due to too few iterations and path choices – Network and demand coding issues
Packets § A packet is a group of vehicles coming from the same origin to the same destination within a time period § The basic simulation unit in the dynamic traffic assignment § Each packet can hold any number of trips § Since a packet could hold more than one vehicle, simulating packets should reduce run time and memory consumption
Memory Constraints § 32 bit computing (Windows XP) limits a single process to access at most 2 GB computer memory § When a process tries to use more memory than is available in RAM, things slow WAY down. § Memory is consumed to track movements of packets currently on the network. A packet which has not begin its trip or reaches its destination will not consume memory
Limit the Number of Packets § 2 GB can simulate more than Six Million packets at anyone time. § There are only around 30 million trips total § if each packet holds one trip, then six million packets should be enough for the simulation § The problems are because – too many fraction packets holding less than one trips – Unrealistic congestion due to network coding and iteration issues
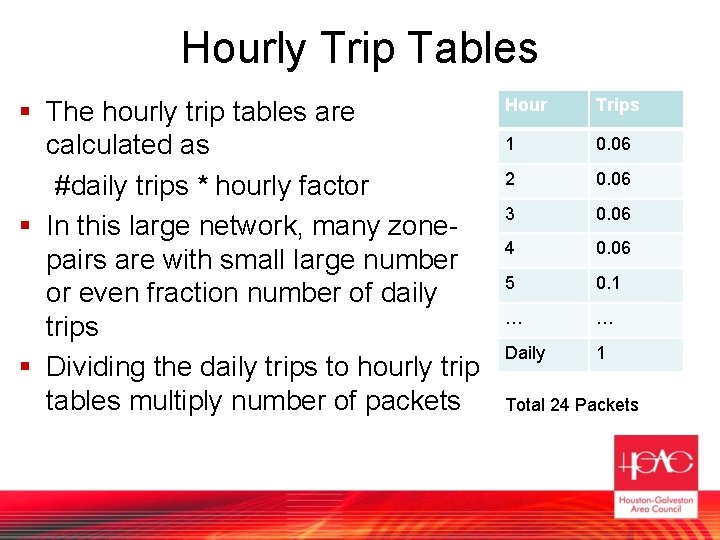
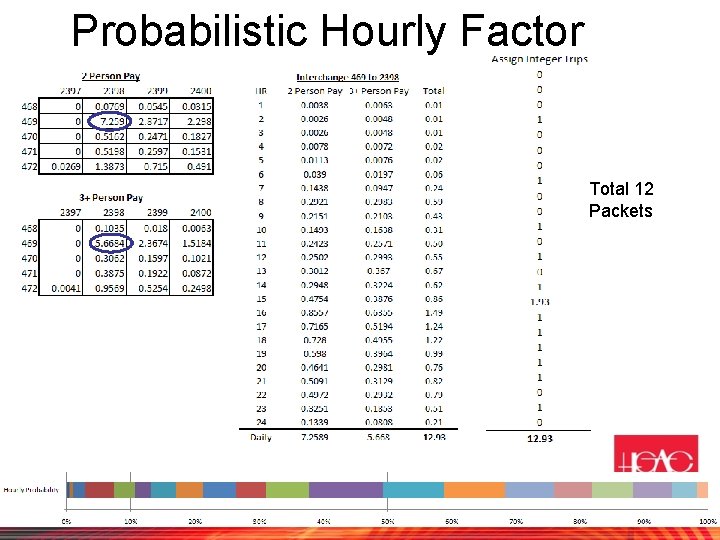
Hourly Trip Tables § The hourly trip tables are calculated as #daily trips * hourly factor § In this large network, many zonepairs are with small large number or even fraction number of daily trips § Dividing the daily trips to hourly trip tables multiply number of packets Hour Trips 1 0. 06 2 0. 06 3 0. 06 4 0. 06 5 0. 1 … … Daily 1 Total 24 Packets
Hourly Integerization § Back to example, if there is only one daily trip from zone A to zone B, it is necessary to generate a fractional trip/packets for every hour. § The hourly factor could be viewed as a hourly probability function of when the trip begins § Then randomly assign the integer trip based on the hourly probability function, hence reduces number of trips and packets
Probabilistic Hourly Factor Total 12 Packets
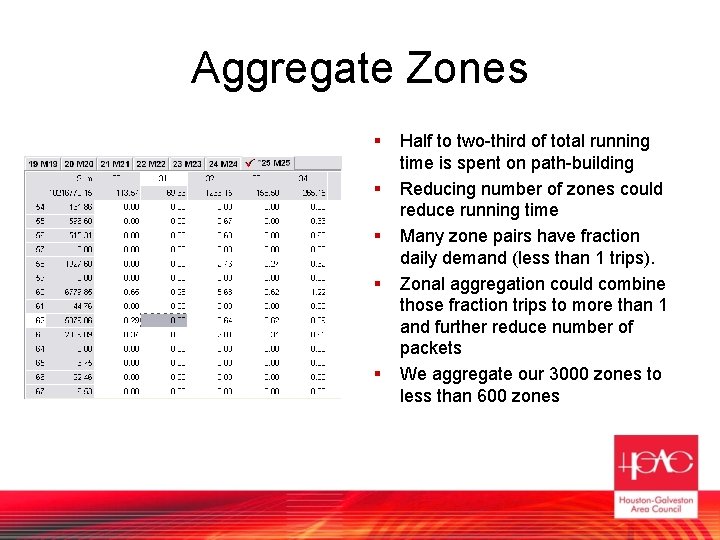
Aggregate Zones § § § Half to two-third of total running time is spent on path-building Reducing number of zones could reduce running time Many zone pairs have fraction daily demand (less than 1 trips). Zonal aggregation could combine those fraction trips to more than 1 and further reduce number of packets We aggregate our 3000 zones to less than 600 zones
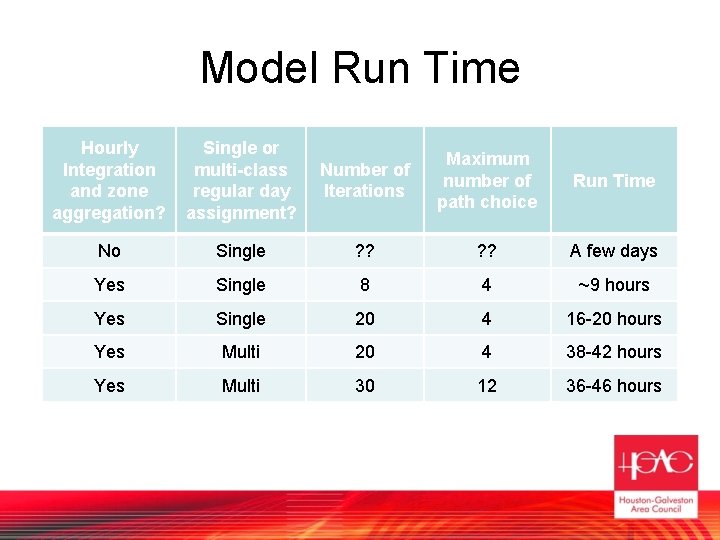
Number of Iterations and maximum path choices § In our model, evacuation begins in a regular day. Therefore the evacuation model assigns regular day traffic in early evacuation periods. § There are 8 iterations and maximum 4 route choices for a zone pair within the same hour. We pick small number of iterations and route choices to reduce run time. § It turns out that there are not enough iterations and route choices to let packets to learn all possible path § Therefore the traffic does not spread out enough, overloading certain routes.
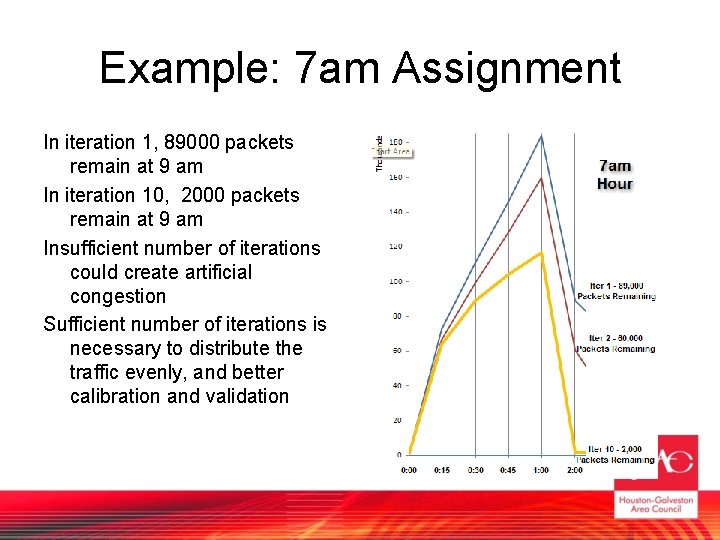
Example: 7 am Assignment In iteration 1, 89000 packets remain at 9 am In iteration 10, 2000 packets remain at 9 am Insufficient number of iterations could create artificial congestion Sufficient number of iterations is necessary to distribute the traffic evenly, and better calibration and validation
Number of Iterations and maximum path choices § The final model settle on 30 iterations and maximum 12 route choices for optimum run time and assignment results. § Surprising, increase path choice reduces run time as well.
Model Run Time Hourly Integration and zone aggregation? Single or multi-class regular day assignment? Number of Iterations Maximum number of path choice Run Time No Single ? ? A few days Yes Single 8 4 ~9 hours Yes Single 20 4 16 -20 hours Yes Multi 20 4 38 -42 hours Yes Multi 30 12 36 -46 hours
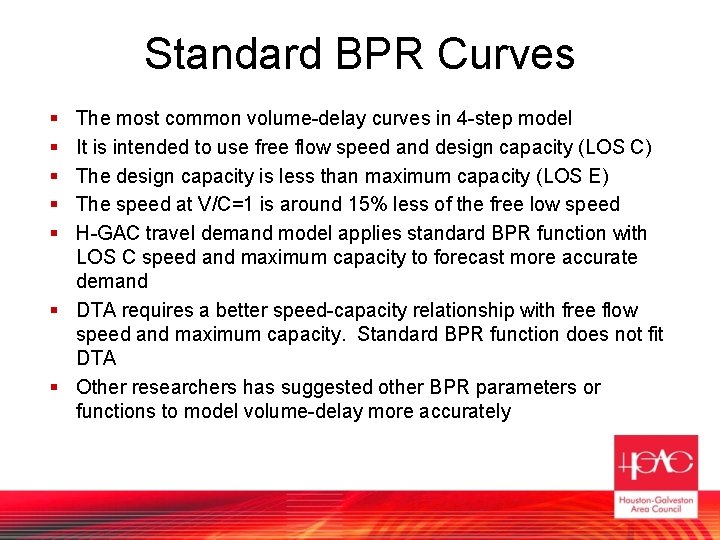
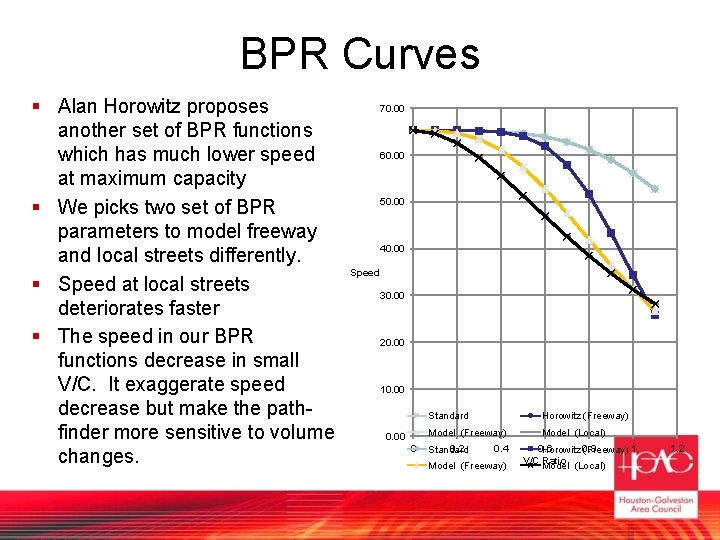
Standard BPR Curves § § § The most common volume-delay curves in 4 -step model It is intended to use free flow speed and design capacity (LOS C) The design capacity is less than maximum capacity (LOS E) The speed at V/C=1 is around 15% less of the free low speed H-GAC travel demand model applies standard BPR function with LOS C speed and maximum capacity to forecast more accurate demand § DTA requires a better speed-capacity relationship with free flow speed and maximum capacity. Standard BPR function does not fit DTA § Other researchers has suggested other BPR parameters or functions to model volume-delay more accurately
BPR Curves § Alan Horowitz proposes another set of BPR functions which has much lower speed at maximum capacity § We picks two set of BPR parameters to model freeway and local streets differently. § Speed at local streets deteriorates faster § The speed in our BPR functions decrease in small V/C. It exaggerate speed decrease but make the pathfinder more sensitive to volume changes. 70. 00 60. 00 50. 00 40. 00 Speed 30. 00 20. 00 10. 00 Standard Horowitz (Freeway) Model (Freeway) 0. 00 0 0. 2 Standard 0. 4 Model (Freeway) Model (Local) 0. 6 Horowitz 0. 8 (Freeway) 1 V/C Ratio Model (Local) 1. 2
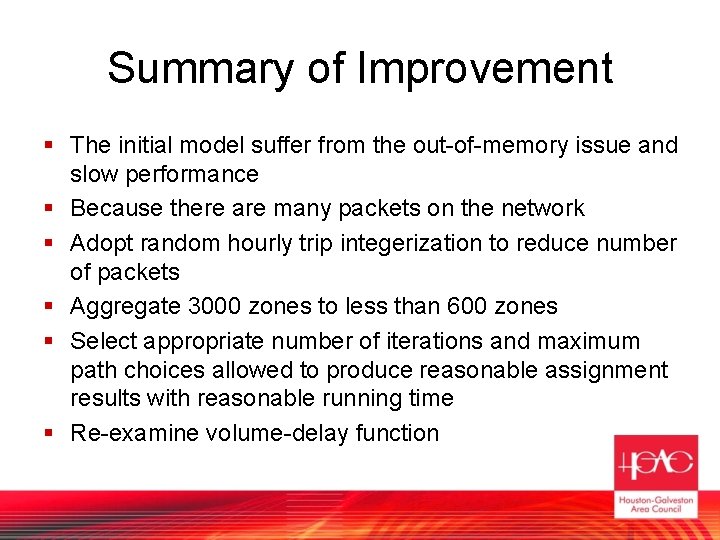
Summary of Improvement § The initial model suffer from the out-of-memory issue and slow performance § Because there are many packets on the network § Adopt random hourly trip integerization to reduce number of packets § Aggregate 3000 zones to less than 600 zones § Select appropriate number of iterations and maximum path choices allowed to produce reasonable assignment results with reasonable running time § Re-examine volume-delay function
Re-Generate Real World Scenarios
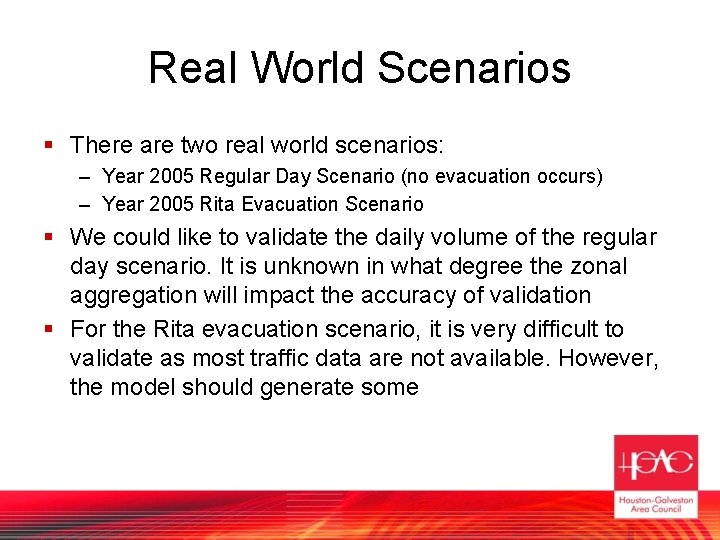
Real World Scenarios § There are two real world scenarios: – Year 2005 Regular Day Scenario (no evacuation occurs) – Year 2005 Rita Evacuation Scenario § We could like to validate the daily volume of the regular day scenario. It is unknown in what degree the zonal aggregation will impact the accuracy of validation § For the Rita evacuation scenario, it is very difficult to validate as most traffic data are not available. However, the model should generate some
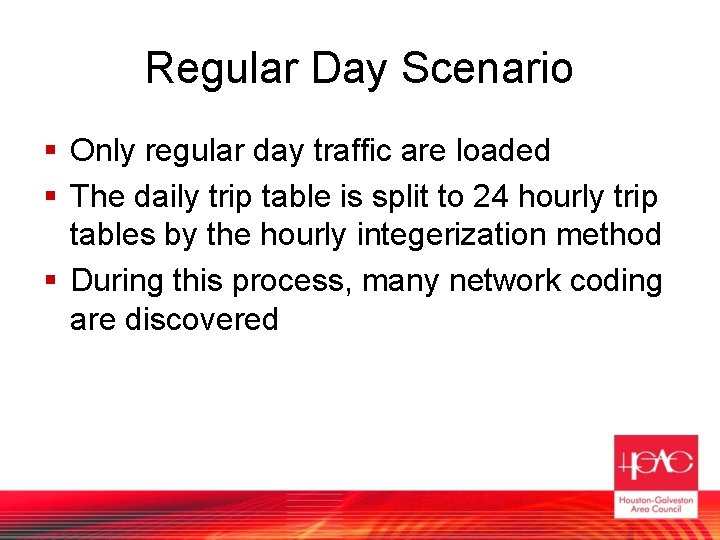
Regular Day Scenario § Only regular day traffic are loaded § The daily trip table is split to 24 hourly trip tables by the hourly integerization method § During this process, many network coding are discovered
Network Coding Issues § The model borrows the network from the regional travel demand model, which allows volume over capacity, and does not model queuing. § Regional travel demand model is a planning tool which set its first priority on demand; it allow links with volumecapacity ratio over 1 to indicate high demands. § Some links with V/C ratio over 1 could be caused by network coding issues. Those network coding issues are hidden in the regional network but are exposed in mesoscopic assignments § Turning lanes and auxiliary lanes are not coded in the network, but they are important to provide capacity to the capacity-sensitive mesoscopic assignment.
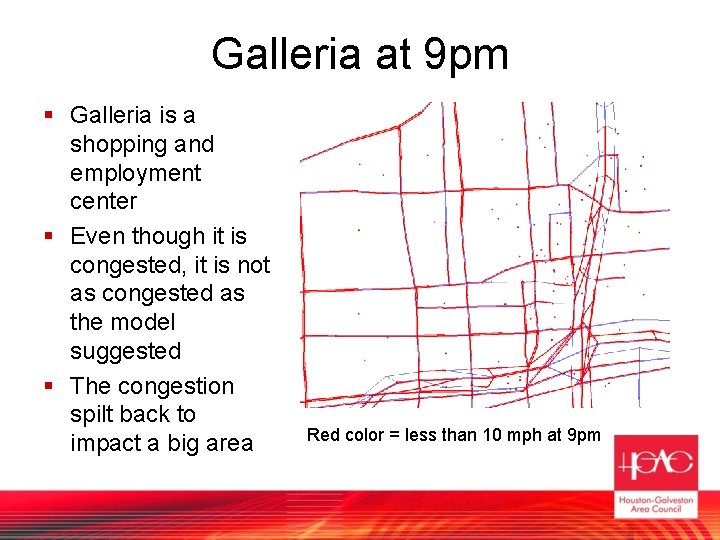
Galleria at 9 pm § Galleria is a shopping and employment center § Even though it is congested, it is not as congested as the model suggested § The congestion spilt back to impact a big area Red color = less than 10 mph at 9 pm
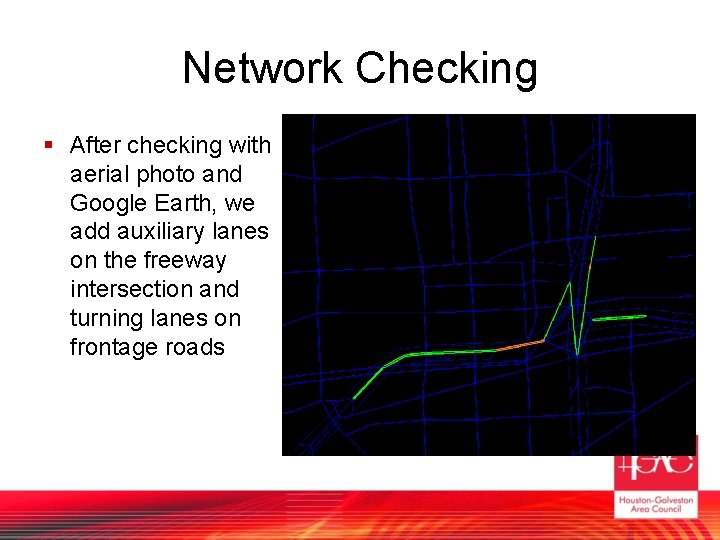
Network Checking § After checking with aerial photo and Google Earth, we add auxiliary lanes on the freeway intersection and turning lanes on frontage roads
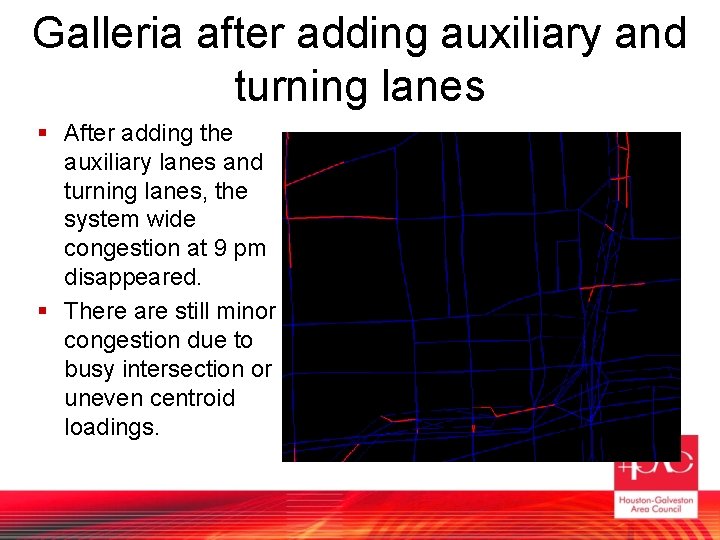
Galleria after adding auxiliary and turning lanes § After adding the auxiliary lanes and turning lanes, the system wide congestion at 9 pm disappeared. § There are still minor congestion due to busy intersection or uneven centroid loadings.
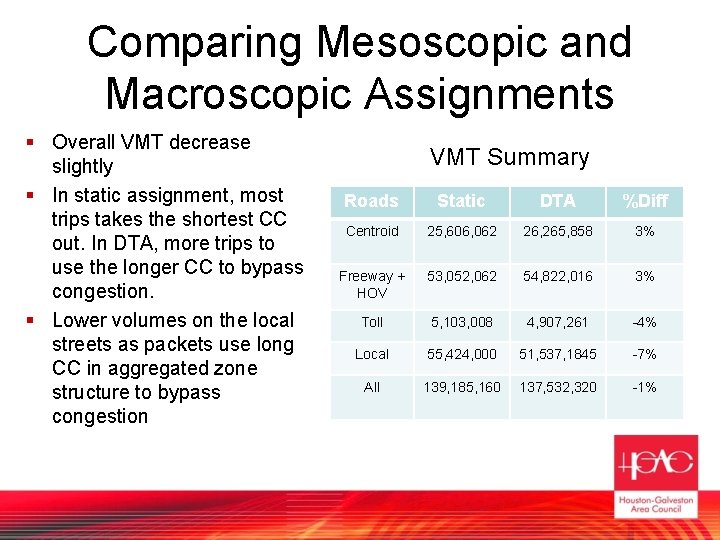
Comparing Mesoscopic and Macroscopic Assignments § Overall VMT decrease slightly § In static assignment, most trips takes the shortest CC out. In DTA, more trips to use the longer CC to bypass congestion. § Lower volumes on the local streets as packets use long CC in aggregated zone structure to bypass congestion VMT Summary Roads Static DTA %Diff Centroid 25, 606, 062 26, 265, 858 3% Freeway + HOV 53, 052, 062 54, 822, 016 3% Toll 5, 103, 008 4, 907, 261 -4% Local 55, 424, 000 51, 537, 1845 -7% All 139, 185, 160 137, 532, 320 -1%
Validate Regular Day Traffic § The goal is not to match traffic count very well, but to provide impact of regular day traffic during early evacuation period. § In process of screen line analysis. § The validation will not be very close to traffic count because of the aggregated zone. § Eventually we will validate the regular day traffic in our full-blown zone structure as in our regional travel demand model.
Rita events § It was 6 -days evacuation § We choose the 3 consecutive days out of the 6 days when 90% of evacuations and congestion occur § In first 1. 5 days, most evacuations originate from mandatory zones, and congestion is less severe and contained locally. People in non-mandatory zones are traveling in regular pattern. § In latter 1. 5 days, evacuations originate from every part of the region, and congestion is spread all over the region
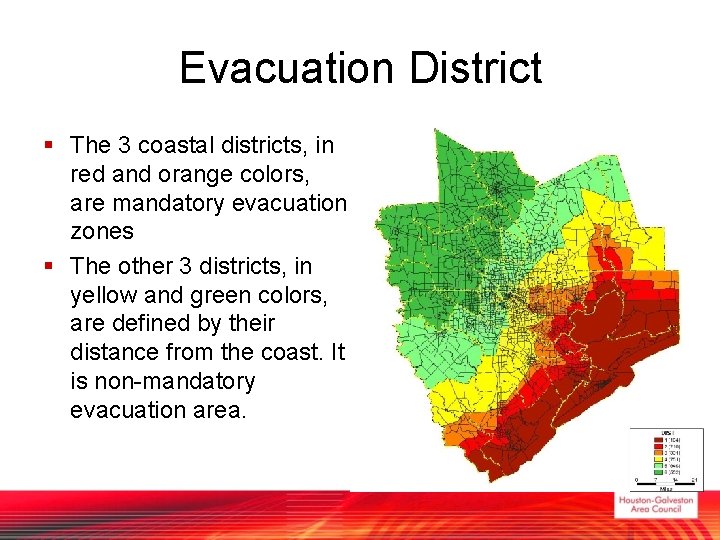
Evacuation District § The 3 coastal districts, in red and orange colors, are mandatory evacuation zones § The other 3 districts, in yellow and green colors, are defined by their distance from the coast. It is non-mandatory evacuation area.
Trip Purposes § There are three kind of trips in the Rita events § Evacuation traffic – Almost 90% leaves the region – Mostly follow evacuation route or freeway/Highway because they do not have knowledge of local routes of entire H-GAC region § Regular day traffic – Routine daily trip
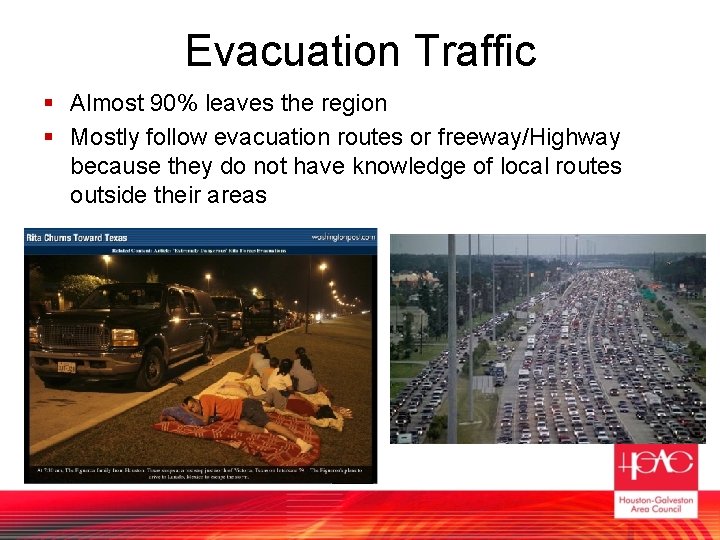
Evacuation Traffic § Almost 90% leaves the region § Mostly follow evacuation routes or freeway/Highway because they do not have knowledge of local routes outside their areas
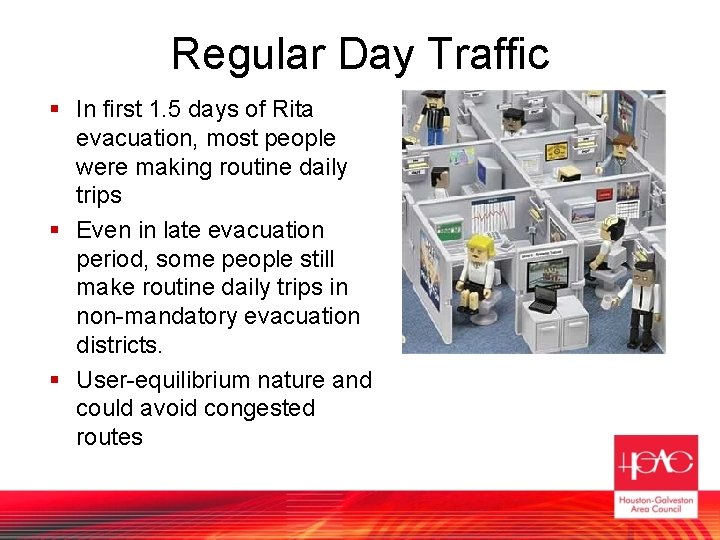
Regular Day Traffic § In first 1. 5 days of Rita evacuation, most people were making routine daily trips § Even in late evacuation period, some people still make routine daily trips in non-mandatory evacuation districts. § User-equilibrium nature and could avoid congested routes
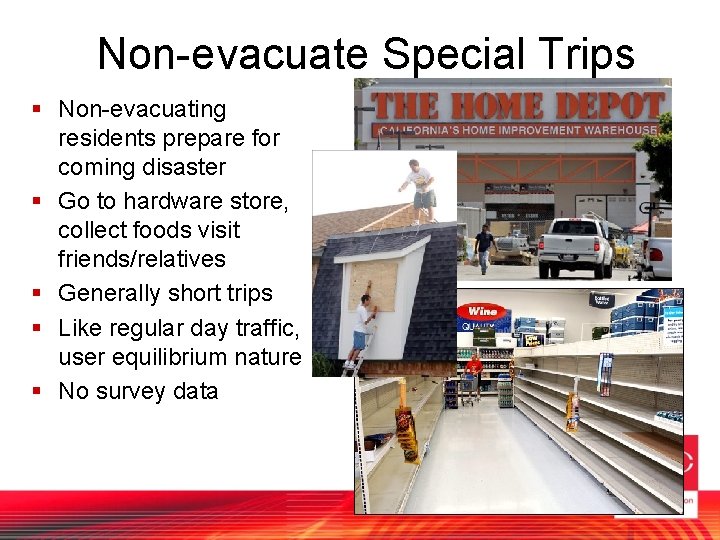
Non-evacuate Special Trips § Non-evacuating residents prepare for coming disaster § Go to hardware store, collect foods visit friends/relatives § Generally short trips § Like regular day traffic, user equilibrium nature § No survey data
Mixing those trip purposes § The evacuation model must assign all three trip purposes at the same time § Regular day traffic and non-evacuate special trips are combined to one class as both are user-equilibrium natures § For evacuation traffic, – Less number of iterations (less path choices) – Introduce local deter factor in the cost function to mimic their unfamiliarity to local arterials. In the cost function, this factor multiplies the travel time of local streets on non-evacuation routes.
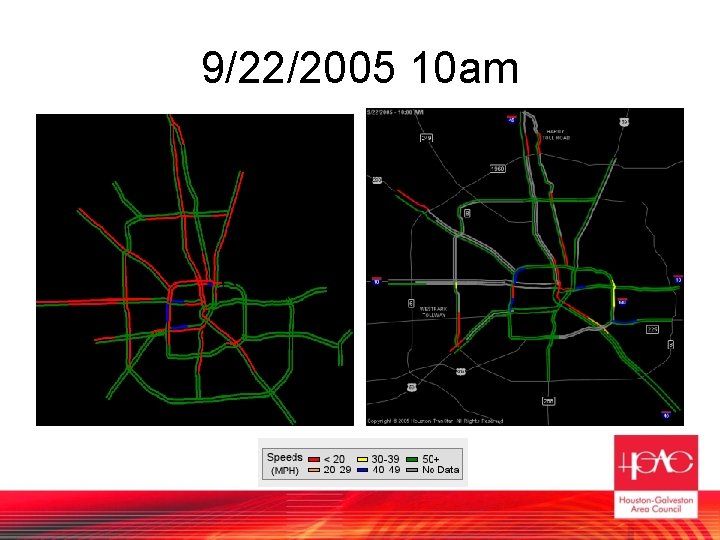
Validate Evacuation Model § Freeway speed data collect from Automatic Vehicle Identification technology § Traffic count at a few locations § The data does not cover entire region, and there are people question their accuracy under such slow-moving traffic
9/22/2005 10 am
Validation Progress § Current model shows significant congestion on outbound congestion § The modeled congestion is more severe than the collected data suggests on most northbound corridors § We are checking the demands and network issues.
Our goals after Validation…
Evaluating planning scenarios! § We could like to evaluate different evacuation strategies – – – Contraflow lanes Ramp closures Utilize additional evacuation routes Open toll lanes to public Signal § Run a future year scenario § With computer power improving, eventually run a model with full 3000 TAZ
Lessons Learned
Lesson 1: People § It takes time for modelers to realize that meso-scopic assignments is not macro-scopic or micro-scopic assignments § For travel demand modelers: – It is too sensitive to capacity! – Randomization is scary … § For micro-simulation engineers: – Capacity is artificial – Vehicles should be still moving in queue … § There are months of confusion and arguments before we accepted the strength and weakness of meso-scopic models.
Lesson 2: Data Preparation § The project could be more efficient if we prepare the data better § Check all networks are coded correctly, especially for congested area, bottlenecks, links with volume over capacity in the static model § Identify any areas which the demands is over the supply § Get some hourly traffic count or survey to create or update hourly split factor § Hourly count and speed data are good for validation
Lesson 3: Start with something small § If there is a mulligan, we could rather start from a sub-area. § For a big network, – Too many hidden network and demand issues – Difficult to diagnosis – Wait a long time to get results § Recommend approach: start with a small, congested area – Any network or demand issue in congested area are critical because the impact will spread out – Calibrate the model in this sub-area
Next Steps § Complete the validation! § Awaiting the next version of Cube Avenue, which Citilabs promise a more much efficient algorithm § Use details zone instead of aggregated zones.