Applying Data Analytics to Storage Systems and Data



- Slides: 44

Applying Data Analytics to Storage Systems and Data Access Olga Chuchuk Federico Gargiulo Andrea Sciabà EOS Workshop 1 -4 Match 2021 1

Introduction • LHC experiments rely on huge amounts on disk for data processing (reconstruction, analysis) and storage • CERN pledged about 100 PB of disk in 2020! • Such infrastructure is very expensive in terms of purchasing cost and operations • A flat budget is the best we can expect • Need to optimize both operations and disk utilization • The first step is to understand how we use it today, quantify how well it is used and what can be improved 2

Structure of the talk • Three different sets of analyses, at very different levels • Hard disk failures: how to predict when HDDs are going to fail and how to make hardware interventions more efficient and best preserve data integrity (Federico) • CERN EOS storage logs: understand how experiments use their disk storage, which can provide valuable insight on optimization of the EOS infrastructure (Olga) • Measuring data popularity and storage usage efficiency: using real data access patterns, understand what kind of data is most popular and how well storage is used, to see if it could be used even better (Andrea) 3

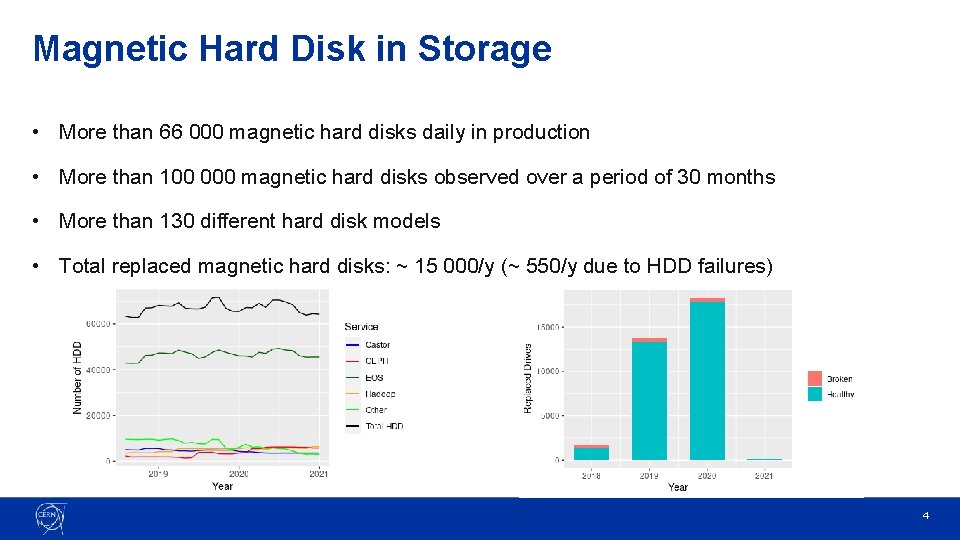
Magnetic Hard Disk in Storage • More than 66 000 magnetic hard disks daily in production • More than 100 000 magnetic hard disks observed over a period of 30 months • More than 130 different hard disk models • Total replaced magnetic hard disks: ~ 15 000/y (~ 550/y due to HDD failures) 4

Impact of Hard Disk Failures • Magnetic disks units are among the most frequently failing components of storage systems and disk failures resulting in about 78% of cloud server system failures. • Those failures often require rapid human intervention or at least a costly consistency check by service operators. In the worst case, disk failures can lead to permanent data loss. • While the fault tolerance techniques often diminish the risk of permanent data loss, they usually also reduce the usable system performance due to their additional internal recovery operations. A forecast of hard disk failures would reduce the risks of unscheduled maintenance and data loss [1] R. Nachiappan, B. Javadi, R. N. Calheiros, and K. M. Matawie, “Cloud storage reliability for big data applications: A state of the art survey”, Journal of Network and Computer Applications, vol. 97, pp. 35– 47, 2017. 5

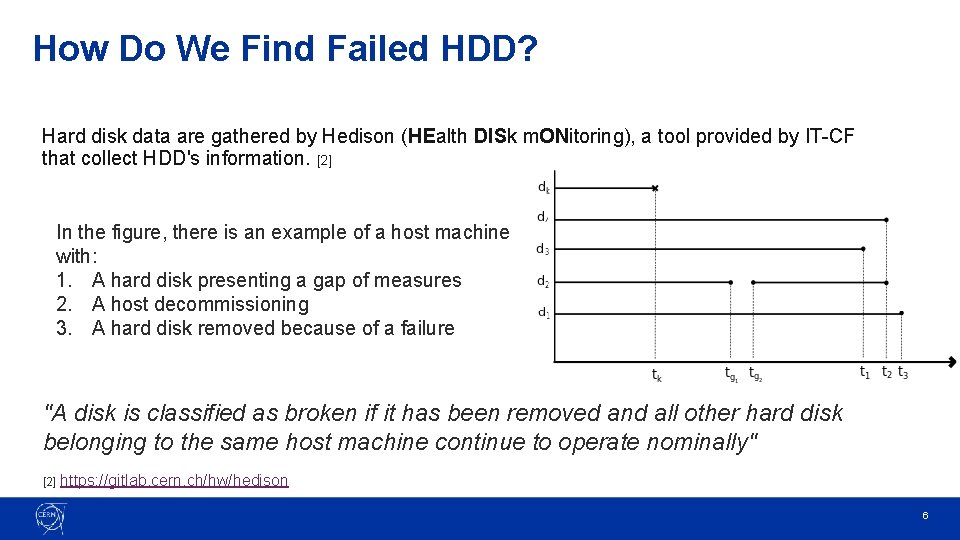
How Do We Find Failed HDD? Hard disk data are gathered by Hedison (HEalth DISk m. ONitoring), a tool provided by IT-CF that collect HDD's information. [2] In the figure, there is an example of a host machine with: 1. A hard disk presenting a gap of measures 2. A host decommissioning 3. A hard disk removed because of a failure "A disk is classified as broken if it has been removed and all other hard disk belonging to the same host machine continue to operate nominally" [2] https: //gitlab. cern. ch/hw/hedison 6

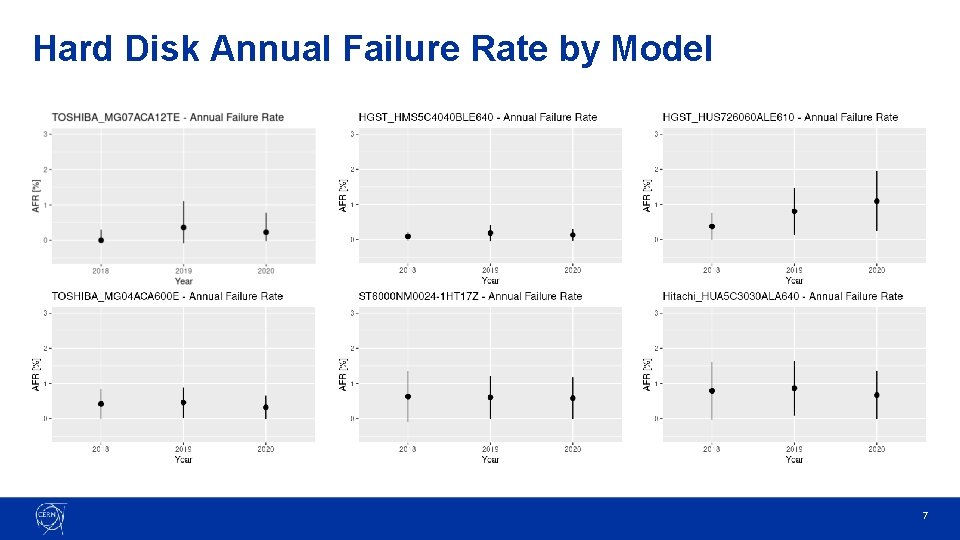
Hard Disk Annual Failure Rate by Model 7

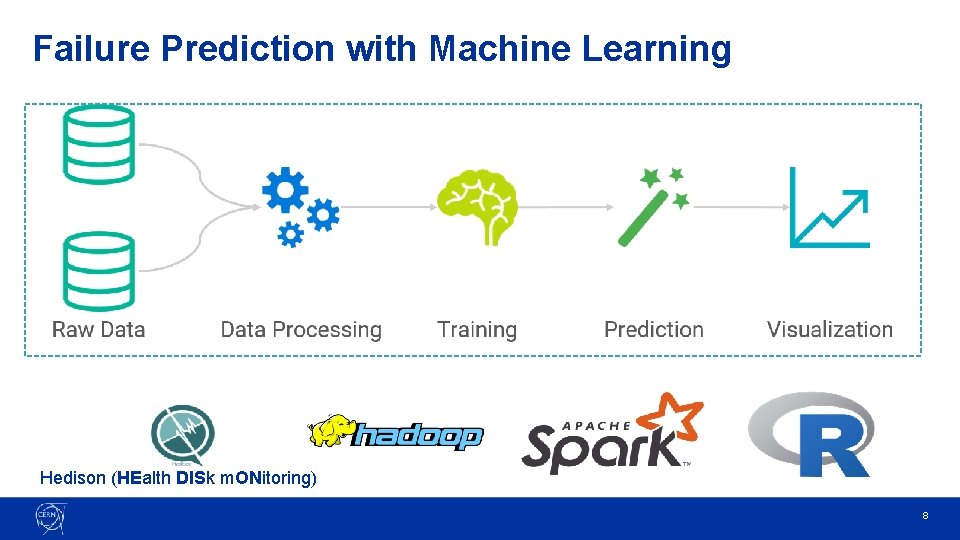
Failure Prediction with Machine Learning Hedison (HEalth DISk m. ONitoring) 8

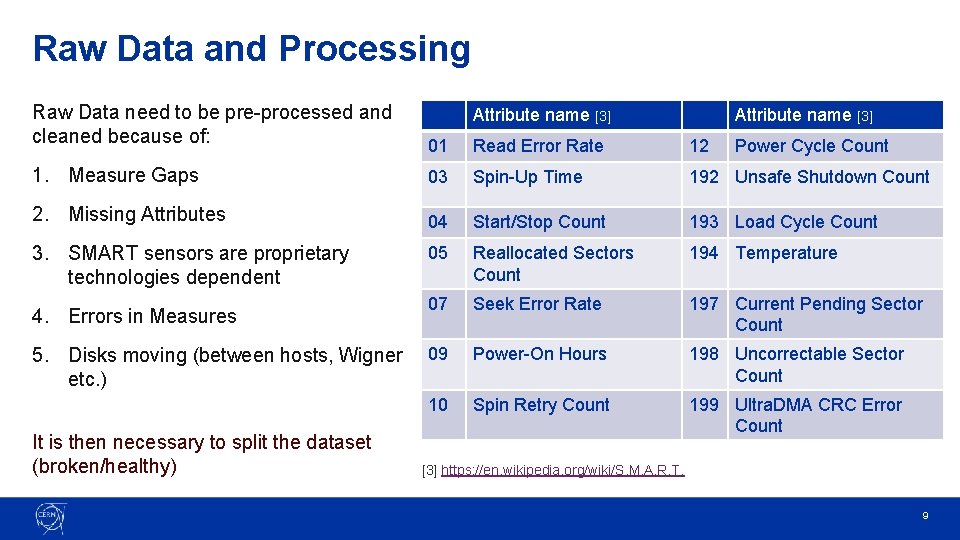
Raw Data and Processing Raw Data need to be pre-processed and cleaned because of: 01 Read Error Rate 12 1. Measure Gaps 03 Spin-Up Time 192 Unsafe Shutdown Count 2. Missing Attributes 04 Start/Stop Count 193 Load Cycle Count 05 Reallocated Sectors Count 194 Temperature 07 Seek Error Rate 197 Current Pending Sector Count 09 Power-On Hours 198 Uncorrectable Sector Count 10 Spin Retry Count 199 Ultra. DMA CRC Error Count 3. SMART sensors are proprietary technologies dependent 4. Errors in Measures 5. Disks moving (between hosts, Wigner etc. ) It is then necessary to split the dataset (broken/healthy) Attribute name [3] Power Cycle Count [3] https: //en. wikipedia. org/wiki/S. M. A. R. T. 9

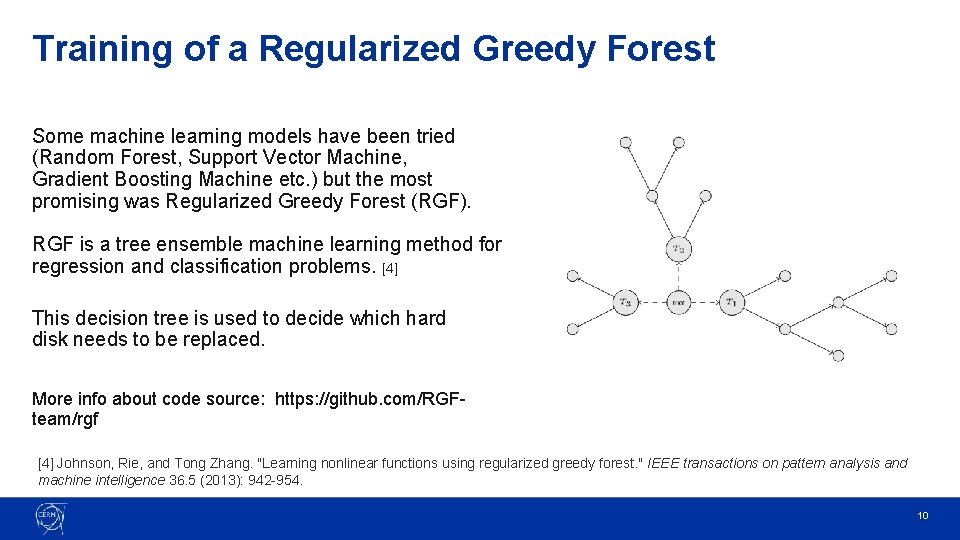
Training of a Regularized Greedy Forest Some machine learning models have been tried (Random Forest, Support Vector Machine, Gradient Boosting Machine etc. ) but the most promising was Regularized Greedy Forest (RGF). RGF is a tree ensemble machine learning method for regression and classification problems. [4] This decision tree is used to decide which hard disk needs to be replaced. More info about code source: https: //github. com/RGFteam/rgf [4] Johnson, Rie, and Tong Zhang. "Learning nonlinear functions using regularized greedy forest. " IEEE transactions on pattern analysis and machine intelligence 36. 5 (2013): 942 -954. 10

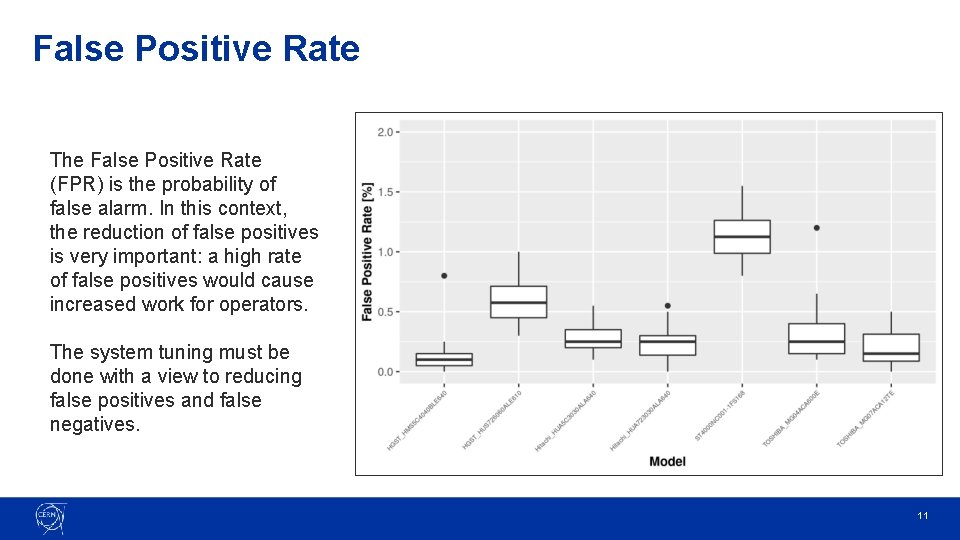
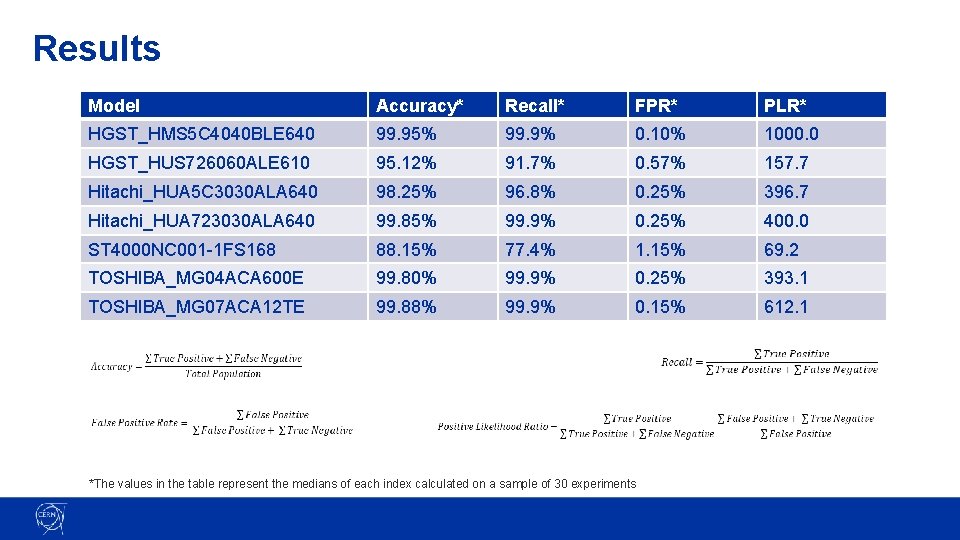
False Positive Rate The False Positive Rate (FPR) is the probability of false alarm. In this context, the reduction of false positives is very important: a high rate of false positives would cause increased work for operators. The system tuning must be done with a view to reducing false positives and false negatives. 11

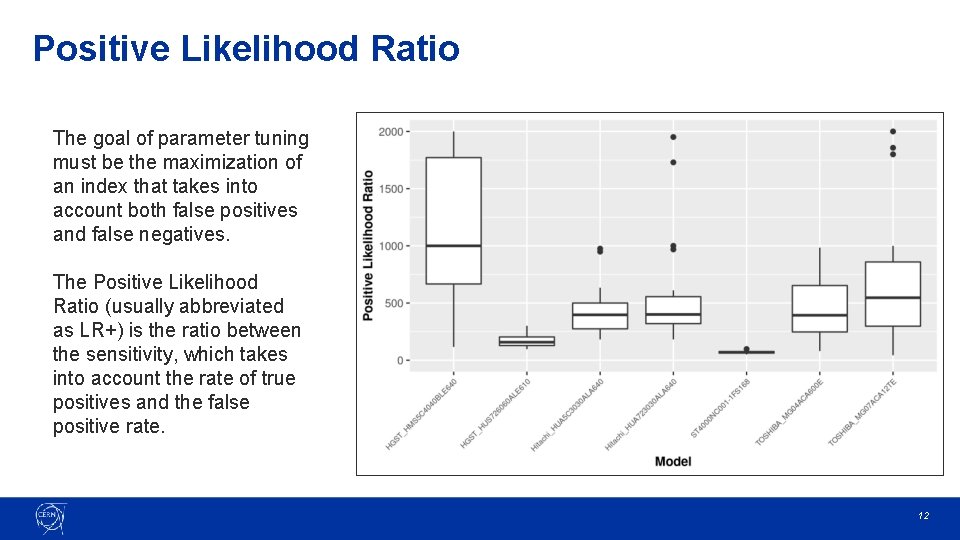
Positive Likelihood Ratio The goal of parameter tuning must be the maximization of an index that takes into account both false positives and false negatives. The Positive Likelihood Ratio (usually abbreviated as LR+) is the ratio between the sensitivity, which takes into account the rate of true positives and the false positive rate. 12

Results Model Accuracy* Recall* FPR* PLR* HGST_HMS 5 C 4040 BLE 640 99. 95% 99. 9% 0. 10% 1000. 0 HGST_HUS 726060 ALE 610 95. 12% 91. 7% 0. 57% 157. 7 Hitachi_HUA 5 C 3030 ALA 640 98. 25% 96. 8% 0. 25% 396. 7 Hitachi_HUA 723030 ALA 640 99. 85% 99. 9% 0. 25% 400. 0 ST 4000 NC 001 -1 FS 168 88. 15% 77. 4% 1. 15% 69. 2 TOSHIBA_MG 04 ACA 600 E 99. 80% 99. 9% 0. 25% 393. 1 TOSHIBA_MG 07 ACA 12 TE 99. 88% 99. 9% 0. 15% 612. 1 *The values in the table represent the medians of each index calculated on a sample of 30 experiments 13

Conclusions • Different levels of performance for different hard disk models. • Performance is highly linked to the volume of data with which the models are trained. The system is designed to collect new data from hard disks and improve new training on a daily basis. • The prototyping phase has currently achieved satisfactory results for some models and soon the putting in production of the system will be discussed. 14

CERN Storage System analysis using EOS Report Logs 15

Motivation • EOS Report Logs: detailed data about EOS system and user file accesses: creations, accesses, deletions etc. • Our goals: • Understand the differences between EOS instances (experiments) • Understand the popularity and the lifecycle of the data • Evaluate a potential usefulness of a caching layer • Find unexpected uses 16

Data source / Analysis Workflow Raw data (~100 MB - 8 GB per day) • EOS report logs (. eosreport. gz, compressed format) • Metrics: fid, access time, file size, read/written bytes etc. • A separate instance for each experiment Processed data (~600 MB - 7 GB per month) • Parsing, filtering, grouping • Save back to EOS as. parquet files • Take samples and save as. csv files Statistics & Plots 17

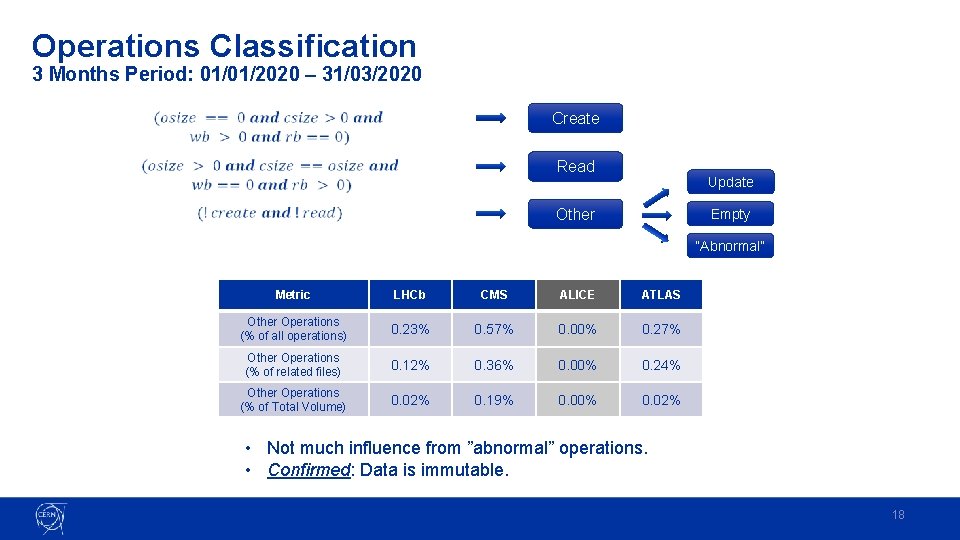
Operations Classification 3 Months Period: 01/01/2020 – 31/03/2020 Create Read Update Other Empty “Abnormal” Metric LHCb CMS ALICE ATLAS Other Operations (% of all operations) 0. 23% 0. 57% 0. 00% 0. 27% Other Operations (% of related files) 0. 12% 0. 36% 0. 00% 0. 24% Other Operations (% of Total Volume) 0. 02% 0. 19% 0. 00% 0. 02% • Not much influence from ”abnormal” operations. • Confirmed: Data is immutable. 18

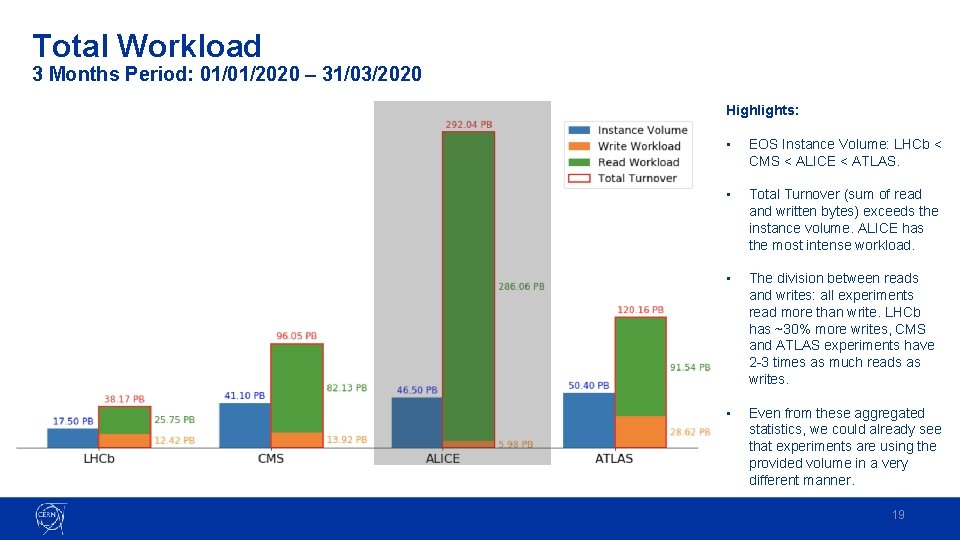
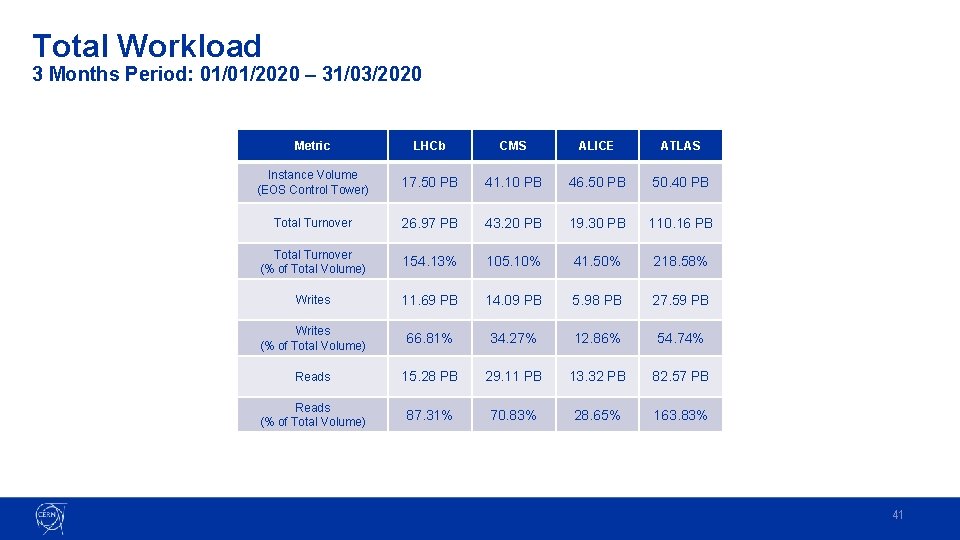
Total Workload 3 Months Period: 01/01/2020 – 31/03/2020 Highlights: • EOS Instance Volume: LHCb < CMS < ALICE < ATLAS. • Total Turnover (sum of read and written bytes) exceeds the instance volume. ALICE has the most intense workload. • The division between reads and writes: all experiments read more than write. LHCb has ~30% more writes, CMS and ATLAS experiments have 2 -3 times as much reads as writes. • Even from these aggregated statistics, we could already see that experiments are using the provided volume in a very different manner. 19

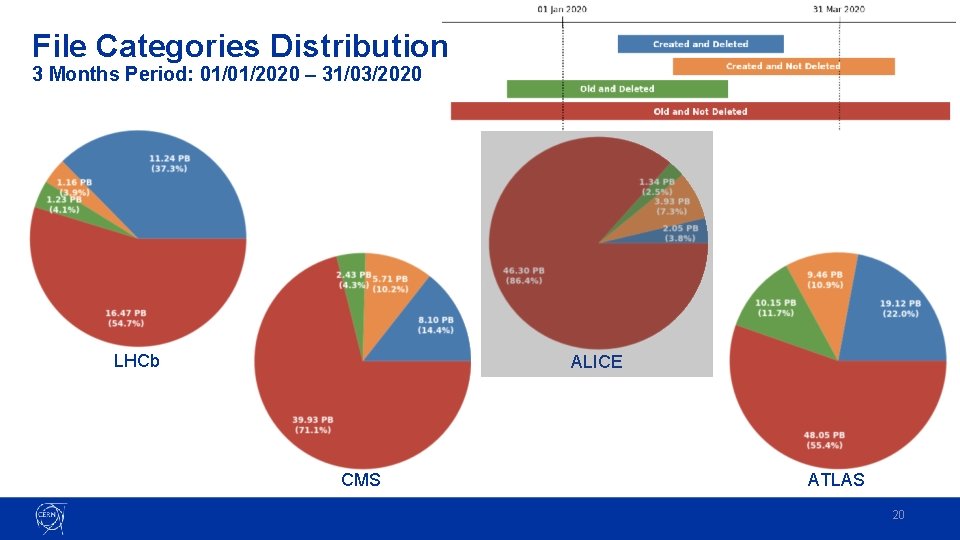
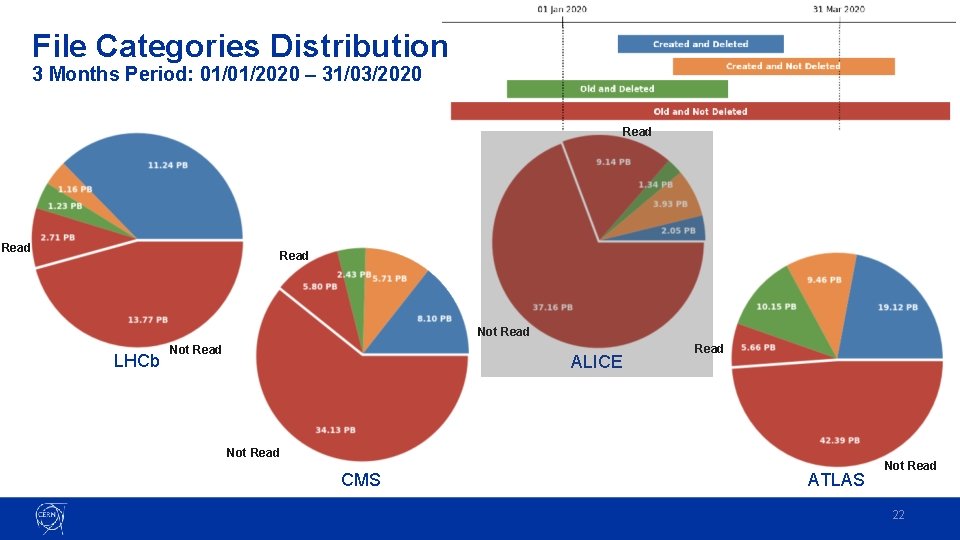
File Categories Distribution 3 Months Period: 01/01/2020 – 31/03/2020 LHCb ALICE CMS ATLAS 20

File Categories Distribution 3 Months Period: 01/01/2020 – 31/03/2020 Not Read Read LHCb ALICE CMS ATLAS 21

File Categories Distribution 3 Months Period: 01/01/2020 – 31/03/2020 Read Not Read LHCb Not Read ALICE Read Not Read CMS ATLAS Not Read 22

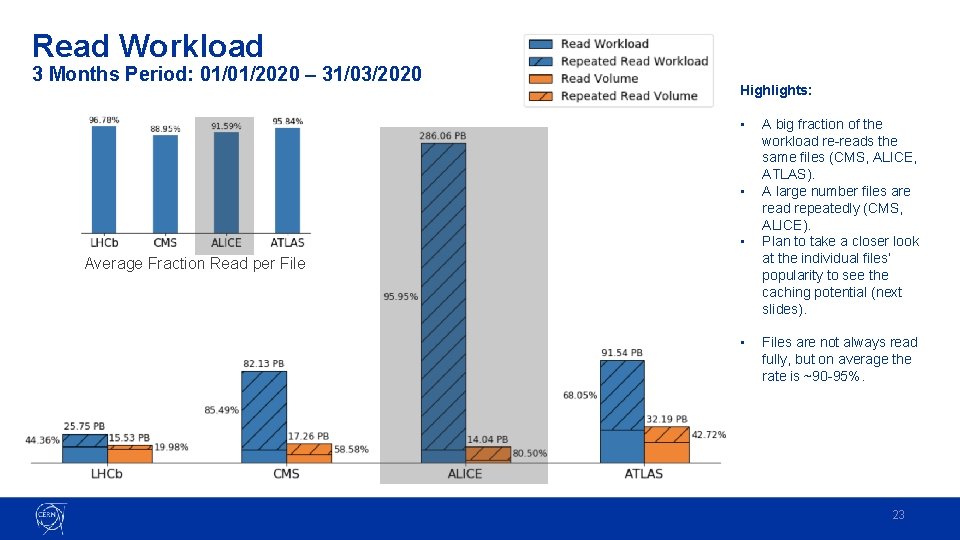
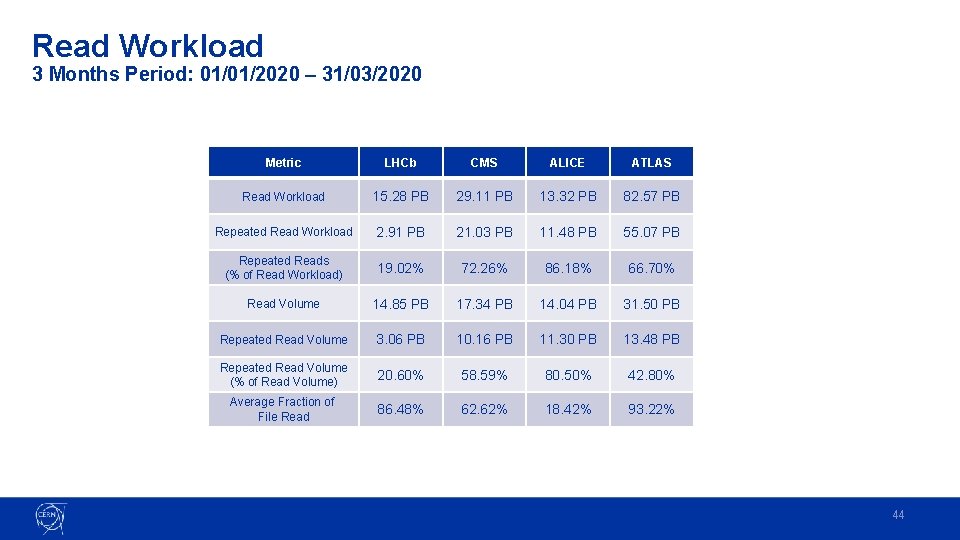
Read Workload 3 Months Period: 01/01/2020 – 31/03/2020 Highlights: • • • Average Fraction Read per File • A big fraction of the workload re-reads the same files (CMS, ALICE, ATLAS). A large number files are read repeatedly (CMS, ALICE). Plan to take a closer look at the individual files’ popularity to see the caching potential (next slides). Files are not always read fully, but on average the rate is ~90 -95%. 23

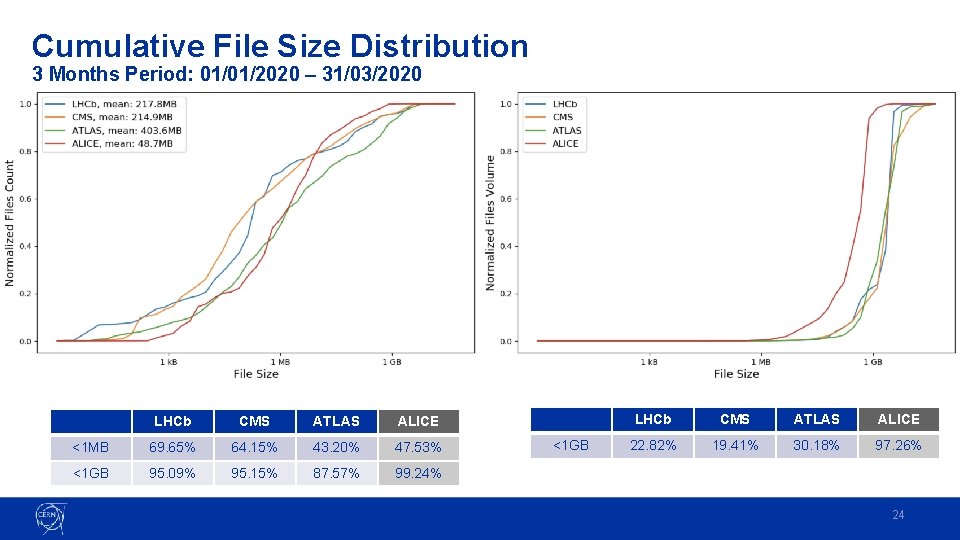
Cumulative File Size Distribution 3 Months Period: 01/01/2020 – 31/03/2020 LHCb CMS ATLAS ALICE <1 MB 69. 65% 64. 15% 43. 20% 47. 53% <1 GB 95. 09% 95. 15% 87. 57% 99. 24% <1 GB LHCb CMS ATLAS ALICE 22. 82% 19. 41% 30. 18% 97. 26% 24

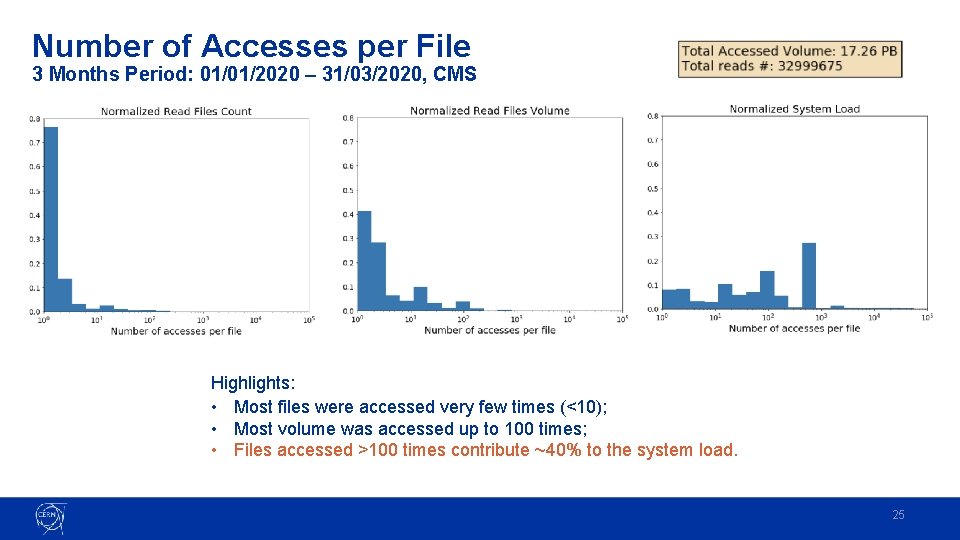
Number of Accesses per File 3 Months Period: 01/01/2020 – 31/03/2020, CMS Highlights: • Most files were accessed very few times (<10); • Most volume was accessed up to 100 times; • Files accessed >100 times contribute ~40% to the system load. 25

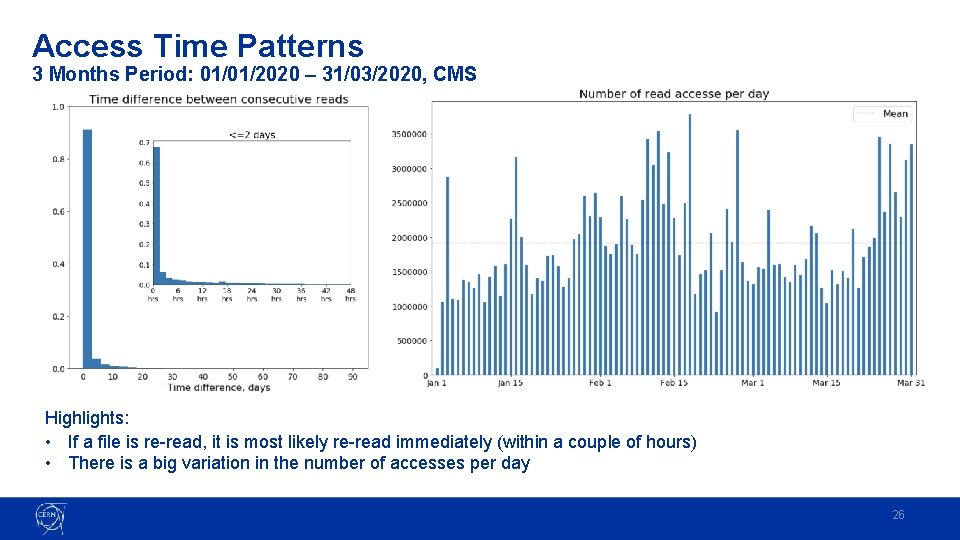
Access Time Patterns 3 Months Period: 01/01/2020 – 31/03/2020, CMS Highlights: • If a file is re-read, it is most likely re-read immediately (within a couple of hours) • There is a big variation in the number of accesses per day 26

Conclusions • The collection of the log data is critical for our analysis. We greatly suffer from data quality violations. • We observed a rich set of behaviours (varies from experiment to experiment, the choice of the time period might change the results completely) • The period of consideration is relatively short. We should not extrapolate these results to bigger time periods • Our plans • Extend the period (including data taking) • Expand to other tiers (to cover all the workloads) • Further explore caching potential 27

Effect of storage caches and data popularity 28

Motivation • At HL-LHC both storage and network will be (very) limited resources • Need to define more efficient strategies for data management • Reducing data replication and wide area network traffic at the same time may not be possible • Storage caches are a simple and effective way to optimize • Copy only what jobs really need for the time they need it • Centralize custodial replicas of data in a few, large regional centers (often federations of sites) • Still, experiment data management is still extremely relevant • Impossible to make extensive infrastructure changes by Run 3 • A lot can be achieved by better data placement strategies in Rucio and equivalent systems 29

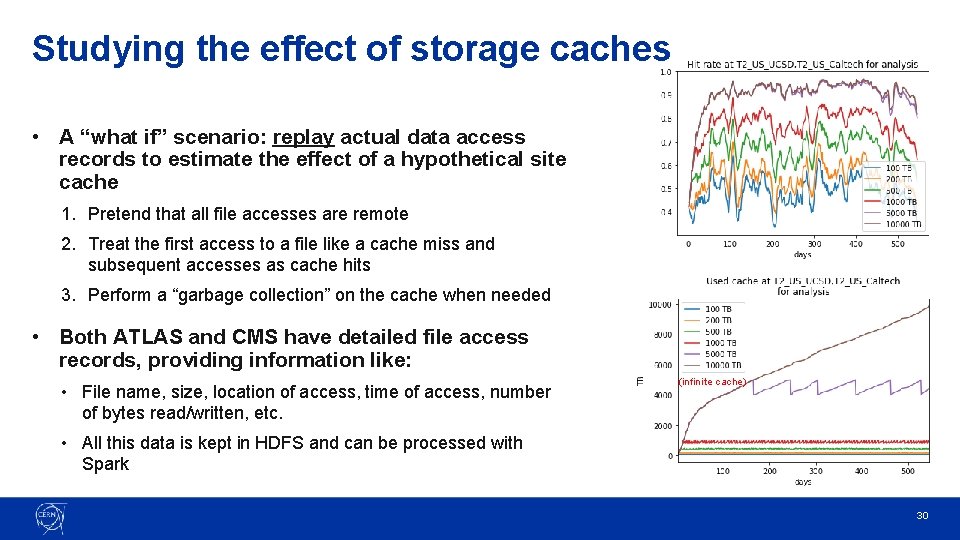
Studying the effect of storage caches • A “what if” scenario: replay actual data access records to estimate the effect of a hypothetical site cache 1. Pretend that all file accesses are remote 2. Treat the first access to a file like a cache miss and subsequent accesses as cache hits 3. Perform a “garbage collection” on the cache when needed • Both ATLAS and CMS have detailed file access records, providing information like: • File name, size, location of access, time of access, number of bytes read/written, etc. (infinite cache) • All this data is kept in HDFS and can be processed with Spark 30

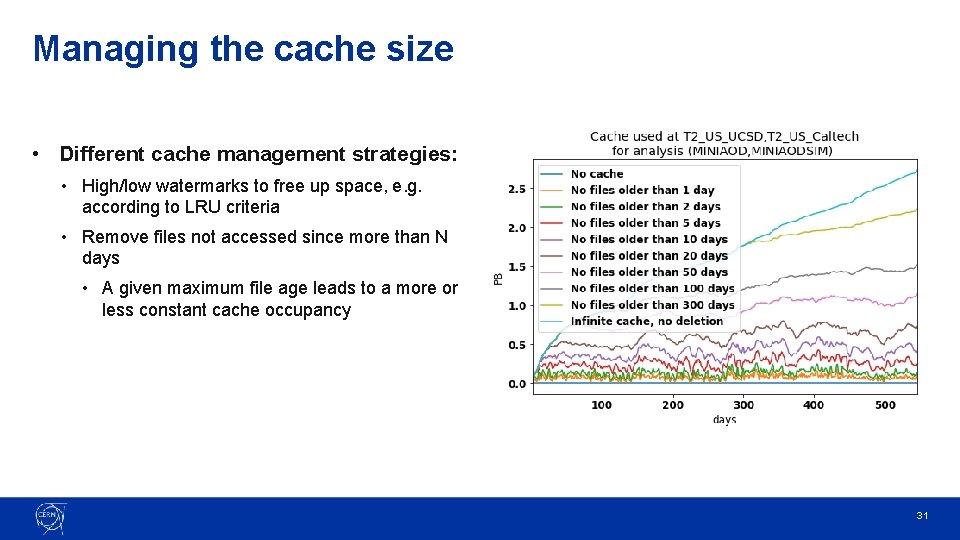
Managing the cache size • Different cache management strategies: • High/low watermarks to free up space, e. g. according to LRU criteria • Remove files not accessed since more than N days • A given maximum file age leads to a more or less constant cache occupancy 31

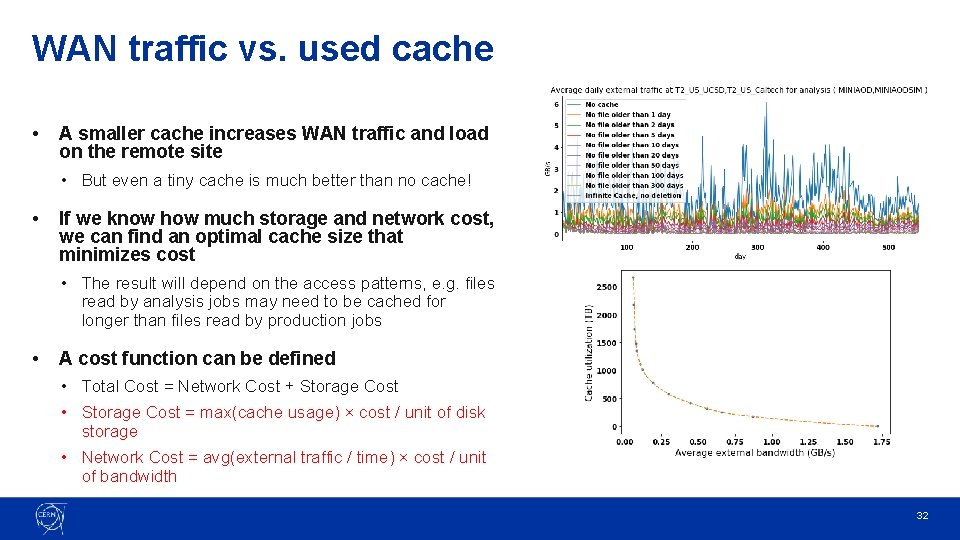
WAN traffic vs. used cache • A smaller cache increases WAN traffic and load on the remote site • But even a tiny cache is much better than no cache! • If we know how much storage and network cost, we can find an optimal cache size that minimizes cost • The result will depend on the access patterns, e. g. files read by analysis jobs may need to be cached for longer than files read by production jobs • A cost function can be defined • Total Cost = Network Cost + Storage Cost • Storage Cost = max(cache usage) × cost / unit of disk storage • Network Cost = avg(external traffic / time) × cost / unit of bandwidth 32

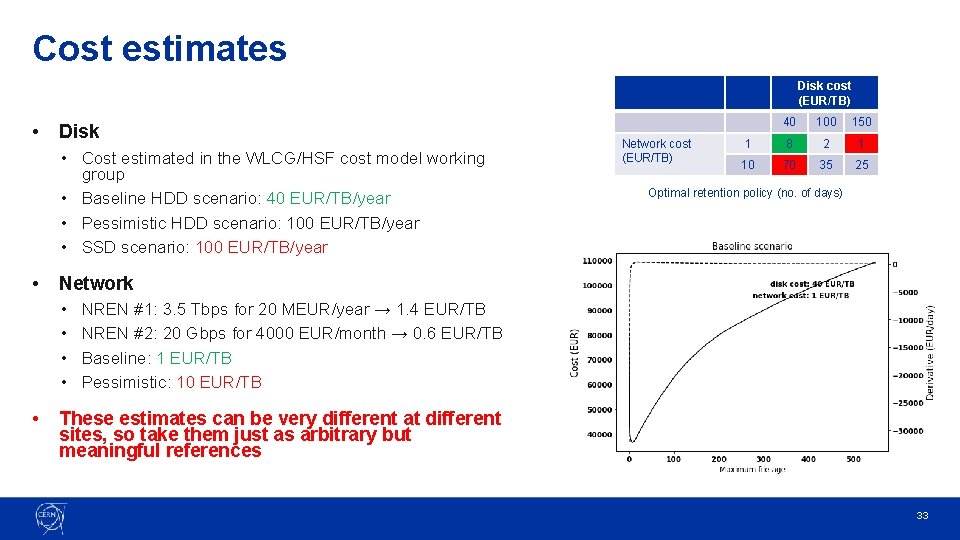
Cost estimates Disk cost (EUR/TB) • Disk • Cost estimated in the WLCG/HSF cost model working group • Baseline HDD scenario: 40 EUR/TB/year • Pessimistic HDD scenario: 100 EUR/TB/year • SSD scenario: 100 EUR/TB/year • 100 150 1 8 2 1 10 70 35 25 Optimal retention policy (no. of days) Network • • • Network cost (EUR/TB) 40 NREN #1: 3. 5 Tbps for 20 MEUR/year → 1. 4 EUR/TB NREN #2: 20 Gbps for 4000 EUR/month → 0. 6 EUR/TB Baseline: 1 EUR/TB Pessimistic: 10 EUR/TB These estimates can be very different at different sites, so take them just as arbitrary but meaningful references 33

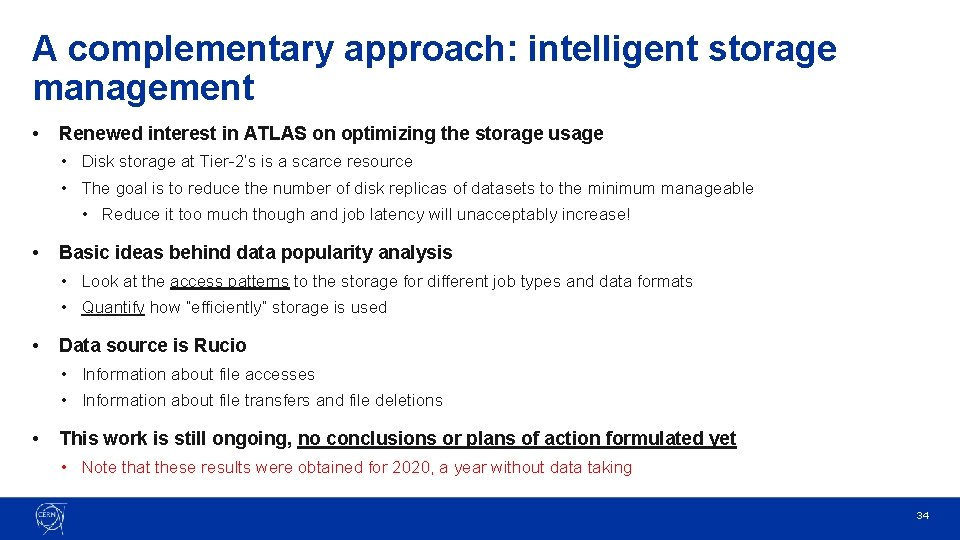
A complementary approach: intelligent storage management • Renewed interest in ATLAS on optimizing the storage usage • Disk storage at Tier-2’s is a scarce resource • The goal is to reduce the number of disk replicas of datasets to the minimum manageable • Reduce it too much though and job latency will unacceptably increase! • Basic ideas behind data popularity analysis • Look at the access patterns to the storage for different job types and data formats • Quantify how “efficiently” storage is used • Data source is Rucio • Information about file accesses • Information about file transfers and file deletions • This work is still ongoing, no conclusions or plans of action formulated yet • Note that these results were obtained for 2020, a year without data taking 34

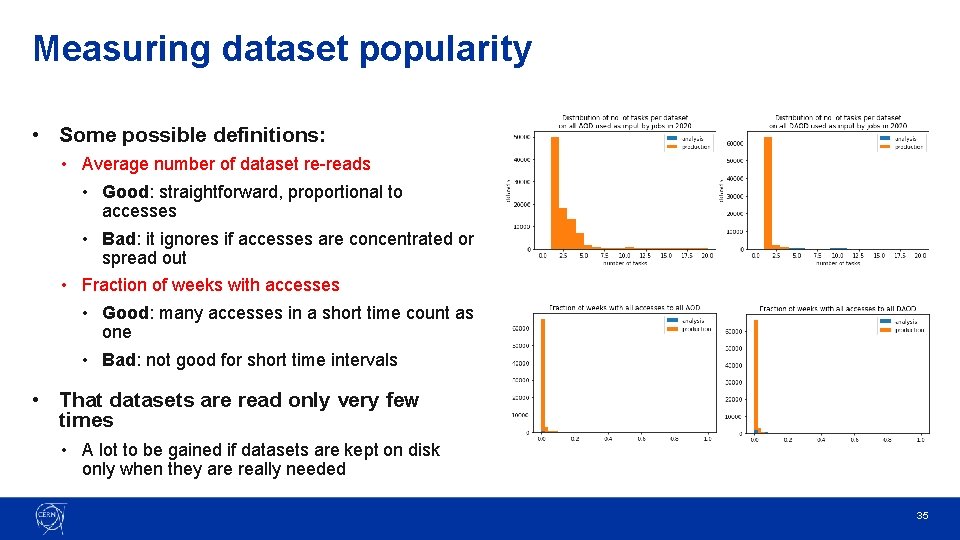
Measuring dataset popularity • Some possible definitions: • Average number of dataset re-reads • Good: straightforward, proportional to accesses • Bad: it ignores if accesses are concentrated or spread out • Fraction of weeks with accesses • Good: many accesses in a short time count as one • Bad: not good for short time intervals • That datasets are read only very few times • A lot to be gained if datasets are kept on disk only when they are really needed 35

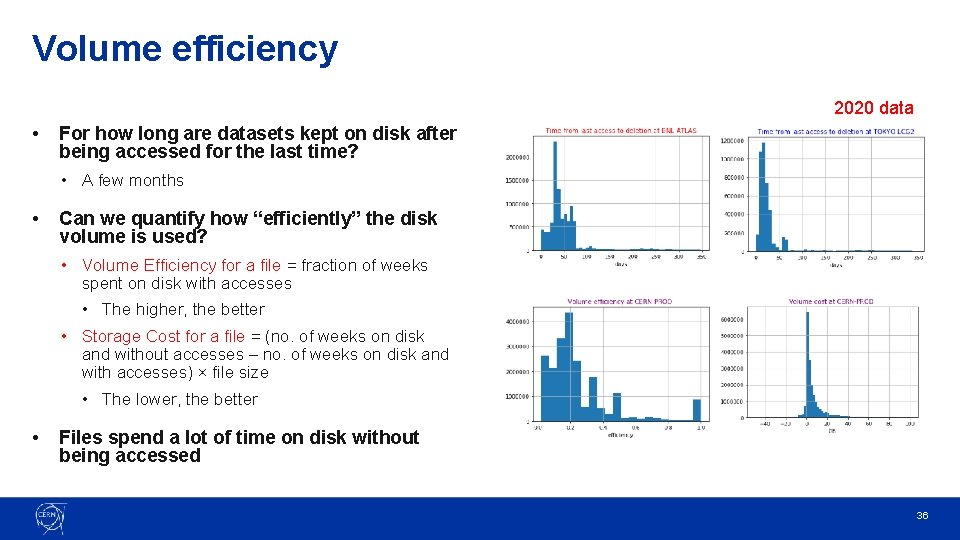
Volume efficiency 2020 data • For how long are datasets kept on disk after being accessed for the last time? • A few months • Can we quantify how “efficiently” the disk volume is used? • Volume Efficiency for a file = fraction of weeks spent on disk with accesses • The higher, the better • Storage Cost for a file = (no. of weeks on disk and without accesses – no. of weeks on disk and with accesses) × file size • The lower, the better • Files spend a lot of time on disk without being accessed 36

Data popularity: conclusions • A lot can be learned by looking at file access, file transfer and file deletion records • This kind of studies provides quantitative support to important strategic changes in data management for Run 3 and beyond, needed to sustain much higher data volumes • Site storage caches and data lakes • Reducing disk replicas of data to the bare minimum • This kind of analysis should be done continuously, to observe any changes in access patterns and ideally at all sites 37

Conclusions • We have shown how much can be learned from monitoring logs, storage logs and data access records to better understand the behavior and the usage of storage resources at CERN and elsewhere • EOS and Rucio are the primary data sources • Most of this work is still in progress and its full potential has not yet been exploited 38

Questions? 39

Backup Slides 40

Total Workload 3 Months Period: 01/01/2020 – 31/03/2020 Metric LHCb CMS ALICE ATLAS Instance Volume (EOS Control Tower) 17. 50 PB 41. 10 PB 46. 50 PB 50. 40 PB Total Turnover 26. 97 PB 43. 20 PB 19. 30 PB 110. 16 PB Total Turnover (% of Total Volume) 154. 13% 105. 10% 41. 50% 218. 58% Writes 11. 69 PB 14. 09 PB 5. 98 PB 27. 59 PB Writes (% of Total Volume) 66. 81% 34. 27% 12. 86% 54. 74% Reads 15. 28 PB 29. 11 PB 13. 32 PB 82. 57 PB Reads (% of Total Volume) 87. 31% 70. 83% 28. 65% 163. 83% 41

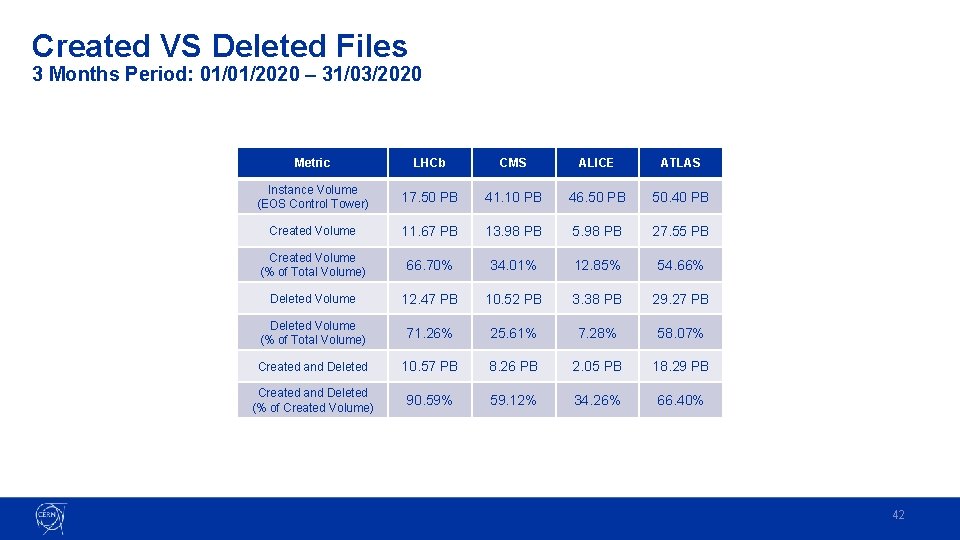
Created VS Deleted Files 3 Months Period: 01/01/2020 – 31/03/2020 Metric LHCb CMS ALICE ATLAS Instance Volume (EOS Control Tower) 17. 50 PB 41. 10 PB 46. 50 PB 50. 40 PB Created Volume 11. 67 PB 13. 98 PB 5. 98 PB 27. 55 PB Created Volume (% of Total Volume) 66. 70% 34. 01% 12. 85% 54. 66% Deleted Volume 12. 47 PB 10. 52 PB 3. 38 PB 29. 27 PB Deleted Volume (% of Total Volume) 71. 26% 25. 61% 7. 28% 58. 07% Created and Deleted 10. 57 PB 8. 26 PB 2. 05 PB 18. 29 PB Created and Deleted (% of Created Volume) 90. 59% 59. 12% 34. 26% 66. 40% 42

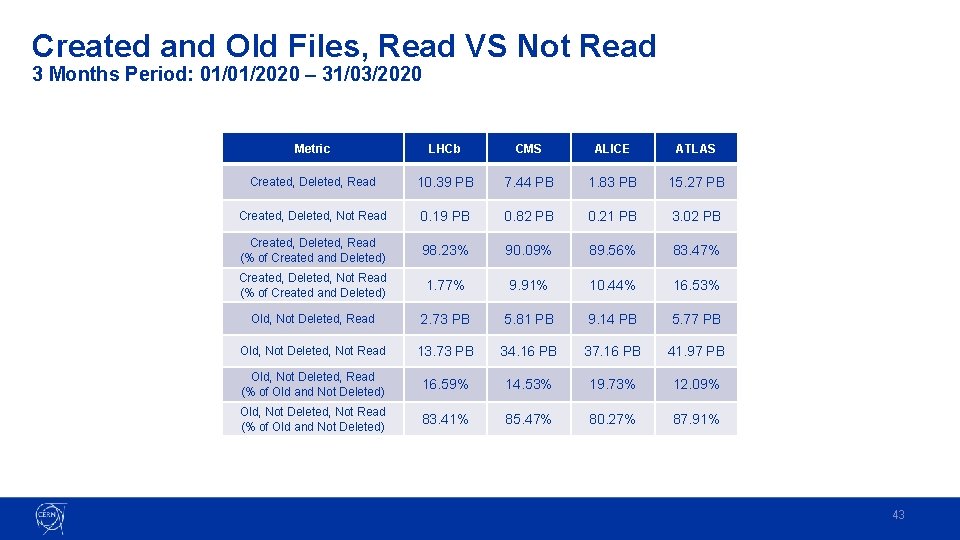
Created and Old Files, Read VS Not Read 3 Months Period: 01/01/2020 – 31/03/2020 Metric LHCb CMS ALICE ATLAS Created, Deleted, Read 10. 39 PB 7. 44 PB 1. 83 PB 15. 27 PB Created, Deleted, Not Read 0. 19 PB 0. 82 PB 0. 21 PB 3. 02 PB Created, Deleted, Read (% of Created and Deleted) 98. 23% 90. 09% 89. 56% 83. 47% Created, Deleted, Not Read (% of Created and Deleted) 1. 77% 9. 91% 10. 44% 16. 53% Old, Not Deleted, Read 2. 73 PB 5. 81 PB 9. 14 PB 5. 77 PB Old, Not Deleted, Not Read 13. 73 PB 34. 16 PB 37. 16 PB 41. 97 PB Old, Not Deleted, Read (% of Old and Not Deleted) 16. 59% 14. 53% 19. 73% 12. 09% Old, Not Deleted, Not Read (% of Old and Not Deleted) 83. 41% 85. 47% 80. 27% 87. 91% 43

Read Workload 3 Months Period: 01/01/2020 – 31/03/2020 Metric LHCb CMS ALICE ATLAS Read Workload 15. 28 PB 29. 11 PB 13. 32 PB 82. 57 PB Repeated Read Workload 2. 91 PB 21. 03 PB 11. 48 PB 55. 07 PB Repeated Reads (% of Read Workload) 19. 02% 72. 26% 86. 18% 66. 70% Read Volume 14. 85 PB 17. 34 PB 14. 04 PB 31. 50 PB Repeated Read Volume 3. 06 PB 10. 16 PB 11. 30 PB 13. 48 PB Repeated Read Volume (% of Read Volume) 20. 60% 58. 59% 80. 50% 42. 80% Average Fraction of File Read 86. 48% 62. 62% 18. 42% 93. 22% 44