Applied Psychometric Strategies Lab Applied Quantitative and Psychometric

Applied Psychometric Strategies Lab Applied Quantitative and Psychometric Series Power Analysis with G*Power and Optimal Design Hao Zhou & David Dueber February 6, 2017

Outline • • Fake real life research scenario Significance testing and statistical errors Power and power analysis Examples – Independent samples t test – Chi-square test of independence – HLM

Let’s design a study… • RQ: Do New Yorkers and Kansans spend the same amount of money per month on movies? • Sample 50 people from NY and 50 people from KS • Use an independent sample t test – H 0 = no difference – HA = difference

The problem: non-significant results •

How does sample size influence significance testing? • 5

How can I determine an appropriate sample size? Power Analysis

What is the practical utility of performing power analysis? • Do not spend excess time and money on participants that you do not need • Have a good chance of detecting the effect you are looking for • Satisfy the requirements of a funding agency

Key Concepts: Significance Testing •

What errors can occur in significance testing? • A Type I error is the rejection of true null hypothesis (false positive) – The alpha value (usually. 05) sets the risk of Type I error – Alpha ( ) is the asymptotic probability that the null hypothesis will be rejected if the null hypothesis is true • A Type II error is the retention of a false null hypothesis (false negative) – The Type II error rate ( ) is related to nominal alpha level ( ), effect size, and sample size (N).

Types of Statistical Errors Reject H 0 Statistical Decision Fail to Reject H 0 Null Hypothesis (H 0) is True False Type I Error Correct Decision (α) (1 -β) Correct Decision Type II Error (1 -α) (β)

Statistical Errors • 11

Critical value 1. 96

What is power? • 13

How Alpha, Beta and Effect size are related http: //rpsychologist. com/d 3/NHST 14

15

The power of a z test: Setting • RQ: Does being involved in sports have an effect on weight for 8 year old boys? – In the population of all 8 year old boys = 56 pounds with a = 3 pounds • To compute power, we need to know the true effect of sports involvement – In the population of 8 year old boys involved in sports = 55. 3 pounds with = 3 pounds • Suppose we randomly sampled from boys involved in sports, but the significance test is a comparison to the full population

The power of a z test: Calculation •

Steps for conducting a power analysis Step 1: Step 2: Step 3: Step 4: Statistical Test α and Power Effect Size Auxiliary Software Information
![and Easy-Peasy! Power Step 2: Alpha α=. 05, [NO!] • α =. 05 is](http://slidetodoc.com/presentation_image_h2/4457c41ef653ca2ebe18605b438a3088/image-19.jpg "and Easy-Peasy! Power Step 2: Alpha α=. 05, [NO!] • α =. 05 is")
and Easy-Peasy! Power Step 2: Alpha α=. 05, [NO!] • α =. 05 is typical • Typically, power =. 80, but it is your choice

Sizes Step Effect 3: Effect Sizes • Effect sizes are standardized versions of the statistics used in significance testing and can be compared across studies Test Statistic Mean Difference Cohen’s d Independence χ2 Correlation r Regression Effect Size r R 2 ANOVA • The effect size we use in a power analysis can be derived from a pilot study, from related literature, practical significance, or in desperation, from professional judgment

Effect size cutoffs • NO! • But if you really have no clue, then look up those tables from Cohen and interpret them as follows: Effect Size Meaning Small I expect this effect to be hard to detect Medium Neither small nor large. Large I expect this effect to be easy to detect

Auxiliary Information • Some types of analyses need more information to be able to calculate power – Design considerations such as allocation ratio for independent samples t test – Intraclass correlation coefficient (ICC) for multilevel data • Advanced power analysis can account for much of the messiness in research – Extent of missing data, outliers, invalid responses, low reliability,

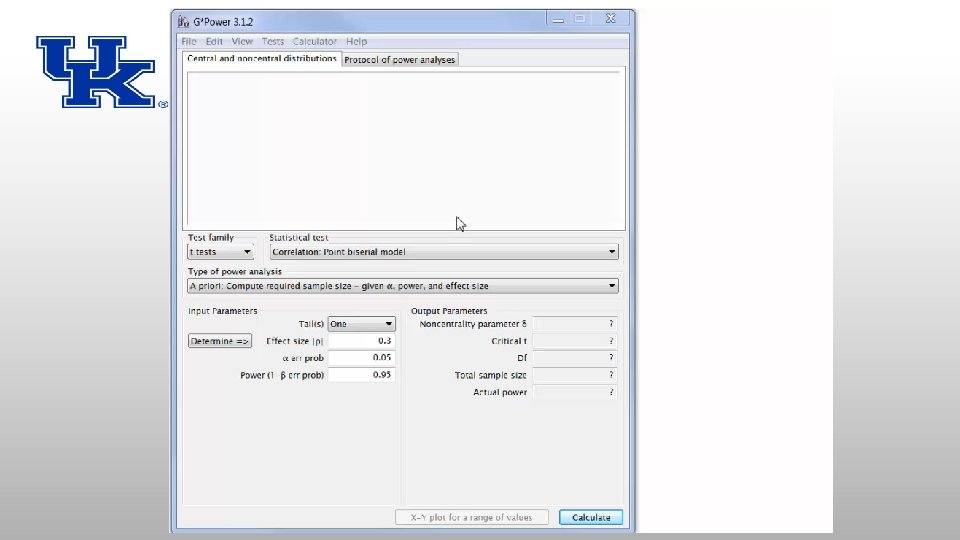
Software • For exact, F, t, z, and χ2 tests, use G*Power – Only for single-level data (no nesting or clustering) – Assumes perfect measurement, no missing data, etc. • For multi-level tests, use Optimal Design – Assumes perfect measurement, no missing data, etc. • For complicated designs, and to account for imperfect measurement, missing data, use simulations – E. g. , Mplus, SAS, R

Back to Movie Expenses • RQ: Do New Yorkers and Kansans spend the same amount of money per month on movies? Step 1: Step 2: Statistical Test α and Power Independent samples t test =. 05 Power =. 80 Step 3: Step 4: Effect Size Auxiliary Information ? ? Allocation Ratio = 1
 –")
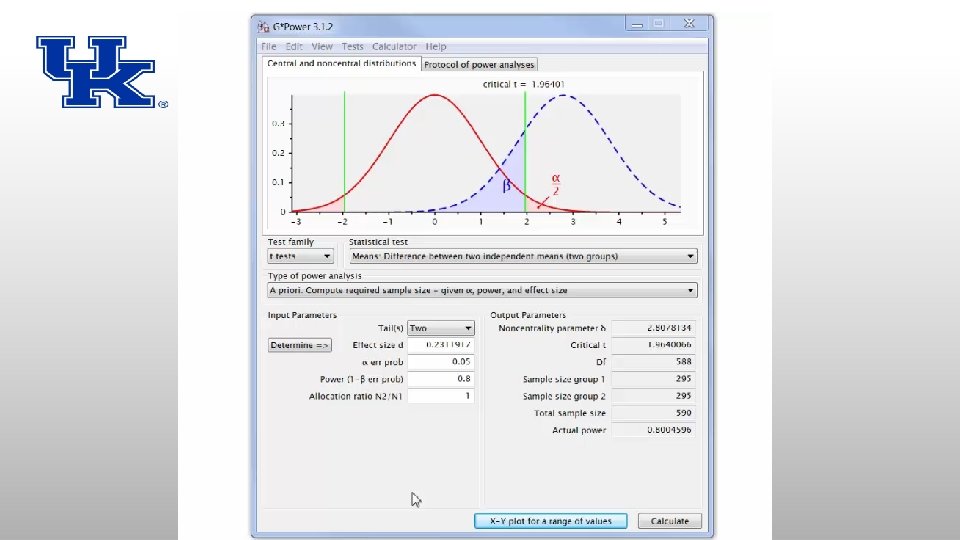
Estimating Effect Size • Based on data from Bureau of Labor Statistics (BLS) – differences in average salary between the two states indicate that we should expect a difference of $4. 21 in monthly movie expenses – The standard deviation of money spent on movie tickets per month is $18. 21 • G*Power can convert this information to an effect size for us

Results Using equal sample sizes is always vastly more efficient that unequal sample sizes This is the sample size we need

Warning: That calculated sample size assumes a lot of things! • All of the assumptions of the independent t-test must be met exactly for that sample size to be appropriate – Money spent per month must be continuous ( ) – Money spent must be approximately normally distributed ( ) – Independence of observations ( ) – No influential outliers (maybe? ) – Homogeneity of Variance (maybe? but t tests with equal sample sizes are largely robust to this violation )

What if it’s easier to recruit from New York than Kansas? The size of the Kansas group can not decrease *too* much lest the red distribution be very wide Twice as many New Yorkers as Kansans Total of 74 more people!
 • RQ: Does a generic")
Example 2: chi-square for contingency table (2 x 2) • RQ: Does a generic flu vaccine work better than a placebo? Step 1: Step 2: Step 3: Step 4: Statistical Test α and Power Effect Size Auxiliary Information Chi-square test =. 05 Power =. 80 ? ? None
? Placebo Vaccine Total")
What is the end data going to look like (sample data)? Placebo Vaccine Total No Flu 235 285 520 Flu 65 15 80 Total 300 600

Estimating Effect Size Prior research with the name-brand vaccine showed that 14% of people receiving the vaccine and 21% of people not receiving the vaccine contracted the flu Estimated effect size of 0. 202 from prior research 33
 test. Total number")
Results The test for independence is basically a multi-group goodness-of-fit (GOF) test. Total number of people, split into the two groups (placebo, vaccine) equally 34

Example 3: Growth Model • RQ: Does an alternate curriculum affect the growth rate of scores on the mathematics part of the MAP test among elementary students? Step 1: Step 2: Statistical Test α and Power HLM =. 05 Power =. 80 Step 3: Step 4: Effect Size Auxiliary Information . 50 ICC = ? ? Cluster Size = 25

Warnings about power analysis • Often provide a “best case” – More sophisticated techniques can account for things like missing data, non-normality, etc – Can perform sensitivity analyses based on the range of possible values rather than just a single one • Not generalizable

Software for conducting power analysis • G*Power – extensive within the observed, single level framework when nothing bad ever happens • Optimal Design - extensive with the observed, multi-level framework (including repeated measures and longitudinal designs) when nothing bad ever happens • Mplus (and R and, to a lesser extent, SAS and other SEM programs) – has capabilities to conduct power analysis via simulation study VERY flexibly

Danger, Danger Will Robinson! • When testing multiple effects at once, alpha =. 05 is inappropriate – Bonferroni (super conservative!) – Adjustments based on outcome correlations – Sequential gatekeeping – Selective alpha weighting – Combinatorial outcomes (e. g. first MANOVA, then post-hoc testing)

References and Links • Power Animation: http: //rpsychologist. com/d 3/NHST/ • Power analysis seminars from UCLA: https: //stats. idre. ucla. edu/other/mult-pkg/seminars/intropower/ • G*Power: http: //www. gpower. hhu. de/en. html • Optimal Design: http: //hlmsoft. net/od/ • Check out the User’s Guides for many examples
- Slides: 40