Applications of Standard Electrode Potentials Calculating Potentials of


 | HCl(3. 215 × 10 -3 M), Ag.")
 + e. Ag(s) + Cl 2 electrode potential")


")


III (�������� •")
- Slides: 32
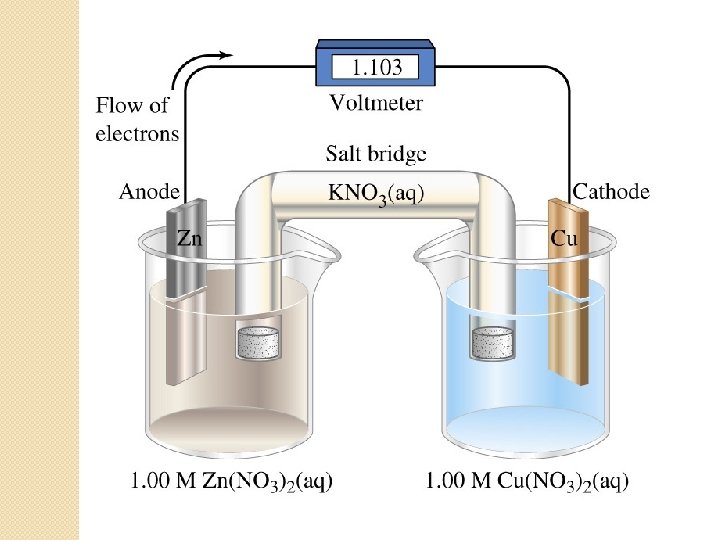
Applications of Standard Electrode Potentials
Calculating Potentials of Electrochemical Cells
E cell = ERight ELeft
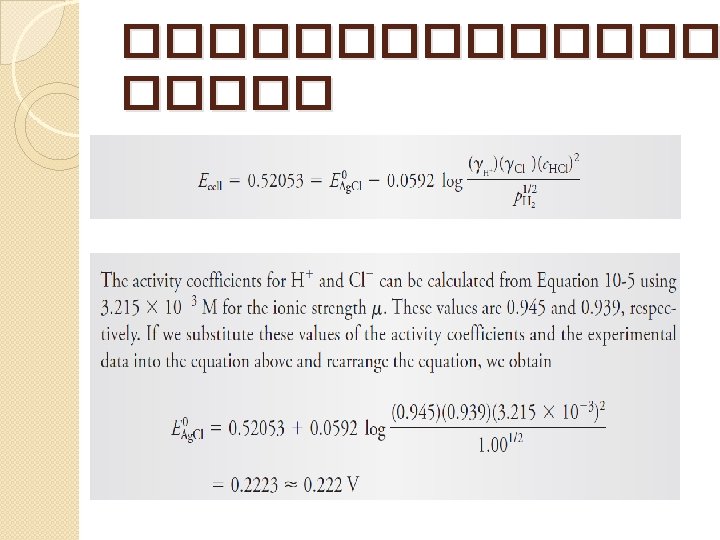
������� Determining standard Potentials Experimentally
�������� Pt, H 2(1. 00 atm) | HCl(3. 215 × 10 -3 M), Ag. Cl(sat’d) | Ag ��� Ecell = 0. 52053 V ������� standard electrode potential �� Ag. Cl(s) + e. Ag(s) + Cl-
������� electrode potential ��� Ag. Cl(s) + e. Ag(s) + Cl 2 electrode potential ��� H ++ e H 2)g( �� ��� Ecell = Eright - Eleft
Calculating Redox Equilibrium Constants
Calculating Redox Equilibrium Constants ����������
Calculating Redox Equilibrium Constants ���� electrode potential �����
Calculating Redox Equilibrium Constants ���������
������ 2+ �� 2 Mn. O-4 + 3 Mn 5 Mn. O 2 + 0 = + 4 H E + 2 Mn. O 4 + 8 H 4 )s ( +1. 695 V 4 H O 20 = +1. 23 + + 6 e E 2 3 Mn + 3 Mn. O 2 )s( + 12 H )s ( V 6 H O + 6 e 2 E 0 Mn. O 4 -/Mn. O 2 = E 0 Mn. O 2/Mn 2+ =
= log Keq 10 47. 1= 1 ₓ
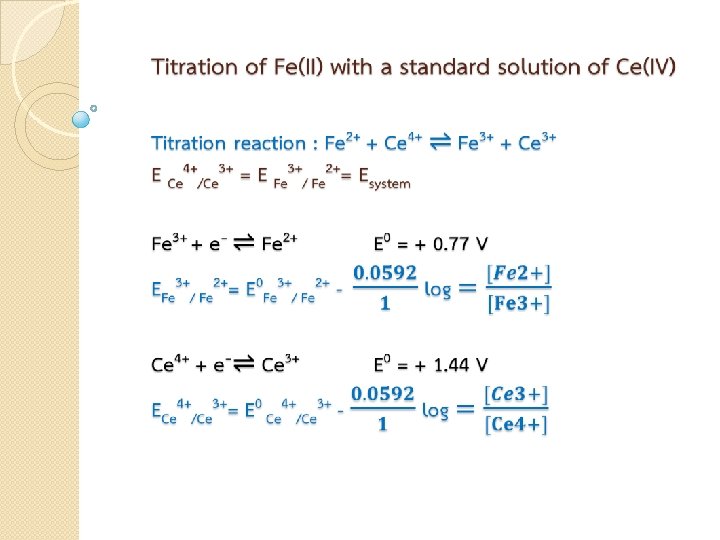
Electrode Potentials during Redox Titrations Constructing Redox Titration Curves
Equivalence point potential �
The titration curve
Equilvalence-Point Potential After the Addition of 25. 10 m. L of Cerium(IV)
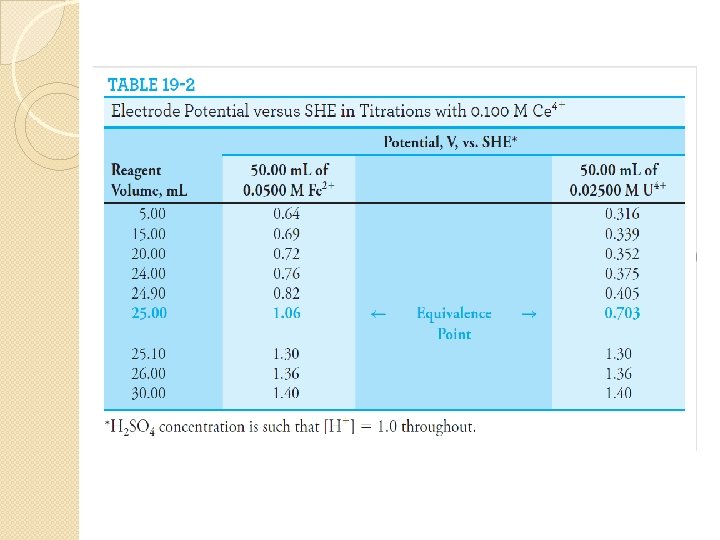
Oxidation/reduction curves are independent of the concentration of the reactants except when the solution is very dilute. Titration curves for 0. 1000 M Ce 4+ titration. A: Titration of 50. 00 m. L of 0. 05000 M Fe 2+.
Effect of Variables on Redox Titration Curves Reactant concentration titration curves are usually independent of analyte and reagent conc. Completeness of the Reaction completeness of the reaction↑ → change in Esystem in the equivalence-point region ↑ Fig. 19 -5 Effect of titrant electrode potential on reaction completeness. The standard electrode potential for the analyte (EA 0) is 0. 200 V; starting with curve A, standard electrode potentials for the titrant (ET 0) are 1. 20, 1. 00, 0. 80, 0. 60 and 0. 40, respectively. Both analyte and titrant undergo a one-electron change.
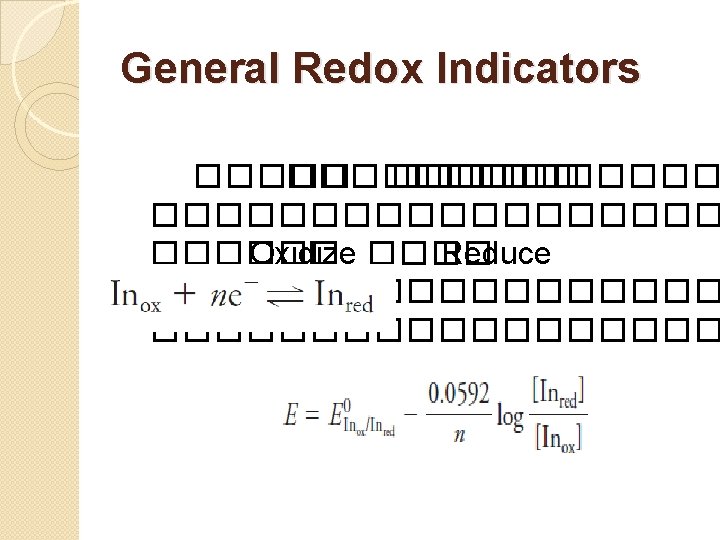
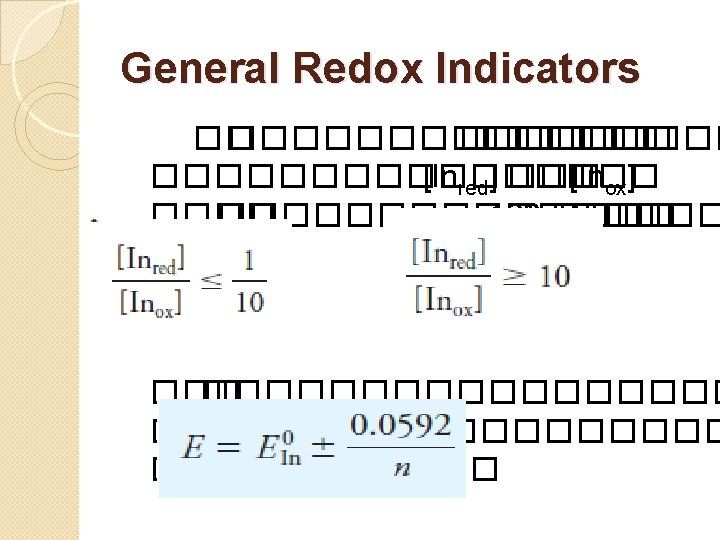
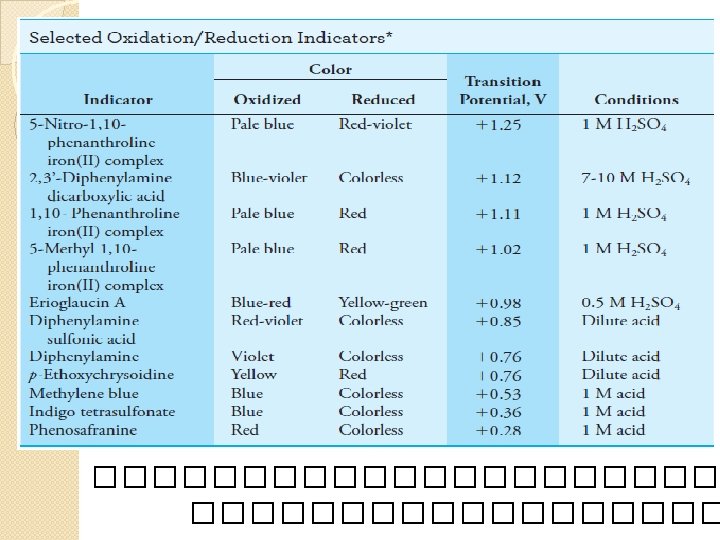
Oxidation / Reduction Indicators
Oxidation / Reduction Indicators �General Redox Indicators �Specific Indicator
General Redox Indicators
Specific Indicators ������ • Triiodide ion �������������� • Potassium thiocyanate ���� Iron)III (�������� • Potassium ferricyanide ���� Iron)II ( ����������