Application of RASS data for understanding the dynamics


 physical and")


 and NCEP (circles) vertical velocity at 11. 00 a.")

 solar radiation,")


 in March 2004")


 ◊ In Mar 04,")
 Heat low over")


 7 Structure of mesocyclone")

- Slides: 41
Application of RASS data for understanding the dynamics of THORPEX events J. R. Kulkarni Indian Institute of Tropical Meteorology 2 nd WP/RASS Workshop November 28, 2005
The skilful prediction of high-impact weather is one of the greatest scientific and societal challenges of 21 st century. n THORPEX is a response to this challenge n
THORPEX n For skillful prediction, the understanding of the dynamics of the events is essential Events studied: Heat wave conditions during March 2004 and 2005 Exceptional Heavy precipitation over Santacruz on 26/27 July 2005
404 MHz UHF Wind profiler system at IMD Pune Antenna Array Aperture 13 m X 13 m Schematic of the operation of a wind profiler Radar Control Room houses RF transmitter, duplexer and receiver
Merits of Wind profiler system n n n n n The principal merit of the profiler is the high temporal & height resolution which can be achieved. Wind profiles can be obtained as often as necessary. Real time computations and display is available. Frequent observations with a single profiler enables a time section to be prepared for study of movement of weather systems. Unattended operation is possible. Besides wind, vertical motion, divergence and turbulence can be monitored. The data represents a profile over a limited area of a few km across, over which the wind can be assumed to be constant in many situations. The height resolution is better than the radiosonde and a number of samples can be averaged to obtain greater accuracy. Because of the time integration the profiler effectively samples a much larger volume than the radiosonde.
Atmospheric subsidence and the surface temperature variability in the premonsoon month over a semi arid north peninsular Indian station: A case study Contributors Sachin Deshpande, R. R. Joshi, S. S. Damle and Narendra Singh Objectives n n The ‘heat wave’ is one of the high-impact weather phenomenon's over India. Climatologically, duration of the heat wave over the country is generally 5 to 6 days and there are two or three such episodes. March 2004 showed the similar behavior, however there was a long spell nearly of month duration of above normal temperatures over Pune. To understand the maintenance of the long spell of above normal temperatures over Pune, using the vertical velocities measured by wind profiler.
Maximum temperature distribution over Pune during March 2004
n The favorable factors for heat wave conditions to occur over a particular region are: (1) large region of warm dry air prevailing in the surrounding of that region and appropriate flow pattern for transporting hot air into the region of the study. (2) absence of moisture over a depth of atmospheric column. (3) large amplitude anticyclonic flow in the vertical levels above a place (Chaudhury et al. , 2000) n n The anticyclonic flow pattern in the vertical produces a chain of processes for generating and maintenance of the heat wave conditions. First it produces a large-scale subsidence which makes the atmospheric columns stable. The stability inhibits the formation of clouds and ventilation of the heat. The clear sky conditions help surface to get more irradiance, which increase the surface temperatures. Thus the key factor in the process is the subsidence or in more general terms 'vertical velocity‘. Direct measurements of the vertical velocities became available at Pune after installation of UHF wind profiler radar.
Data n n n In the present study, the vertical velocity data measured by the wind profiler in the month of March 2004 is utilized. Hourly averaged profiler velocity profiles were obtained four times a day viz. at 0800, 1100, 1400 and 1700 IST. The data of daily maximum temperature of Pune in the month of March 2004 has been collected from the bulletin of Daily Weather Report published by India Meteorological Department.
Role of advection in the surface temperature variability Generally heat waves develop in the northwestern parts of India, or northern parts of Pakistan. From these areas, waves expand to the neighboring subdivisions of country.
n n Two approaches of understanding the surface temperature variability viz. (1) physical and (2) dynamical. In the physical approach, the surface temperature at any place is determined by surface energy balance. In the dynamical approach, the temperature variability is determined by the processes of advection & adiabatic and diabatic heatings. The climatological latitudinal distribution of horizontal daily isolation in the month of March is plotted from the data given by Iqbal (1983). The higher temperatures are observed over the northern parts of the country. The reason for this type of temperature distribution lies in the land -sea distribution.
The latitude-time cross section of the maximum temperature distribution n The tilting of temperature isolines indicates the high temperatures are developed first in the northern latitudes and gradually moved towards the southern latitudes. Three episodes are clearly seen. In the first one i. e. on 4 th March a region of high temperatures is developed at latitude 28. 31 N and after 5 days the high temperatures are observed at 18. 53 N on 9 th March. The second episode is from 16 to 20 March and the third episode is from 23 to 27 March. There was an advection of warm air from northern to southern latitudes which makes the temperature distribution uniformly high.
Role of subsidence in the surface temperature variability n In order to quantitatively understand the role of subsidence, in the surface temperature variability, the variability in the vertical motion has been studied. n The height-time cross section of profiler vertical velocity in March 2004 n The shallow convection topped on by subsidence is clearly seen.
Monthly mean distribution of vertical velocity- March 2004 n n Existence of two cell structure in the vertical. The lower cell consists of upward motion extending up to 2 - 3 km and the upper cell consists of the subsidence motions confined between 3 to 6 km. This mean structure of the vertical circulation of the atmosphere is similar to that found over heat low observed by Blake et al (1983) during summer MONEX period. However, large variations (s. d. ~ 20 cm/sec) are observed in the individual profiler velocity profiles.
n n n The upward and downward motions can be considered to cause the cooling and warming effects on the surface heat budget and hence on the temperature. The upward motion mixes the air in the lowest levels and thus tries to prevent the surface temperature becoming high. The subsidence acts towards the increasing temperatures in two ways; (i) it prevents the upward motion in the lower levels from reaching higher heights, and thereby reducing the ventilation of heat. (ii) it warms and stabilizes the atmospheric column. The atmosphere becomes cloud free, which helps more solar radiation to reach the surface levels and increase the temperature.
Variation of Wind profiler (triangles) and NCEP (circles) vertical velocity at 11. 00 a. m. IST. ØWind profiler velocity is one order higher than the reanalysis velocity on most of the times. ØThe profiler velocity have larger variability in time and height than the reanalysis velocity. The reason Ø Reanalysis velocity is representative of synoptic scale motion whereas the profiler velocity is representative of mesoscale motions. ØThis is in agreement with the findings of Nastrom et al. (1985)
n n n The subsidence motion is not occurring continuously, but there are layers of upward and downward motions laid on each other. This is in agreement with the dynamics of the atmosphere i. e. Dynes compensation principle which states that the boxes of convergence and divergence are laid on each other. This feature is not observed in reanalysis wind structure, since the computations of vertical velocities are carried out for discrete layers of the atmosphere of relatively large thicknesses, in which the fine structures are averaged out.
n n The factors governing the variability of surface temperature are; (1) solar radiation, (2) advection and (3) subsidence. The advection dominates in the initial period. When the horizontal temperature gradient vanishes, the effect of advection becomes small. The incoming solar radiation at Pune is computed using the formulation given in Racz and Smith (1999) n n The effect of the solar radiation on the variability of the temperature is removed by fitting a straight line (shown in figure by dotted line) to the daily anomalies in the maximum temperature and subtracting the contributions of the solar radiation heating obtained through the equation of the fitted straight line. The straight line fit captures most of the original variance (~ 95%) and represents a reasonable approximation to the original curve. The residual temperature anomalies can be thought to be arising from subsidence and noise.
Association between subsidence depth and maximum surface temperature anomaly The subsidence occurs in the form of alternating boxes overlaid on each other. The total depth of the column, even if it is not continuous, adds to the warming and stability of the atmosphere. Ø The correlation coefficients are 0. 40, 0. 39, 0. 53 and 0. 46 at 8, 11 a. m. , 2 and 5 p. m. IST respectively. Ø The highest relationship is observed with the subsidence at 2 p. m. IST which is quite obvious.
Conclusions n First time instrument-measured-vertical velocities has been used to bring out the role of vertical velocities in the maximum temperature variability. n Existence of two cell structure in the vertical in the pre-monsoon season over India. n Two cell structure is similar to that found over heat low observed by Blake et al (1983) during summer MONEX period. However, large variations (s. d. ~ 20 cm/sec) are observed in the individual profiler velocity profiles. n The positive anomalies in the maximum temperature over Pune, are related to the heating processes by advection, radiation and subsidence. n Three distinct episodes of advective warmings viz. on 4 to 9, 16 to 20 and 23 to 27 March 2004. n n n After removing the effects of advection and incoming solar radiation, the variability in the anomalies in the maximum temperature is found to be related with the total depth of the atmospheric columns in which subsidence occurs. Application of study A simple regression model may be developed to forecast the maximum temperature anomaly at local scale a few hours ahead. The two cell structure and the order of the vertical velocity brought out in this study will be found useful in the validation of the meso scale models over the Indian region and in turn will be useful in improving the short range temperature forecasts over the region
A comparative study of structure of atmospheric subsidence over Pune in March 2004 and 2005 using Wind Profiler ◊ Hourly averaged vertical wind velocity profiles were obtained four times a day from 0800 to 1700 hrs IST in March 2004 and 2005. ◊ Mesoscale vertical velocities have been used to understand the maintenance of long spell of above (in March 2004) and below (in March 2005) normal surface temperatures. ◊ The structure of atmospheric subsidence in Mar 04 and Mar 05 is compared
Distribution of the anomalies of the surface temperatures ( 0 C) in March 2004 and 2005 over India
Maximum temperature distribution over Pune during March 2004 and 2005 On every day of March 2004 the daily maximum temperature was above normal while it was below normal nearly for half of the month during March 2005.
Latitude-time cross section of the maximum temperature distribution Mar 04 ◊Tilting of temperature isolines ◊ Advection makes the temperature distribution uniformly high. Mar 05 ◊ Temperature isolines nearly vertical; weak meridional temperature gradient. ◊ Weak or absence of temperature advection from north in March 2005.
Comparison of mean vertical velocity (March 2004 and March 2005) ◊ In Mar 04, two cell structures; upward motion up to 2 -3 km and downward motion in the 3 -6 km ◊ In Mar 05, upward motion extending all the way up to 6 km ◊ In Mar 04, with the progress of the day, the subsidence penetrates to the lower levels reaching around 1 km in the afternoon hours. ◊ In Mar 05, upward motion existed in the layer 2. 0 to 3. 5 km and subsidence penetration was confined to levels above 1 km
References Blake DW, Krishnamurti TN, Low-Nam SV and Fein JS (1983) Heat low over Saudi Arabia desert during May 1979 (summer MONEX). Mon Wea Rev 111: 1759 -1775 Chaudhury SK, Gore JM, Sinha Ray KC (2000) Impact of heat waves over India. Current Science 79 No. 2: 153 -155 Iqbal M (1983) An Introduction to Solar Radiation. Canada: Academic Press, 67 pp Nastrom GD and Gage KS (1983) A brief climatology of vertical air motions from MST radar data at Poker Flat, Alaska. 21 st Conf. Radar Meteor. Amer Meteor Soc, 135 -140 Racz Z and Smith RK (1999) The dynamics of heat lows. Q J R Meteorol Soc 122: 1 -22
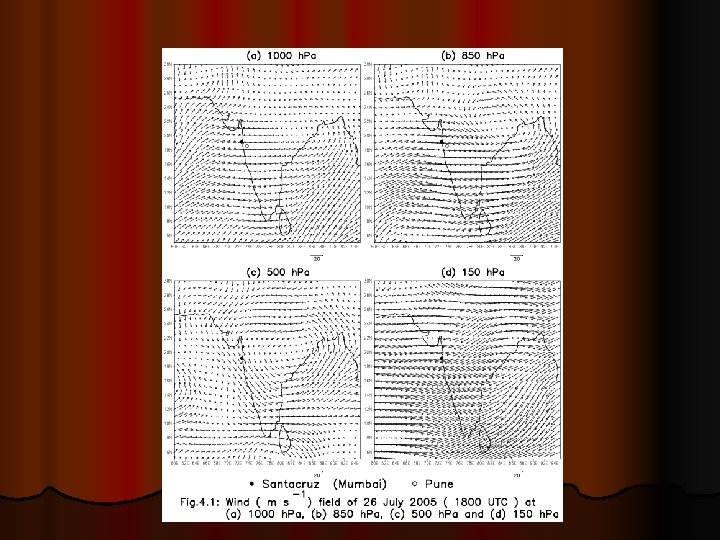
Exceptional heavy rainfall over Santacruz on 26/27 July 2005 n n Contributors R. Vijayakumar, S. B. Morwal and R. S. Maheshkumar
Map of Mumbai
Mum bai Ridge Easterly Jet Cyclonic circulations Low level Jet Monsoon trough Offshore trough
3 – hourly accumulated rainfall over Santacruz from TRMM satellite imageries UTC 26 Jul 27 Jul
Table 1. 6 Santacruz heavy rainfall and its association with the Colaba heavy rainfall Occurrence only at Santacruz and absent at Colaba Total Category of heavy rainfall Common occurrence at Santacruz and Colaba both places % of common occurrence 1 6. 5 – 12. 9 cm 125 174 299 44 2 13. 0 – 19. 9 cm 17 60 77 22 3 20. 0 cm and above 10 22 32 31 Total 152 256 408 37
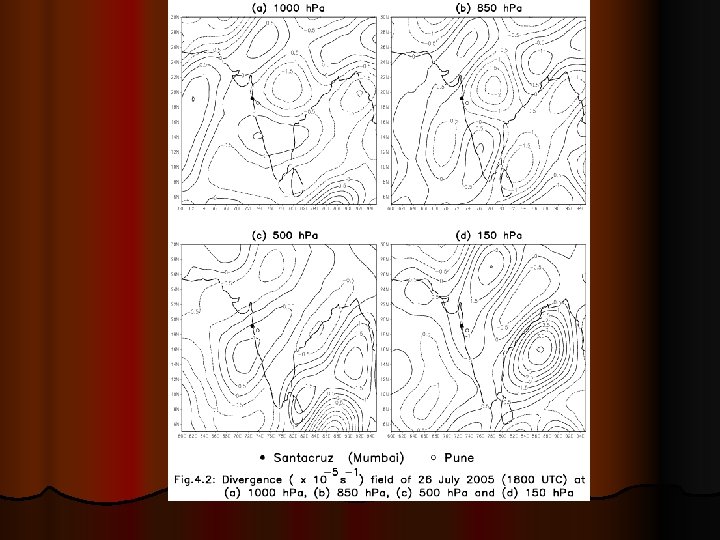
l l These results can be interpreted in terms of the horizontal scale of the convection. As the rainfall amounts are increased, the percentages of common occurrences decrease indicating localized growth of the cloud to super cell structures and corresponding reduction in the horizontal scale of the cloud system. On 26/27 July there was formation of “mesocyclone” over Santacruz which had subsidence motion in the surrounding regions. This inhibited the formation of the tall clouds in the surrounding region which explains the 7. 3 cm rainfall over Colaba compared to 94. 4 cm over Santacruz.
l. Simulation of heavy rainfall using 2 -D cloud model.
l Model requirements l Vertical Mesoscale convergence / divergence structure l Temperature bubble
The vertical distribution of convergence and vertical velocities at different hours on 26 July 2005 Height (Km) 1500 IST Divergence (s-1) Vertical velocity (m/s) 1700 IST Divergence (s-1) Vertical Velocity (m/s) 2000 IST Divergence (s-1) Vertical Velocity (m/s) 4. 65 1. 2 x 10 -3 2. 59 -1. 8 x 10 -3 2. 27 4. 95 -4. 7 x 10 -3 1. 18 3. 0 x 10 -4 2. 37 5. 25 -6. 3 x 10 -3 1. 11 -1. 6 x 10 -3 0. 69 -3. 7 x 10 -3 1. 27 5. 55 -7. 5 x 10 -3 -1. 13 -5. 9 x 10 -3 -1. 08 -4. 2 x 10 -3 0. 02 5. 85 1. 0 x 10 -3 -0. 85 9. 0 x 10 -4 -0. 83 -1. 0 x 10 -3 -0. 3 6. 15 1. 1 x 10 -3 -0. 52 1. 3 x 10 -3 -0. 43 -1. 3 x 10 -3 0. 09 6. 45 8. 0 x 10 -4 -0. 27 5. 0 x 10 -4 -0. 28 -1. 0 x 10 -3 -0. 21 6. 75 2. 0 x 10 -4 -0. 20 -3. 0 x 10 -4 -0. 36 -1. 3 x 10 -3 -0. 61
Height Km. The composite of the vertical distribution of vertical velocities Santacruz
Schematic of mesocyclone (from Stull 2000) 7 Structure of mesocyclone
Thank you !