APPLICATION OF KMEANS CLUSTERING The Matlab function kmeans
” was used for clustering •")
APPLICATION OF K-MEANS CLUSTERING • The Matlab function “kmeans()” was used for clustering • The parameters to the function were : 1. The matrix of entire Sea Surface Temperature dataset for a day(v). 2. The number of clusters (n) • The function was tested with the value of n ranging from 3 to 6. • In each case the output was a matrix with unique labels assigned to each cluster. (for ex. For n = 4, the output matrix had clusters identified by labels between 1 and 4). • The matrix was mapped onto the original SST data and visualized. • Statistical data extracted from the clusters included 1. Mean value of each cluster. 2. Standard deviation. 3. The size of each cluster. • Analysis of the statistical data was done over data for the entire month of August 2003. • The analysis involved a difference in clustering approach where pixels that migrated between clusters were identified , between n and n+1. • The pattern of migration was analyzed. Interesting features were visible between n = 3 and n = 4.

ORIGINAL IMAGES Aug 2 Aug 3 Aug 6 Aug 7

ORIGINAL IMAGES Aug 8 Aug 10 Aug 9 Aug 11

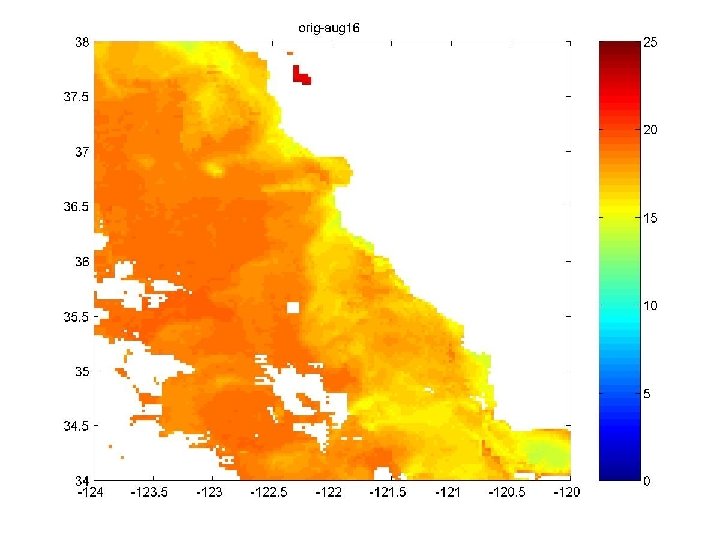
ORIGINAL IMAGES Aug 12 Aug 14 Aug 16

CLUSTERING C’ D E C A B Aug 2 – 4 clusters D’ A’ B’ Aug 2 – 5 clusters OBSERVATION: * There is no upwelling region on this day Original – Aug 2

CLUSTERING E D D’ C A B Aug 7 – 4 clusters Original – Aug 7 A’ B’ C’ Aug 7 – 5 clusters Upwelling overlaid

CLUSTERING E D C A B Aug 9 – 4 clusters Original – Aug 9 A’ B’ C’ D’ Aug 9 – 5 clusters Upwelling overlaid

CLUSTERING E D C A B Aug 9 – 4 clusters Original – Aug 9 A’ B’ C’ D’ Aug 9 – 5 clusters Upwelling overlaid

DIFFERENCE IN CLUSTERING • Detection • Feature Segmentation • Boundary identification ( For detection of fronts and eddies) Original – Aug 11 Overlay on original

Analysis of Data Y X X – axis : Number of observations Y – axis : Difference in mean values between cluster number ‘ 4’ for n =4 and cluster number ‘ 5’ for n = 5. • The difference in mean values between the clusters with the minimum mean temperature for 4 clusters and 5 clusters respectively, were plotted for the month of August 2003. • The upwelling region being a relatively colder region would fall in the cluster with the minimum temperature. • The plot showed a steady increase and then decrease during the upwelling period.
- Slides: 11