Application of ARIMA and GARCH Models to forecast


 0. 621301 0. 056157 11. 06371")

 Mean Equation Coefficient Std. Error z-Statistic Prob. AR(6) -0.")
 Variance Equation C 9. 54 E-08 9. 48 E-08 1. 00621")


- Slides: 16
Application of ARIMA and GARCH Models to forecast the Gold Futures Prices Dr. Nupur Hetamsaria (ICFAI Business School, Hyderabad) & Mithun Maity (Karvy Comtrade, Hyderabad) NICR Workshop, October 10 th 2007
Gold: An Investment Tool • • Equities and Commodities Gold forms 45% of total futures trading globally An effective hedging tool Higher liquidity than other real assets Oil price impact on Gold Resale value of Gold Forecasting the future Gold prices
Data and Methodology • • Daily prices from NYMEX and COMEX 14 years, appx. 3500 data points ARIMA GARCH
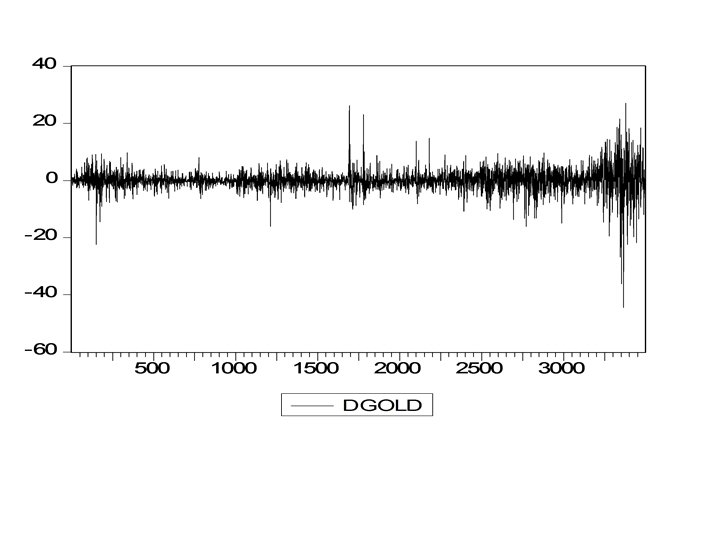
Price Graph of Gold Prices
Stationarity ADF Test Statistic 0. 313324 1% Critical Value* -3. 43532 PP Test Statistic 0. 439737 1% Critical Value* -3. 4353 • Gold Price series is not stationary. • First Difference of the price series.
Dickey Fuller Test Intercept ADF Test Statistic -23. 863 Philip Peron Test 1% Critical Value* -3. 4353 Akaike info criterion Schwarz criterion Trend and Intercept ADF Test Statistic 1% Critical Value* -3. 4353 5. 482112 Akaike info criterion 5. 485396 5. 492703 Schwarz criterion 5. 488923 -3. 9662 Akaike info criterion Schwarz criterion None -23. 9215 PP Test Statistic -60. 9116 1% Critical Value* -3. 9662 5. 481955 Akaike info criterion 5. 485005 5. 494311 Schwarz criterion 5. 490296 -23. 8299 -60. 86858 1% Critical Value* ADF Test Statistic PP Test Statistic 1% Critical Value* -2. 5664 Akaike info criterion 5. 481968 Schwarz criterion 5. 490794 PP Test Statistic -60. 84753 1% Critical Value* -2. 5664 Akaike info criterion 5. 485379 Schwarz criterion 5. 487142
Normality Mean 0. 086144 Median 0 Skewness -0. 74033 Kurtosis 18. 11785 Jarque Barra 33582. 55 Probability 0 Kurtosis high, indicating a ‘fat tail’ distribution or a leptokurtic distribution.
Correlogram Variable Coefficient Std. Error t-Statistic Prob. AR(1) 0. 621301 0. 056157 11. 06371 0 AR(3) -0. 134398 0. 032265 -4. 165387 0 AR(6) 0. 207676 0. 061152 3. 396052 0. 0007 AR(11) 0. 397422 0. 049314 8. 058982 0 AR(17) -0. 116156 0. 055514 -2. 09239 0. 0365 AR(21) -0. 249367 0. 024521 -10. 16953 0 AR(28) -0. 050772 0. 015572 -3. 260515 0. 0011 MA(1) -0. 641257 0. 05479 -11. 70385 0 MA(3) 0. 174463 0. 03261 5. 350072 0 MA(6) -0. 245322 0. 056933 -4. 308968 0 MA(11) -0. 435156 0. 046657 -9. 326747 0 MA(17) 0. 171075 0. 058323 2. 933233 0. 0034 MA(21) 0. 236852 0. 023383 10. 12933 0
Heteroscedasticity ARCH Test: F-statistic 74. 38698 Probability 0 Obs*R-squared 72. 86433 Probability 0
GARCH: Mean equation GARCH(1, 1) Mean Equation Coefficient Std. Error z-Statistic Prob. AR(6) -0. 03903 0. 018965 -2. 05778 0. 0396 AR(12) -0. 04492 0. 018417 -2. 43881 0. 0147 AR(45) -0. 04522 0. 017644 -2. 56266 0. 0104 AR(79) 0. 049338 0. 01843 2. 677098 0. 0074 AR(89) -0. 03371 0. 017259 -1. 95314 0. 0508
GARCH (1, 1) Variance Equation C 9. 54 E-08 9. 48 E-08 1. 00621 0. 3143 ARCH(1) 0. 04162 0. 01339 3. 10826 0. 0019 GARCH(1) 0. 960488 0. 012698 75. 64137 0
ARCH Test: F-statistic 1. 513348 Probability 0. 218712 Obs*R-squared 1. 513561 Probability 0. 218597
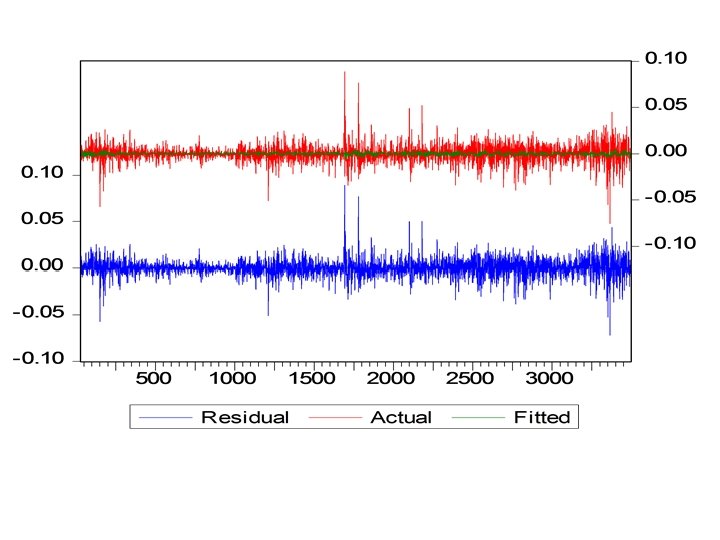
Performance of In sample forecast Root Mean Squared Error 7. 622201 Theil Inequality Coefficient 0. 006179 Bias proportion 0. 000069 Variance proportion 0. 000121 covariance proportion 0. 99981
Performance of out of sample forecast