AP STATISTICS SECTION 7 2 MEANS VARIANCE OF


![EXPECTED VALUE: The expected value of a game [random variable “X”] is found by](https://slidetodoc.com/presentation_image_h/1207a316f3a3c4fdbce7cd535b5e94d9/image-3.jpg "EXPECTED VALUE: The expected value of a game [random variable “X”] is found by")


=0. 4. In the first game, you")


 Suppose the temperature (Celsius) for that last 4 days were: 25ο,")

 and verbal")

 Discrete b) c) Using the formula: d) C = 55 X+250")
 Find")
 f) This is true only if the sales of the two products are")


- Slides: 20
AP STATISTICS SECTION 7. 2 MEANS & VARIANCE OF RANDOM VARIABLES
EXPECTED VALUE: DICE GAME Suppose it cost $1 to roll a die once and the payoff for each outcome is as follow: Roll a die 20 times and record each outcome. Calculate your payoff after 20 rolls. Q: Is this game worth playing? To determine if this game is worth playing, we need to find the “expected value”: The probability distribution for this game is: The expected value (long run pay off average) is: In the long run, you will lose 33. 333 cents per game. If you play this game 20 times, you will expect to lose $6. 67
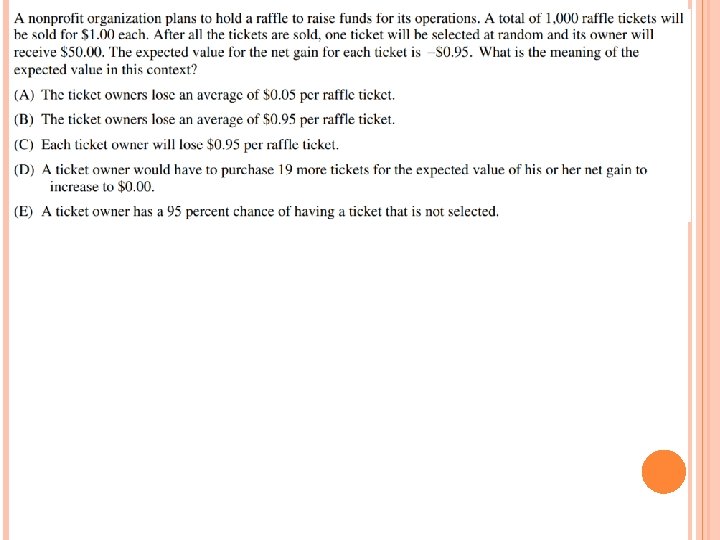
EXPECTED VALUE: The expected value of a game [random variable “X”] is found by multiplying each outcome “x” with it’s probability, then get the sum As the number of trials increases, what you expect to win or lose will get closer to the “Mean”(μx) of the random variable In the long run, average outcome of each trial of an experiment will converge to μx (expected mean) or (expected value of “X” )
Ex: Suppose that the marks distribution of a class is given as follow: (A = 4, B = 3, C+ = 2, C- = 1, F=0) a) Find the average grade in this class b) Find the standard deviation of the distribution of grades
There are 3 boxes that you can draw a single bill from. Box “A” has five $20 bills and one $100 bill. Box “B” has 500 $20 bills and 100 $100 bills. Box “C” has 10 $20 bills and 10 $50 bills. Which box should you choose from? Find the expected value for each box: Box “A”: Box “B”: Box “C”: Box “C” has the highest expected winnings
LAW OF LARGE NUMBERS As the number of observations increases, the mean of the observed values approaches the mean of the population The mean of the sample The mean of the population If there is more variation in outcomes, then more trials are needed to ensure that the sample mean is close to the population mean
Suppose you have a bias coin where P(head)=0. 4. In the first game, you win if the number of heads is between 35% to 45%. In the 2 nd game you win if you get heads 55% of the time. For each game, you have a choice of flipping either 40 times or 400 times. How many times should you flip for each game?
ACTIVITY: 7 C READ P 492 -493 Given the distribution of “X” and “Y” From this activity we see that:
RULES FOR MEANS AND VARIANCE: If Y=a+b. X, where X is a random variable and “a” and “b” are fixed numbers, then: Proof Mean Variance If X and Y are random variables then: Mean Variance: X & Y are independent Variance: X & Y are dependent. “p” is the correlation between X and Y (Advanced)
Ex: (Rule 1) Suppose the temperature (Celsius) for that last 4 days were: 25ο, 28ο, 29ο, 32ο. Find the average temperate in Celsius and Fahrenheit. The conversion from Celsius to Fahrenheit is: Using Rule #1, we can find the average of the degrees in Fahrenheit: Check your answer by converting the temperatures into Fahrenheit:
Ex: Suppose the equation Y=20 + 100 X converts a PSAT math score, X, into an SAT math score, Y. Suppose the average PSAT math score is 48. What is the average SAT math score? b) Suppose the standard deviation for the PSAT math score is 1. 5 points. What is the standard deviation for the SAT math score? Variance for the PSAT math score Standard deviation for SAT math score
Ex: Suppose the mean and standard deviation for the SAT math (X) and verbal (Y) score is as follow: a) What is the combined average SAT score? b) What is the standard deviation for the combined SAT score?
Ex: An electronic store has determined that its sales of LED tv’s has the following distribution: a) Is X discrete or continuous? b) Calculate the mean, variance, and standard deviation for the probability distribution c) Suppose that the store has a cost structure determined by the formula: C = 55 X+250. Create a probability distribution for cost d) Find the mean, variance, and standard deviation for the new random variable, C
a) Discrete b) c) Using the formula: d) C = 55 X+250
Suppose the company has another product, “computers”, whose sales follow the distribution: e) Find the mean, variance, and standard deviation for Y f) Find the following: g) Suppose profit is given by: Z = 200 X+350 Y Find the mean and standard deviation for profit.
e) f) This is true only if the sales of the two products are independent of each other. g) Using the formula: Combine Rule 1 & 2 Z = 200 X+350 Y
Ex: The rules for means and variances allow you to find the mean and variance of a sum of random variables without first finding the distribution of the sum, which is usually much harder to do. (a) A single toss of a balanced coin has either 0 or 1 head, each with probability 1/2. What are the mean and standard deviation of the number of heads? (b) Toss a coin four times. Use the rules for means and variances to find the mean and standard deviation of the total number of heads. Since each toss is independent, then:
Proof for Rule #1: Suppose X and Y are both random variables given by the formula: Average of all the Y variables: Average of all the X variables: Suppose that there are “n” values in both series: Take the average of both sides Simplify Return to Previous Screen