
AP Registration Deadline March 17 th Late Fee
- Slides: 18
AP Registration Deadline: March 17 th Late Fee ($50): March 18 th – 24 th Financial Aid Application Due: March 1 st Inference for a Population Proportion Section 12. 1
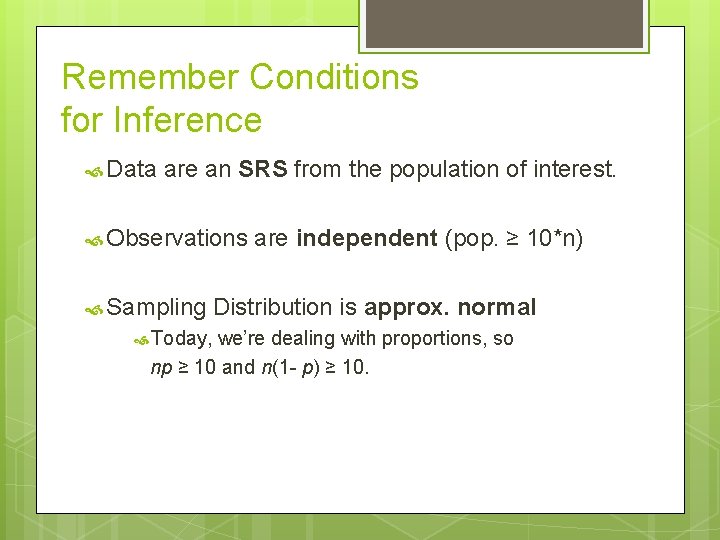
Remember Conditions for Inference Data are an SRS from the population of interest. Observations Sampling Today, are independent (pop. ≥ 10*n) Distribution is approx. normal we’re dealing with proportions, so np ≥ 10 and n(1 - p) ≥ 10.
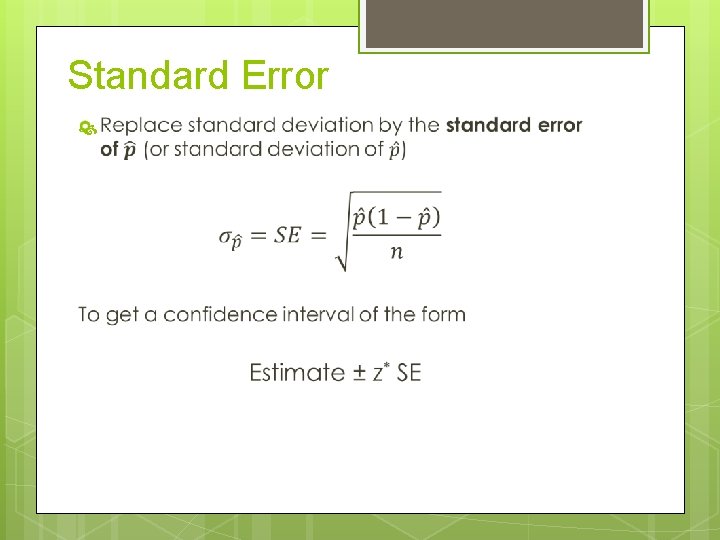
Standard Error
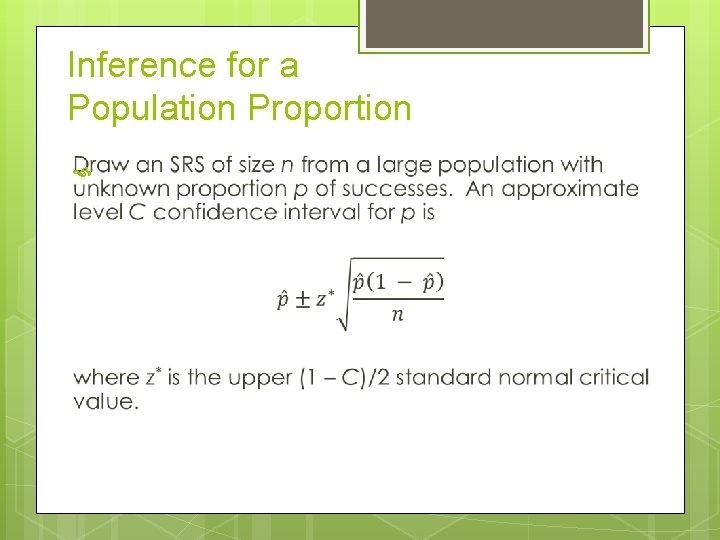
Inference for a Population Proportion
Remember: State Plan Do Conclude Statistics Problems Demand Consistency!!!
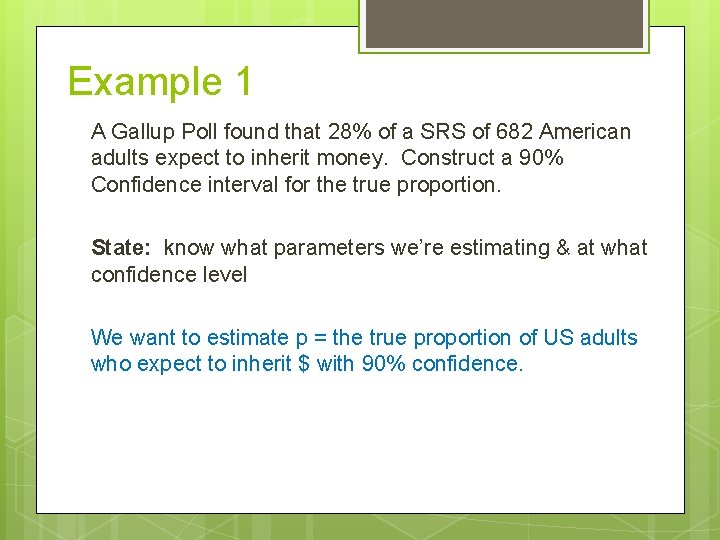
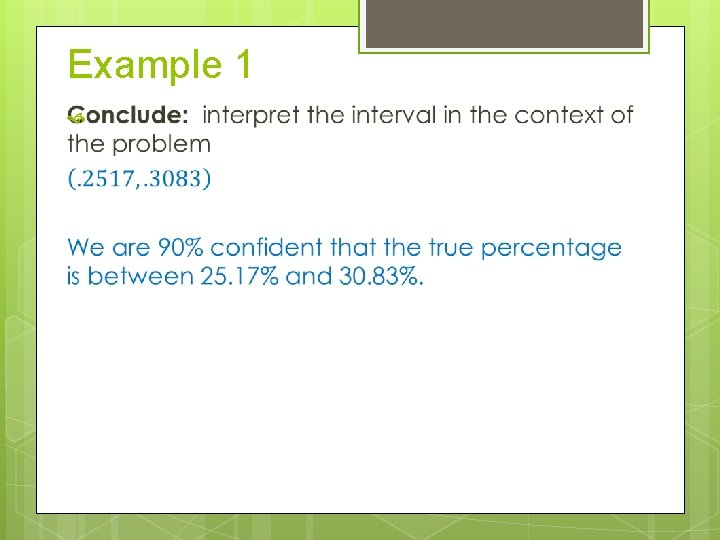
Example 1 A Gallup Poll found that 28% of a SRS of 682 American adults expect to inherit money. Construct a 90% Confidence interval for the true proportion. State: know what parameters we’re estimating & at what confidence level We want to estimate p = the true proportion of US adults who expect to inherit $ with 90% confidence.
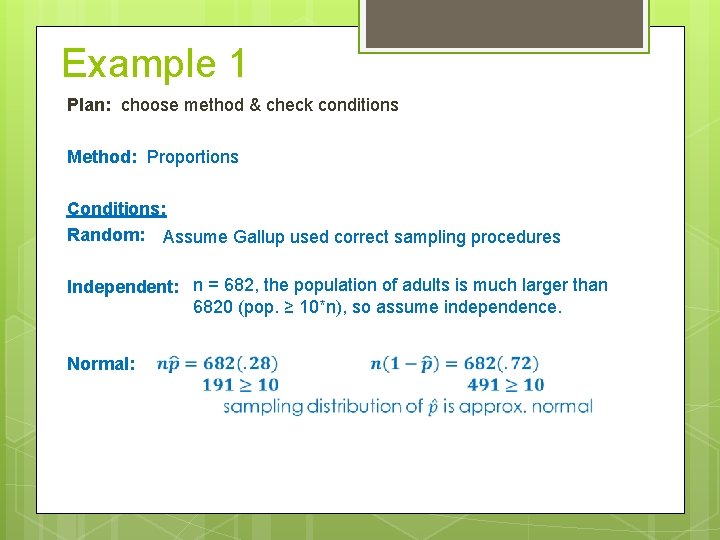
Example 1 Plan: choose method & check conditions Method: Proportions Conditions: Random: Assume Gallup used correct sampling procedures Independent: n = 682, the population of adults is much larger than 6820 (pop. ≥ 10*n), so assume independence. Normal:
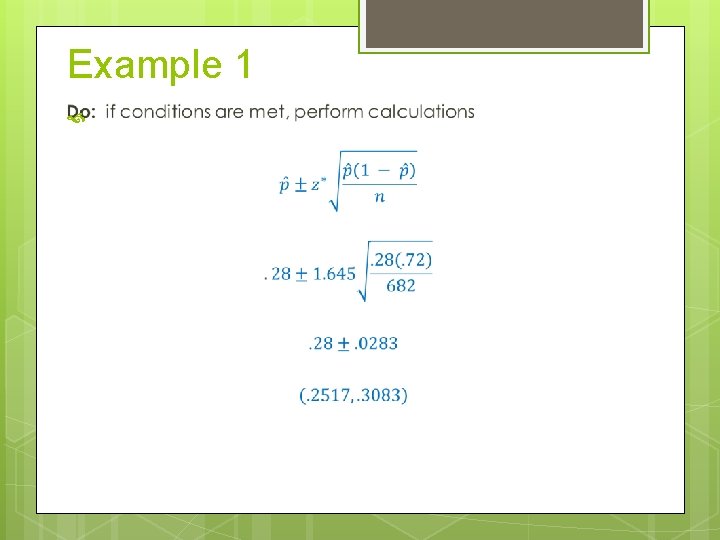
Example 1
Example 1
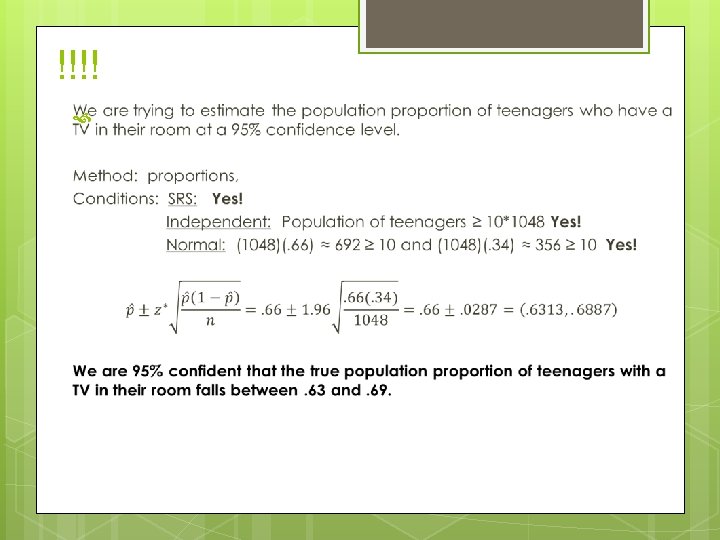
YOUR TURN!!! The New York Times and CBS News conducted a nationwide poll of 1048 randomly selected 13 - to 17 year-olds. Of these teenagers, 692 had a television in their room. We will act as if the sample were an SRS. Construct a 95% confidence interval for the proportion of all people in this age group who have a TV in their room.
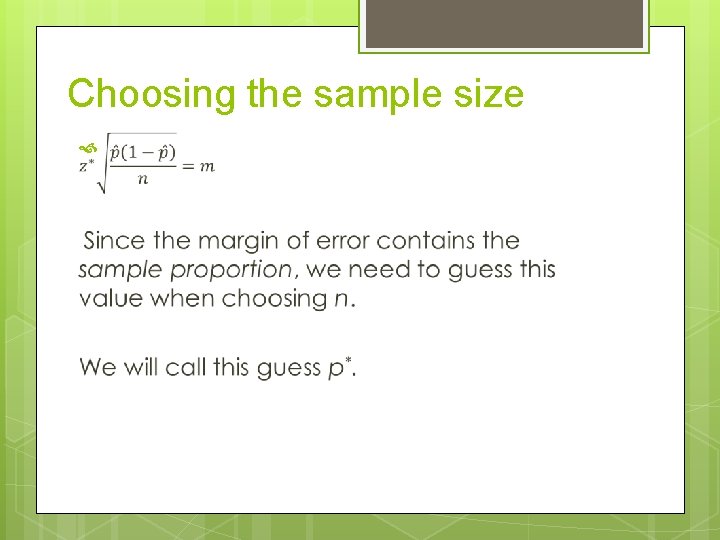
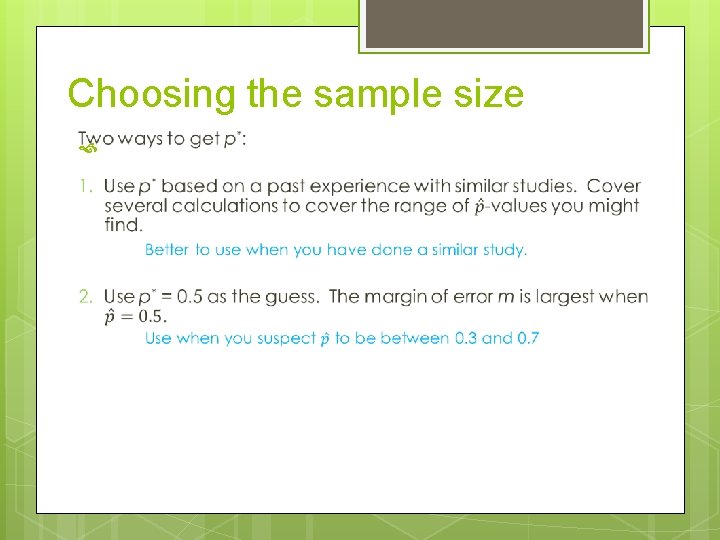
Choosing the sample size
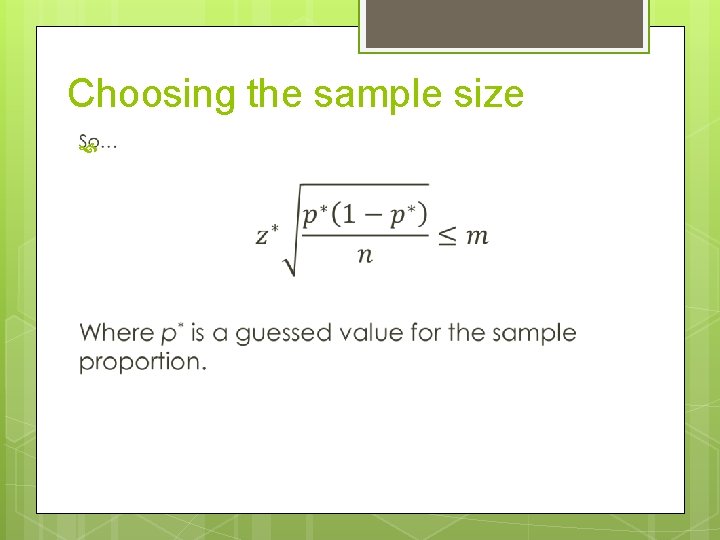
Choosing the sample size
Choosing the sample size
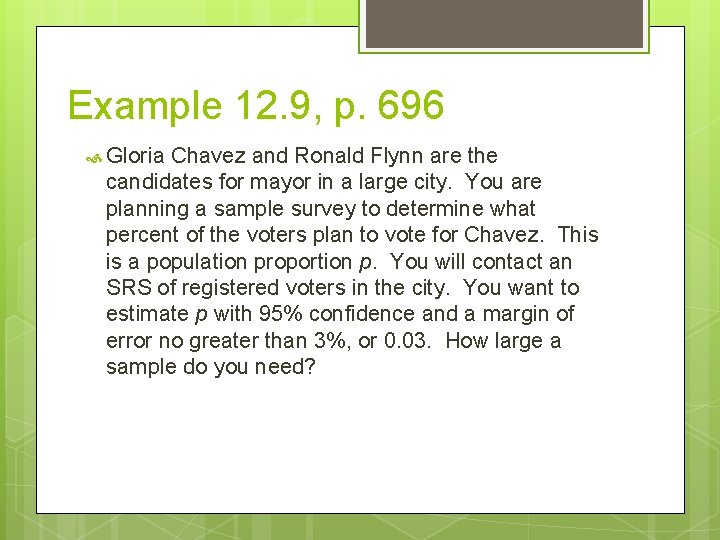
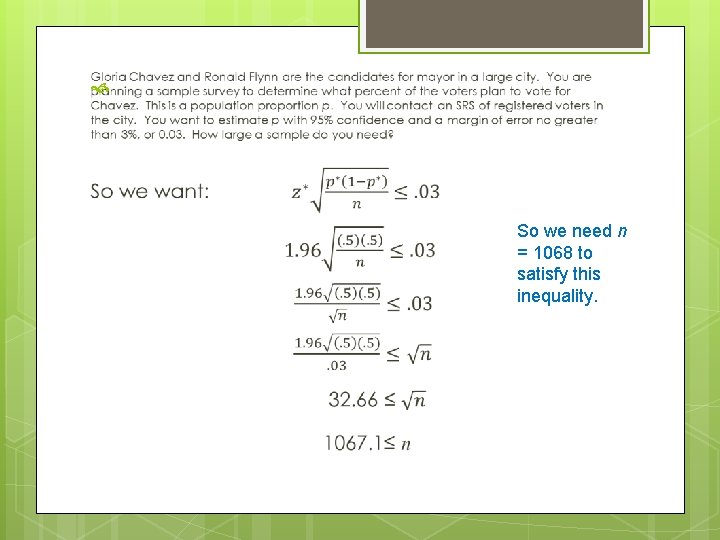
Example 12. 9, p. 696 Gloria Chavez and Ronald Flynn are the candidates for mayor in a large city. You are planning a sample survey to determine what percent of the voters plan to vote for Chavez. This is a population proportion p. You will contact an SRS of registered voters in the city. You want to estimate p with 95% confidence and a margin of error no greater than 3%, or 0. 03. How large a sample do you need?
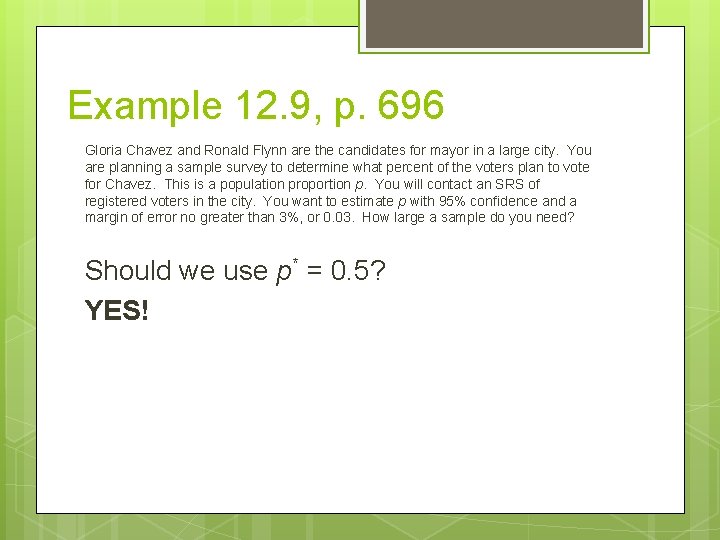
Example 12. 9, p. 696 Gloria Chavez and Ronald Flynn are the candidates for mayor in a large city. You are planning a sample survey to determine what percent of the voters plan to vote for Chavez. This is a population proportion p. You will contact an SRS of registered voters in the city. You want to estimate p with 95% confidence and a margin of error no greater than 3%, or 0. 03. How large a sample do you need? Should we use p* = 0. 5? YES!
So we need n = 1068 to satisfy this inequality.
Homework: p. 694: 12. 8, 12. 9 P. 696: 12. 10, 12. 11 Due: Tuesday