AP FRQ Religion and Migration 2002 The map


- Slides: 17
AP FRQ Religion and Migration
2002
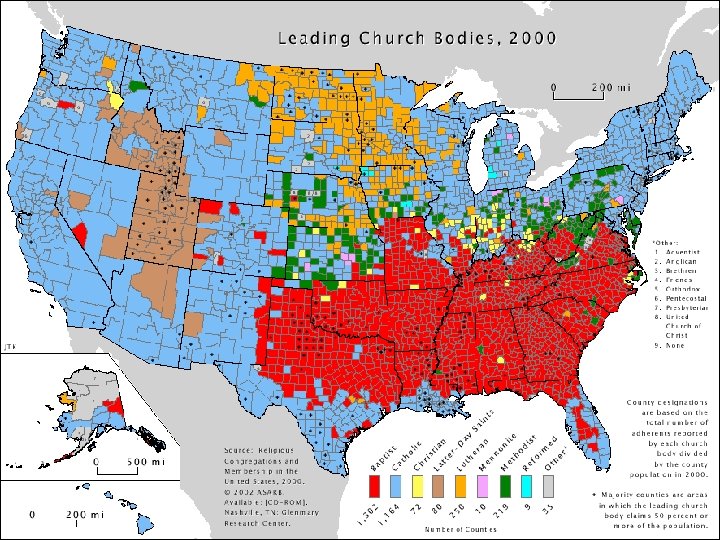
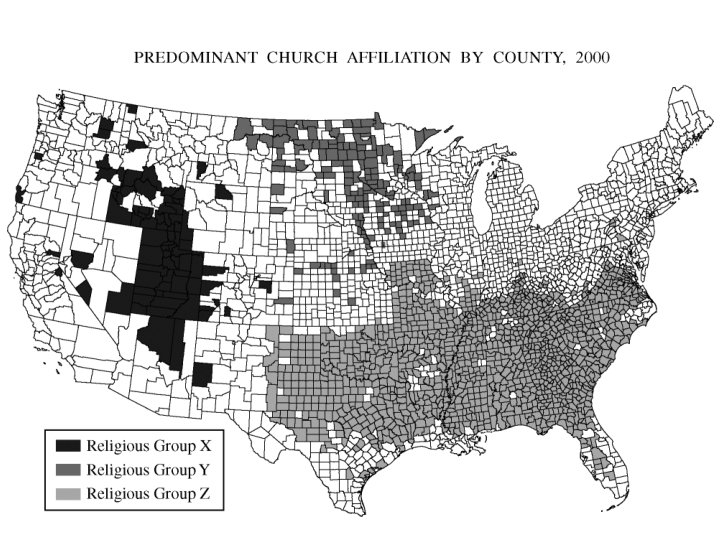
The map shows the religious distribution of three religious groups in the contiguous US. A. Using the letters in the legend, name three religious groups show on the map. B. For ONE of these religious groups, first identify and then explain TWO factors that have influenced the distribution shown on the map. C. Explain how the map as presented at this scale is an incomplete representation of the geography of religion in the United States.
Underline key words/phrases in the question itself. Circle specific requirements of the question. The map shows the religious distribution of three religious groups in the contiguous US. A. Using the letters in the legend, name three religious groups show on the map. B. For ONE of these religious groups, first identify and then explain TWO factors that have influenced the distribution shown on the map. C. Explain how the map as presented at this scale is an incomplete representation of the geography of religion in the United States.
Underline key words/phrases in the question itself. Circle specific requirements of the question. The map shows the religious distribution of three religious groups in the contiguous US. A. Using the letters in the legend, name three religious groups show on the map. B. For ONE of these religious groups, first identify and then explain TWO factors that have influenced the distribution shown on the map. C. Explain how the map as presented at this scale is an incomplete representation of the geography of religion in the United States.
Jot down key terms/people/examples/et c. that will be a part of your response. Make “thumbnail outline. ” The map shows the religious distribution of three religious groups in the contiguous US. A. Using the letters in the legend, name three religious groups show on the map. B. For ONE of these religious groups, first identify and then explain TWO factors that have influenced the distribution shown on the map. C. Explain how the map as presented at this scale is an incomplete representation of the geography of religion in the United States.
Answer the question in the order it is asked. If the question is organized “A…B…C…, ” then answer it “A…B…C…” The map shows the religious distribution of three religious groups in the contiguous US. A. Using the letters in the legend, name three religious groups show on the map. B. For ONE of these religious groups, first identify and then explain TWO factors that have influenced the distribution shown on the map. C. Explain how the map as presented at this scale is an incomplete representation of the geography of religion in the United States.
Answer each section of the question COMPLETELY. When you have answered a part of the question (now underlined and circled) cross it off. The map shows the religious distribution of three religious groups in the contiguous US. A. Using the letters in the legend, name three religious groups show on the map. B. For ONE of these religious groups, first identify and then explain TWO factors that have influenced the distribution shown on the map. C. Explain how the map as presented at this scale is an incomplete representation of the geography of religion in the United States.
Be specific. Avoid vague statements. Do NOT assume the reader is an expert in the topic. The map shows the religious distribution of three religious groups in the contiguous US. A. Using the letters in the legend, name three religious groups show on the map. B. For ONE of these religious groups, first identify and then explain TWO factors that have influenced the distribution shown on the map. C. Explain how the map as presented at this scale is an incomplete representation of the geography of religion in the United States.
The map shows the religious distribution of three religious groups in the contiguous US. A. Using the letters in the legend, name three religious groups show on the map. B. For ONE of these religious groups, first identify and then explain TWO factors that have influenced the distribution shown on the map. C. Explain how the map as presented at this scale is an incomplete representation of the geography of religion in the United States.
A. Using the letters in the legend, name three religious groups show on the map. 3 points X = Mormon Y= Lutheran Z = Baptist or Southern Baptist
Part B = 4 points 2 factor points, and 2 explanation points B. For ONE of these religious groups, first identify and then explain TWO factors that have influenced the distribution shown on the map. Factor Explanation Original Migration Mormonism began in the eastern US, but believers migrated west to Utah, an area outside the authority of those who persecuted them. Subsequent Migration Mormon families grew and migrated throughout the region to farm new areas that could be cultivated in the intermountain West. Lack of inmigration During the 1880 s – 1920 great wave of European immigration, no new immigrants with different religions came in to this region because of lack of urbanization. Physical environment Arid, rigorous climate with lack of water.
Part B = 4 points 2 factor points, and 2 explanation points B. For ONE of these religious groups, first identify and then explain TWO factors that have influenced the distribution shown on the map. Factor Explanation Original migration from northern and western Europe 1 - German and Scandinavians migrated from Europe in large numbers, bringing with them their religion – Lutheranism. 2 – Railroad companies and state governments recruited these groups to farm. Chain migration occurred as relatives continued to arrive. Lack of later in-migrations of other religions 1 – Later groups from Europe (Jewish, Catholic, Orthodox) did not come, as the region lacked the pull of cities. 2 – Upper Midwest did not attract rural to urban migration from the South during the 20 th century because of the smaller number of cities.
Part B = 4 points 2 factor points, and 2 explanation points B. For ONE of these religious groups, first identify and then explain TWO factors that have influenced the distribution shown on the map. Factor Explanation Indigenous religion with origins in small towns and rural areas of the southeastern US. 1 - Baptist religion matured as indigenous religion in the rural South. Based on Calvinism brought from Europe. No requirement formally credentialed clergy. 2 – Baptists appealed to African-Americans excluded from the main line Protestant denomination in the South. 3 – Baptists included other groups that created locally specific church communities. Lack of inmigration Other groups of European immigrants with different religions were not attracted to this predominantly agricultural region.
1 point Explain how the map as presented at this scale is an incomplete representation of the geography of religion in the United States • Map does not show small areas where other religions dominate. • Map does not show areas where density of adherents is really high. Map gives greater importance to small populations. • Map makes much diversity and variation in religions. • Not able to view sub-county variation. • Map overgeneralizes.