AP Biology Standard Deviation and Standard Error of

AP Biology: Standard Deviation and Standard Error of the Mean Carol Leibl National Math and Science Initiative Dallas, TX

What do you do to analyze and interpret these data?

Experimental Science In experimental science, observations and measurements are made. 3

Experimental Science Each measurement represents a piece of data. When multiple measurements are made or data collected, one might want to analyze the data to determine trends and conclusion. 4

Experiment Design Cornell • page 29 5

How are experiment data analyzed? Types 1. Continuous of - measuring data Data Ex. O 2 consumed 6

How are experiment data analyzed? Types 2. Discreet of - Counting data Data Ex. # of females vs males 7

Statistics, Analysis, and AP Biology c 2 Type of Data Comparing Means Discreet Data Continuous Data or or Counting Measuring Data Calculated on the AP Exam Graphing Other Information 8

Statistics, Analysis, and AP Biology Type of Data Calculated on the AP Exam c 2 Comparing Means Discreet Data Continuous Data or or Counting Measuring Data YES NO Graphing Other Information 9

Statistics, Analysis, and AP Biology Type of Data c 2 Comparing Means Discreet Data Continuous Data or or Counting Measuring Data Calculated on the AP Exam YES NO Graphing NO YES Other Information 10

Statistics, Analysis, and AP Biology c 2 Type of Data Discreet Data or Counting Data Comparing Means Continous Data or Measuring Data Calculated on the AP Exam YES NO Graphing NO YES Needs Understanding of Understanding Standard Deviation and Other Information of Degrees of Standard Error of the Freedom and Mean and Normal Null Hypothesis Distribution 11

How are experiment data analyzed? Deter- Averaging or tendency mining toward a central trends value. • Mean • Median • Mode 12

Mean The average of a set of numbers or the calculated central value. The sum of the numbers divided by the number of values used 13
 To find the median,")
Median the middle number (in a sorted list of numbers) To find the median, place the numbers you are given in value order and find the middle number. 14

Averaging or Determining What is Normal Find the median of {13, 23, 11, 16, 15, 10, 26}. Put them in order: {10, 11, 13, 15, 16, 23, 26} Median = 15 15

How are experiment data analyzed? Mode the value that appears most often (in a sorted list of numbers). 13, 13, 14, 16, 18, 21 16

Your Turn Day Temperature o. F 1 54 The daily high temperature for the last nine 2 been recorded. 45 days has Determine 3 the mean, mode and 68 median. 4 67 5 68 6 52 7 63 8 68 9 52 17

Answer Day Temperature o. F 1 45 2 52 3 52 4 54 5 63 6 67 7 68 8 68 9 68 SUM 537 Mean 537/9 Mean 60 Median Mode 18

Frequency shows how often distribution a measurement occurs in a collection of data. 19

Histogram A type of bar graph that illustrates a frequency distribution. 20

Histogram • horizontal continuous measurements • vertical axis represents the frequency of the measurements 21

22

Normal -the mean, mode distribution and median should all occur at the same place -forms a bell shaped curve when plotted on histogram 23

Normal -the majority of distribution points lie close to the average and fewer data points are found further from the average 24

Normal -Examples: distribution 1. Height 2. Weight 3. IQ 25

26

27
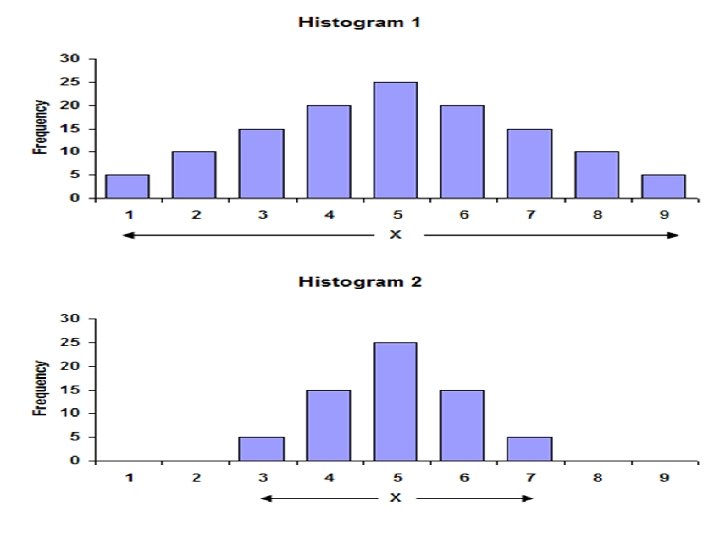

Compare and contrast the two histograms.

Mean? Do they form a normal distribution? In what ways are the two different? 30

Range? More varied? 31

• There is a way to determine how VARIED the data are without looking at a histogram. 32

• Standard deviation 33

• How is standard deviation calculated? 34

Standard statistical computation deviation that is about how far members of the population deviate from the mean 35

Standard deviation 36

Steps to 1. Determine the solve for mean for the set of SD data. 2. Find the difference between each data point and the mean and square the difference. 37

Steps to 3. Sum all squared solve for differences SD 4. Divide by the number of data point less one. 5. Finally take the square root of this number. 38

Your Turn 39

Your Turn 40

Steps for Determining Standard Deviation 41

SD Practice 42

Standard deviation vs. normal distribution In a normal distribution, • plus or minus 1 standard deviation is 68. 26% 43

Standard deviation vs. normal distribution • percentage of individuals falling within plus or minus 2 standard deviations is 95% 44

Standard deviation vs. normal distribution • 3 standard deviations is 99%. 68 -95 -99 rule 45

68 -9599 rule • 3 standard deviations is 99%. 68 -95 -99 rule 46

Two Different Standard In histogram 1 - 68% of all. Deviations the data points fall between 2. 947 and 7. 053. 95% of all the data points fall between 9. 106 and 0. 894. In histogram 2 - 68% of all the data points fall between 6. 046 and 3. 954. 95% of all the data points fall between 7. 092 and 2. 908 47

The mean plant height is 20 cm with a standard deviation of 4 cm. a. what heights represent the central 68% of all plant heights? b. what heights represent the central 95% of all plant heights? c. what percentage of heights fall between 8 and 32 cm? 48

Your Turn A student was measuring the height of mung beans. The height of 200 plants was measured. The mean height of the mung beans was 4 cm and the standard deviation was. 5 cm. What percentage of the plants had a height of 4 and 4. 5 cm? What percentage of the plants had a height between 3 and 4 cm? 49

Your Turn A student is germinating lettuce seeds in a petri dish and after three days, 95% of them are between 1. 1 cm and 1. 7 cm long. Assuming that the data is normally distributed determine the mean and the standard deviation. 50

Your Turn A student is measuring the mass of pill bugs and finds that 99. 7% falls between. 034 g and 0. 18 g. Assuming that the data is normally distributed determine the mean and standard deviation. 51


QUESTIONS? Carol Leibl AP Biology Content Specialist cleibl@nms. org
- Slides: 53