AP Biology Lab Review AP Biology BIG IDEA

AP Biology Lab Review AP Biology

BIG IDEA 1: EVOLUTION AP Biology

Lab 1: Artificial Selection § Concepts: Natural selection = differential reproduction in a population u Populations change over time evolution u Natural Selection vs. Artificial Selection u AP Biology

Lab 1: Artificial Selection § Description: Use Wisconsin Fast Plants to perform artificial selection u Identify traits and variations in traits u Cross-pollinate (top 10%) for selected trait u Collect data for 2 generations (P and F 1) u AP Biology

Sample Histogram of a Population AP Biology

Lab 1: Artificial Selection Analysis & Results: § Calculate mean, median, standard deviation, § § range Are the 2 populations before and after selection (P and F 1) actually different? Are the 2 sub-populations of F 1 (hairy vs. nonhairy) different? Are the means statistically different? A T-test could be used to determine if 2 sets of data are statistically different from each other AP Biology

Lab 2: Mathematical Modeling: Hardy-Weinberg § Concepts: Evolution = change in frequency of alleles in a population from generation to generation u Hardy-Weinberg Equilibrium u § Allele Frequencies (p + q = 1) § Genotypic Frequencies (p 2+2 pq+q 2 = 1) w Conditions: 1. 2. 3. 4. AP Biology 5. large population random mating no mutations no natural selection no migration

Lab 2: Mathematical Modeling: Hardy-Weinberg § Description: Generate mathematical models and computer simulations to see how a hypothetical gene pool changes from one generation to the next u Use Microsoft Excel spreadsheet u § p = frequency of A allele § q = frequency of B allele AP Biology

Lab 2: Mathematical Modeling: Hardy-Weinberg AP Biology

Lab 2: Mathematical Modeling: Hardy-Weinberg § Setting up Excel spreadsheet AP Biology

Lab 2: Mathematical Modeling: Hardy-Weinberg § Sample Results AP Biology

Lab 2: Mathematical Modeling: Hardy-Weinberg Analysis & Results: § Null model: in the absence of random events that affect populations, allele frequencies (p, q) should be the same from generation to generation (H-W equilibrium) § Analyze genetic drift and the effect of selection on a given population § Manipulate parameters in model: u Population size, selection (fitness), mutation, migration, genetic drift AP Biology

Lab 2: Mathematical Modeling: Hardy-Weinberg § Real-life applications: Cystic fibrosis, polydactyly u Heterozygote advantage (Sickle-Cell Anemia) u AP Biology

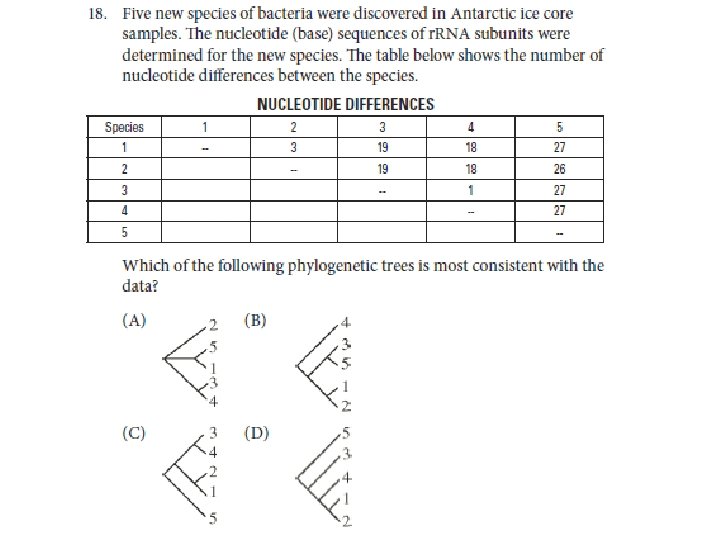
Lab 3: Comparing DNA Sequences using BLAST Evolutionary Relationships § Concepts: Bioinformatics: combines statistics, math modeling, computer science to analyze biological data u Genomes can be compared to detect genetic similarities and differences u BLAST = Basic Local Alignment Search Tool § Input gene sequence of interest § Search genomic libraries for identical or similar sequences u AP Biology

Lab 3: Comparing DNA Sequences using BLAST Evolutionary Relationships § Description: Use BLAST to compare several genes u Use information to construct a cladogram (phylogenetic tree) u Cladogram = visualization of evolutionary relatedness of species u AP Biology

Lab 3: Comparing DNA Sequences using BLAST Evolutionary Relationships AP Biology

Lab 3: Comparing DNA Sequences using BLAST Evolutionary Relationships § Use this data to construct a cladogram of the major plant groups AP Biology

Lab 3: Comparing DNA Sequences using BLAST Evolutionary Relationships § Fossil specimen in China § DNA was extracted from preserved tissue § Sequences from 4 genes were analyzed using BLAST AP Biology

Lab 3: Comparing DNA Sequences using BLAST Evolutionary Relationships AP Biology

Lab 3: Comparing DNA Sequences using BLAST Evolutionary Relationships § Analysis & Results: BLAST results: the higher the score, the closer the alignment u The more similar the genes, the more recent their common ancestor located closer on the cladogram u AP Biology

Lab 3: Comparing DNA Sequences using BLAST Evolutionary Relationships AP Biology

BIG IDEA 2: CELLULAR PROCESSES: ENERGY AND COMMUNICATION AP Biology

Lab 4: Diffusion & Osmosis § Concepts: Selectively permeable membrane u Diffusion (high low concentration) u Osmosis (aquaporins) u Water potential ( ) u § = pressure potential ( P) + solute potential ( S) u Solutions: § Hypertonic § hypotonic § isotonic AP Biology

Lab 4: Diffusion & Osmosis AP Biology

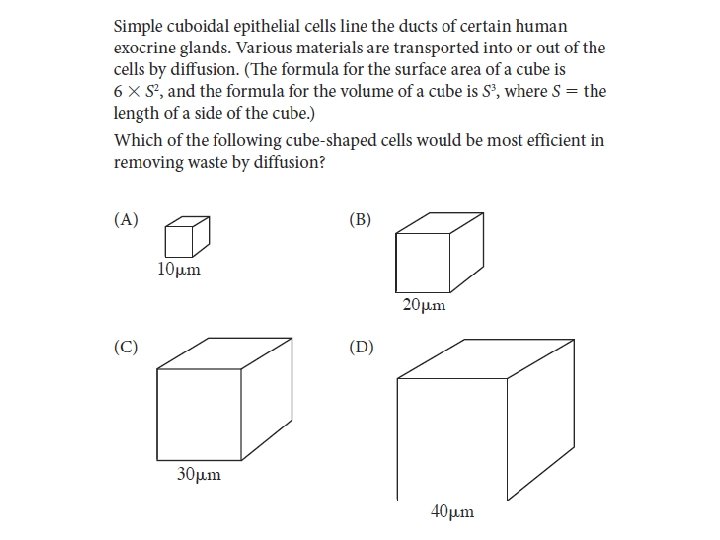
Lab 4: Diffusion & Osmosis § Description: Surface area and cell size vs. rate of diffusion u Cell modeling: dialysis tubing + various solutions (distilled water, sucrose, salt, glucose, protein) u Identify concentrations of sucrose solution and solute concentration of potato cores u Observe osmosis in onion cells (effect of salt water) u AP Biology

Lab 4: Diffusion & Osmosis AP Biology

Potato Cores in Different Concentrations of Sucrose AP Biology

Lab 4: Diffusion & Osmosis § Conclusions Water moves from high water potential ( ) (hypotonic=low solute) to low water potential ( ) (hypertonic=high solute) u Solute concentration & size of molecule affect movement across selectively permeable membrane u AP Biology

AP Biology

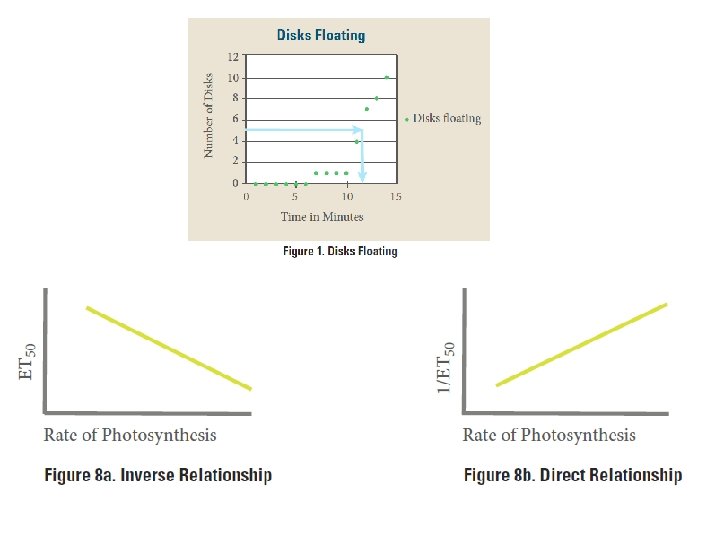
Lab 5: Photosynthesis § Concepts: Photosynthesis § 6 H 2 O + 6 CO 2 + Light C 6 H 12 O 6 + 6 O 2 u Ways to measure the rate of photosynthesis: § Production of oxygen (O 2) § Consumption of carbon dioxide (CO 2) u AP Biology

Lab 5: Photosynthesis § Description: Paper chromatography to identify pigments u Floating disk technique § Leaf disks float in water § Gases can be drawn from out from leaf using syringe leaf sinks § Photosynthesis O 2 produced bubbles form on leaf disk rises u Measure rate of photosynthesis by O 2 production u Factors tested: types of plants, light intensity, colors of leaves, p. H of solutions u AP Biology

Plant Pigments & Chromatography AP Biology

Floating Disk Technique

Lab 5: Photosynthesis § Concepts: photosynthesis u Photosystems II, I u § H 2 O split, ATP, NADPH u chlorophylls & other plant pigments § § u AP Biology chlorophyll a chlorophyll b xanthophylls carotenoids experimental design § control vs. experimental

AP Biology

Lab 6: Cellular Respiration § Concepts: Respiration u Measure rate of respiration by: § O 2 consumption § CO 2 production u AP Biology

Lab 6: Cellular Respiration § Description: Use respirometer u Measure rate of respiration (O 2 consumption) in various seeds u Factors tested: u § § § AP Biology Non-germinating seeds Germinating seeds Effect of temperature Surface area of seeds Types of seeds Plants vs. animals

AP Biology

Lab 6: Cellular Respiration AP Biology

Lab 6: Cellular Respiration AP Biology

Lab 6: Cellular Respiration § Conclusions: temp = respiration u germination = respiration u Animal respiration > plant respiration u surface area = respiration u Calculate Rate AP Biology

Lab 6: Cellular Respiration AP Biology

AP Biology

AP Biology

AP Biology

BIG IDEA 3: GENETICS AND INFORMATION TRANSFER AP Biology

Lab 7: Mitosis & Meiosis § Concepts: Cell Cycle (G 1 S G 2 M) u Control of cell cycle (checkpoints) u § Cyclins & cyclin-dependent kinases (CDKs) Mitosis vs. Meiosis u Crossing over genetic diversity u AP Biology

Lab 7: Mitosis & Meiosis AP Biology

Lab 7: Mitosis & Meiosis AP Biology
 u")
Lab 7: Mitosis & Meiosis § Description: Model mitosis & meiosis (pipecleaners, beads) u How environment affects mitosis of plant roots u § Lectin - proteins secreted by fungus § Root stimulating powder § Count # cells in interphase, mitosis Observe karyotypes (cancer, mutations) u Meiosis & crossing over in Sordaria (fungus) u AP Biology

Lab 7: Mitosis & Meiosis AP Biology

Lab 7: Mitosis & Meiosis AP Biology

Abnormal karyotype = Cancer AP Biology

Meiosis: Crossing over in Prophase I AP Biology
 u Arrangement")
Lab 7: Mitosis & Meiosis § Observed crossing over in fungus (Sordaria) u Arrangement of ascospores AP Biology

Sordaria Analysis % crossover = distance from = centromere AP Biology total crossover total offspring % crossover 2

Lab 8: Bacterial Transformation Concepts: § Transformation: uptake of foreign DNA from § surroundings Plasmid = small ring of DNA with a few genes u Replicates separately from bacteria DNA u Can carry genes for antibiotic resistance u Genetic engineering: recombinant DNA = p. GLO plasmid AP Biology

Lab 8: Bacterial Transformation AP Biology

Lab 8: Bacterial Transformation AP Biology

Lab 8: Bacterial Transformation § Conclusions: u u u AP Biology Foreign DNA inserted using vector (plasmid) Ampicillin = Selecting agent § No transformation = no growth on amp+ plate Regulate genes by transcription factors (ara. C protein)

AP Biology

AP Biology

AP Biology

AP Biology

AP Biology

Lab 9: Restriction Enzyme Analysis of DNA § Concepts: Restriction Enzymes § Cut DNA at specific locations u Gel Electrophoresis § DNA is negatively charged § Smaller fragments travel faster u AP Biology

Lab 9: Restriction Enzyme Analysis of DNA § Description AP Biology

Lab 9: Restriction Enzyme Analysis of DNA § Determine DNA fragment sizes AP Biology

Lab 9: Restriction Enzyme Analysis of DNA § Conclusions: Restriction enzymes cut at specific locations (restriction sites) u DNA is negatively charged u Smaller DNA fragments travel faster than larger fragments u Relative size of DNA fragments can be determined by distance travelled § Use standard curve to calculate size u AP Biology

BIG IDEA 4: INTERACTIONS AP Biology

Lab 10: Energy Dynamics § Concepts: Energy from sunlight drives photosynthesis (store E in organic compounds) u Gross Productivity (GPP) = energy captured § But some energy is used for respiration (R) § Net primary productivity (NPP) = GPP – R u Energy flows! (but matter cycles) § Producers consumers u u AP Biology Biomass = mass of dry weight

Lab 10: Energy Dynamics Pyramid of Energy Pyramid of Biomass Pyramid of Numbers AP Biology
 cabbage white butterfly")
Lab 10: Energy Dynamics § Description: u AP Biology Brassica (cabbage) cabbage white butterfly larvae (caterpillars)

Lab 10: Energy Dynamics § Measuring Biomass: Cabbage mass lost u Caterpillar mass gained u Caterpillar frass (poop) dry mass u

Lab 10: Energy Dynamics § Conclusions: AP Biology
 u Conservation of")
Lab 10: Energy Dynamics § Conclusions: Energy is lost (respiration, waste) u Conservation of Mass u Input = Output u AP Biology

AP Biology

Lab 11: Transpiration § Concepts: Transpiration § Xylem § Water potential § Cohesion-tension hypothesis u Stomata & Guard cells u Leaf surface area & # stomata vs. rate of transpiration u AP Biology

Lab 11: Transpiration AP Biology

Lab 11: Transpiration § Description: Determine relationship between leaf surface area, # stomata, rate of transpiration § Nail polish stomatal peels u Effects of environmental factors on rate of transpiration § Temperature, humidity, air flow (wind), light intensity u AP Biology

Analysis of Stomata AP Biology

Rates of Transpiration AP Biology

Lab 11: Transpiration § Conclusions: transpiration: wind, light u transpiration: humidity u Density of stomata vs. transpiration u Leaf surface area vs. transpiration u AP Biology

AP Biology

AP Biology

AP Biology

AP Biology

Lab 12: Animal Behavior § Concepts: u Experimental design § IV, DV, control, constants § Control vs. Experimental § Hypothesis innate vs. learned behavior u choice chambers u AP Biology § § § temperature humidity light intensity salinity other factors

Lab 12: Animal Behavior § Description: u Investigate relationship between environmental factors vs. behavior § Betta fish agonistic behavior § Drosophila (fruit fly) behavior § Pillbug kinesis AP Biology

Lab 12: Animal Behavior AP Biology

Lab 12: Animal Behavior § Hypothesis Development Poor: I think pillbugs will move toward the wet side of a choice chamber. u Better: If pillbugs are randomly placed on two sides of a wet/dry choice chamber and allowed to move about freely for 10 minutes, then more pillbugs will be found on the wet side because they prefer moist environments. u AP Biology

Lab 12: Animal Behavior § Experimental Design AP Biology sample size

Lab 12: Animal Behavior § Data Analysis: Chi-Square Test u Null hypothesis: there is no difference between the conditions u Degrees of Freedom = n-1 u At p=0. 05, if X 2 < critical value accept null hypothesis (any differences between observed and expected due to CHANCE) u AP Biology
")
Lab 13: Enzyme Activity § Concepts: u Enzyme § Structure (active site, allosteric site) § Lower activation energy Substrate product u Proteins denature (structure/binding site changes) u AP Biology

Lab 13: Enzyme Activity § Description: u Determine which factors affecting rate of enzyme reaction H 2 O 2 H 2 O + O 2 u Measure rate of O 2 production u AP Biology catalase
 AP Biology")
Turnip peroxidase Color change (O 2 produced) AP Biology

Lab 13: Enzyme Activity § Conclusions: u Enzyme reaction rate affected by: § § AP Biology p. H (acids, bases) Temperature Substrate concentration Enzyme concentration Calculate Rate of Reaction

AP Biology

Any Questions? ? AP Biology
- Slides: 104