AP 02 NFS i SCSI Performance Characterization and


- Slides: 50

AP 02 NFS & i. SCSI: Performance Characterization and Best Practices in ESX 3. 5 Priti Mishra MTS, VMware Bing Tsai Sr. R&D Manager, VMware

Housekeeping Please turn off your mobile phones, blackberries and laptops Your feedback is valued: please fill in the session evaluation form (specific to that session) & hand it to the room monitor / the materials pickup area at registration Each delegate to return their completed event evaluation form to the materials pickup area will be eligible for a free evaluation copy of VMware’s ESX 3 i Please leave the room between sessions, even if your next session is in the same room as you will need to be rescanned

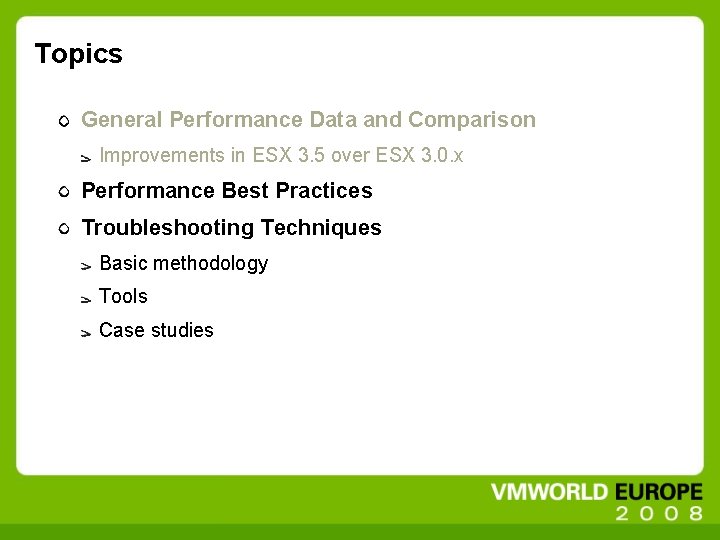
Topics General Performance Data and Comparison Improvements in ESX 3. 5 over ESX 3. 0. x Performance Best Practices Troubleshooting Techniques Basic methodology Tools Case studies

Key performance improvements since ESX 3. 0. x (1 of 3) NFS Accurate CPU accounting further improves load balancing among multiple VMs Optimized buffer and heap sizes Improvements in TSO support TSO (TCP segmentation offload) improves large writes H/W i. SCSI (with QLogic 405 x HBA) Improvements in PAE (large memory) support Results in better multi-VM performance in large systems Minimized NUMA performance overhead This overhead exists in physical systems as well Improved CPU cost per I/O

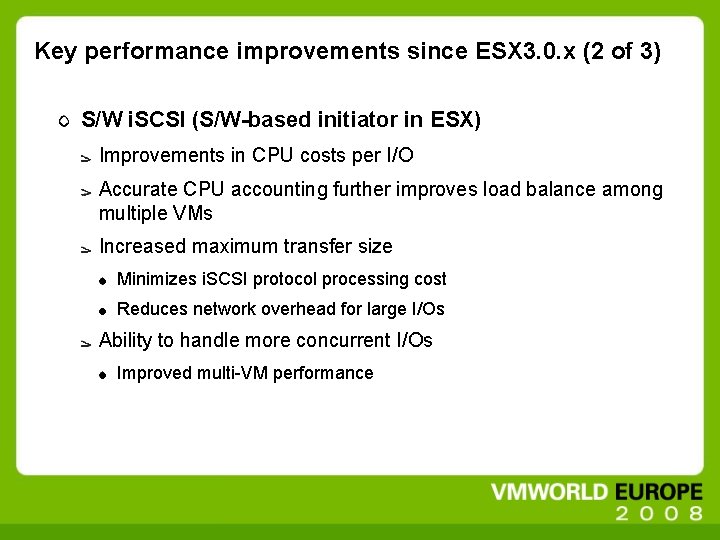
Key performance improvements since ESX 3. 0. x (2 of 3) S/W i. SCSI (S/W-based initiator in ESX) Improvements in CPU costs per I/O Accurate CPU accounting further improves load balance among multiple VMs Increased maximum transfer size Minimizes i. SCSI protocol processing cost Reduces network overhead for large I/Os Ability to handle more concurrent I/Os Improved multi-VM performance

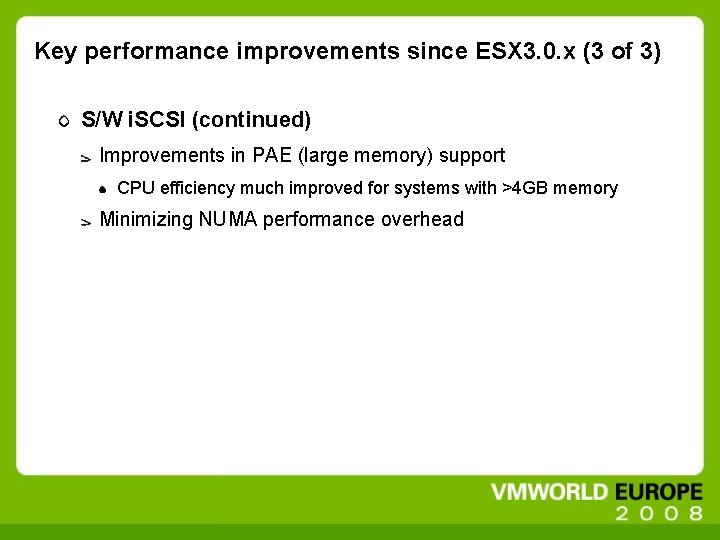
Key performance improvements since ESX 3. 0. x (3 of 3) S/W i. SCSI (continued) Improvements in PAE (large memory) support CPU efficiency much improved for systems with >4 GB memory Minimizing NUMA performance overhead

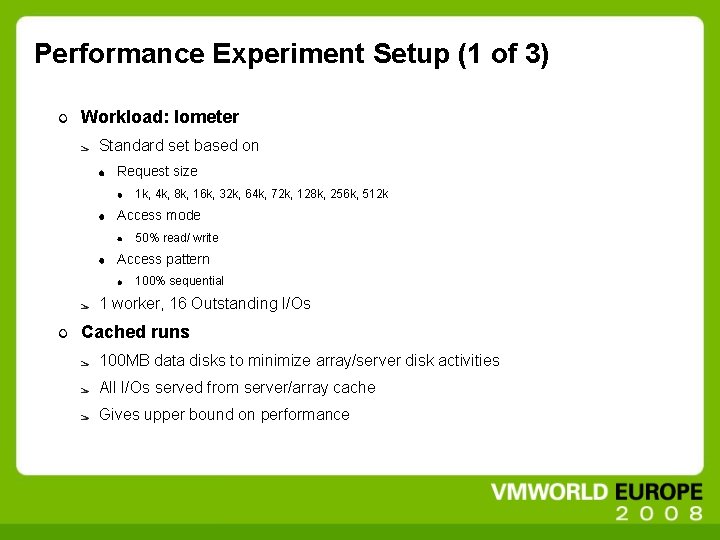
Performance Experiment Setup (1 of 3) Workload: Iometer Standard set based on Request size 1 k, 4 k, 8 k, 16 k, 32 k, 64 k, 72 k, 128 k, 256 k, 512 k Access mode 50% read/ write Access pattern 100% sequential 1 worker, 16 Outstanding I/Os Cached runs 100 MB data disks to minimize array/server disk activities All I/Os served from server/array cache Gives upper bound on performance

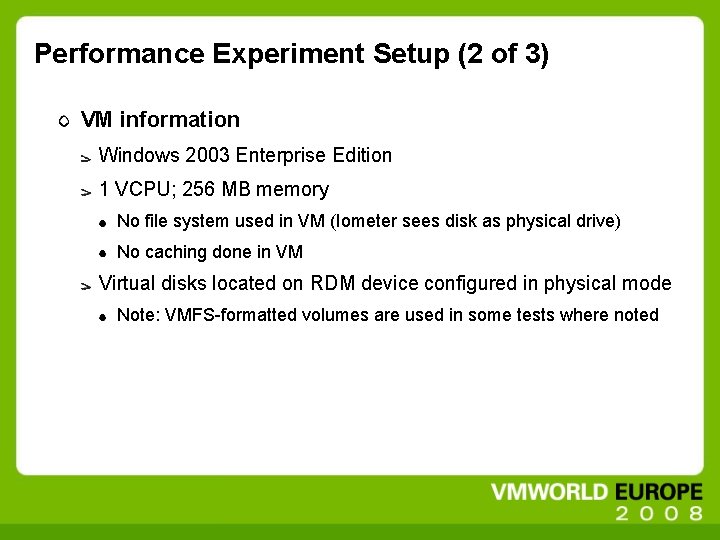
Performance Experiment Setup (2 of 3) VM information Windows 2003 Enterprise Edition 1 VCPU; 256 MB memory No file system used in VM (Iometer sees disk as physical drive) No caching done in VM Virtual disks located on RDM device configured in physical mode Note: VMFS-formatted volumes are used in some tests where noted

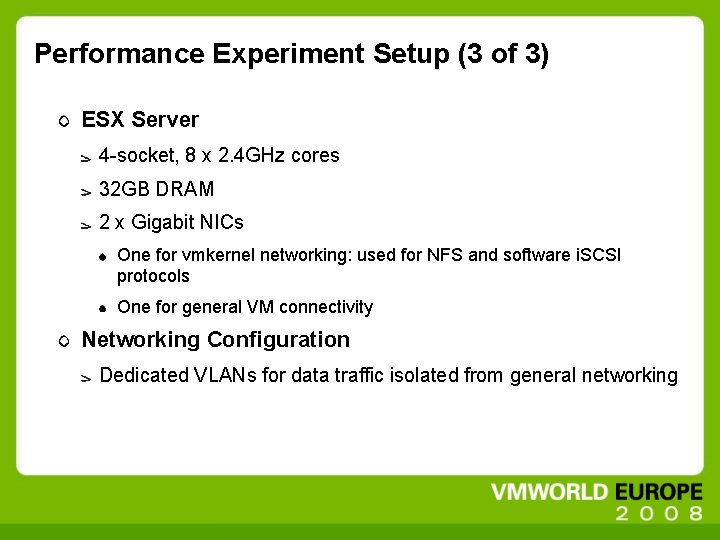
Performance Experiment Setup (3 of 3) ESX Server 4 -socket, 8 x 2. 4 GHz cores 32 GB DRAM 2 x Gigabit NICs One for vmkernel networking: used for NFS and software i. SCSI protocols One for general VM connectivity Networking Configuration Dedicated VLANs for data traffic isolated from general networking

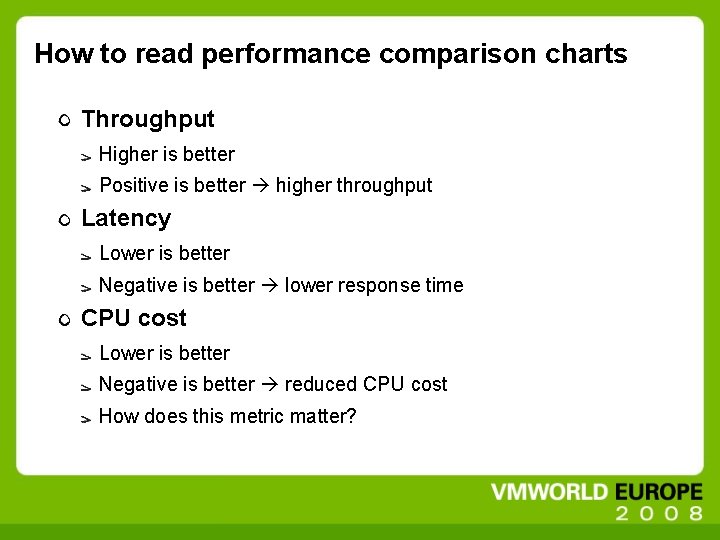
How to read performance comparison charts Throughput Higher is better Positive is better higher throughput Latency Lower is better Negative is better lower response time CPU cost Lower is better Negative is better reduced CPU cost How does this metric matter?

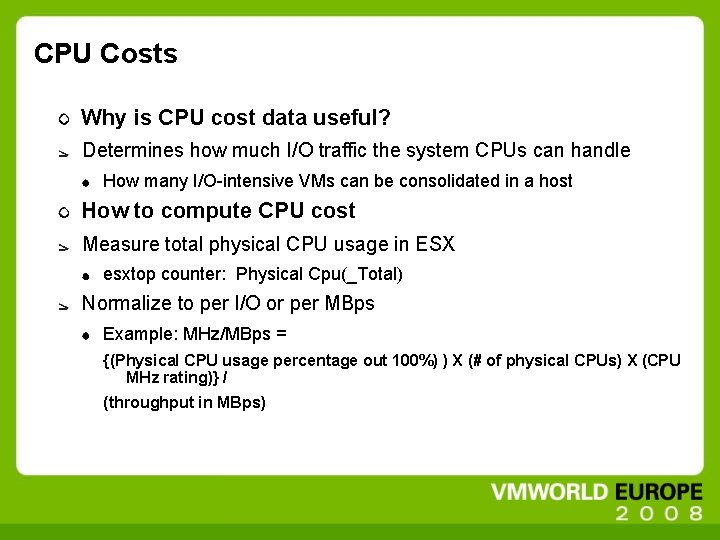
CPU Costs Why is CPU cost data useful? Determines how much I/O traffic the system CPUs can handle How many I/O-intensive VMs can be consolidated in a host How to compute CPU cost Measure total physical CPU usage in ESX esxtop counter: Physical Cpu(_Total) Normalize to per I/O or per MBps Example: MHz/MBps = {(Physical CPU usage percentage out 100%) ) X (# of physical CPUs) X (CPU MHz rating)} / (throughput in MBps)

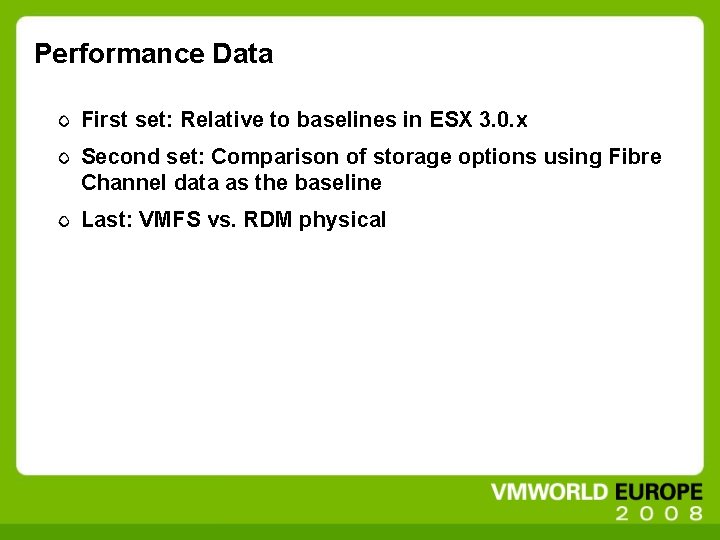
Performance Data First set: Relative to baselines in ESX 3. 0. x Second set: Comparison of storage options using Fibre Channel data as the baseline Last: VMFS vs. RDM physical

Software i. SCSI – Throughput Comparison to 3. 0. x: higher is better

Software i. SCSI – Latency Comparison to 3. 0. x: lower is better

Software i. SCSI – CPU Cost Comparison to 3. 0. x: lower is better

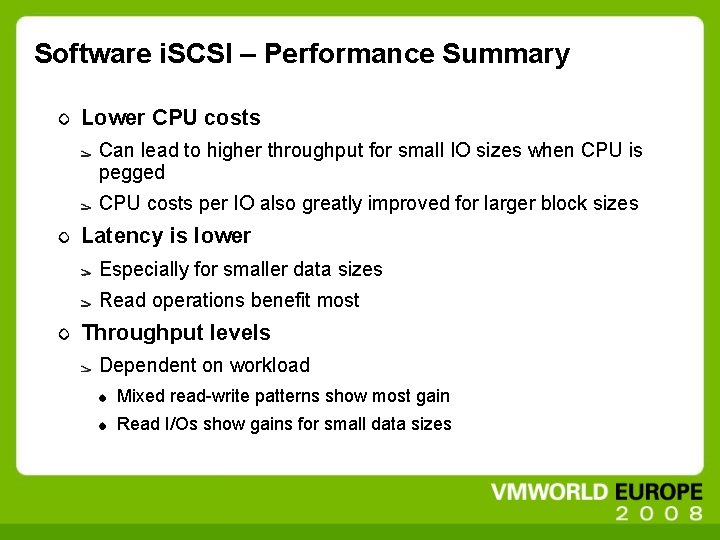
Software i. SCSI – Performance Summary Lower CPU costs Can lead to higher throughput for small IO sizes when CPU is pegged CPU costs per IO also greatly improved for larger block sizes Latency is lower Especially for smaller data sizes Read operations benefit most Throughput levels Dependent on workload Mixed read-write patterns show most gain Read I/Os show gains for small data sizes

Hardware i. SCSI – Throughput Comparison to 3. 0. x: higher is better

Hardware i. SCSI – Latency Comparison to 3. 0. x: lower is better

Hardware i. SCSI – CPU Cost Comparison to 3. 0. x : lower is better

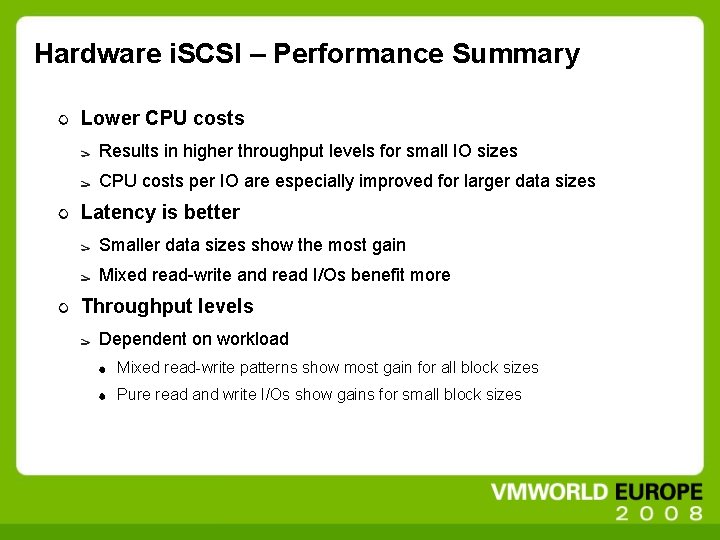
Hardware i. SCSI – Performance Summary Lower CPU costs Results in higher throughput levels for small IO sizes CPU costs per IO are especially improved for larger data sizes Latency is better Smaller data sizes show the most gain Mixed read-write and read I/Os benefit more Throughput levels Dependent on workload Mixed read-write patterns show most gain for all block sizes Pure read and write I/Os show gains for small block sizes

NFS – Performance Summary Performance also significantly improved in ESX 3. 5 Data now shown here for interest of time

Protocol Comparison Which storage option to choose? IP Storage vs. Fibre Channel How to read the charts? All data is presented as ratio to the corresponding 2 Gb FC (Fibre Channel) data If the ratio is 1, the FC and IP protocol data is identical; if < 1, FC data value is larger

Comparison with FC: Throughput if < 1, FC data value is larger

Comparison with FC: Latency lower is better

VMFS vs. RDM Which one has better performance? Data shown as ratio to RDM physical

VMFS vs. RDM-physical: Throughput higher is better

VMFS vs. RDM-physical: Latency lower is better

VMFS vs. RDM-physical: CPU Cost lower is better

Topics General Performance Data and Comparison Improvements in ESX 3. 5 over ESX 3. 0. x Performance Best Practices Troubleshooting Techniques Basic methodology Tools Case studies

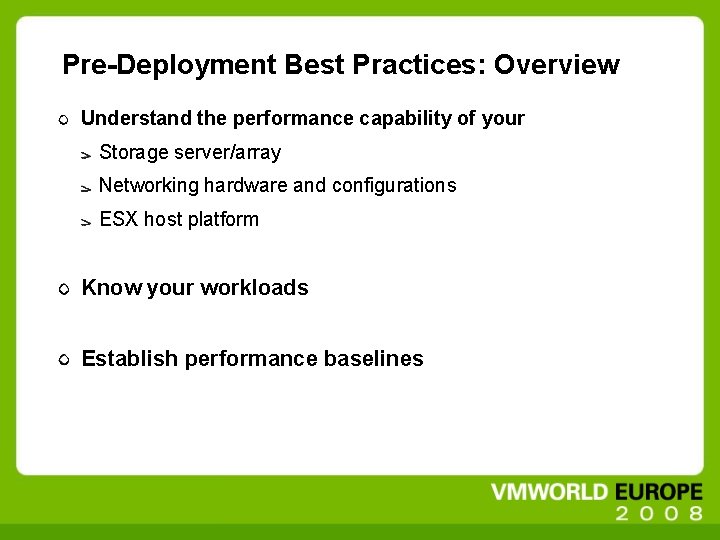
Pre-Deployment Best Practices: Overview Understand the performance capability of your Storage server/array Networking hardware and configurations ESX host platform Know your workloads Establish performance baselines

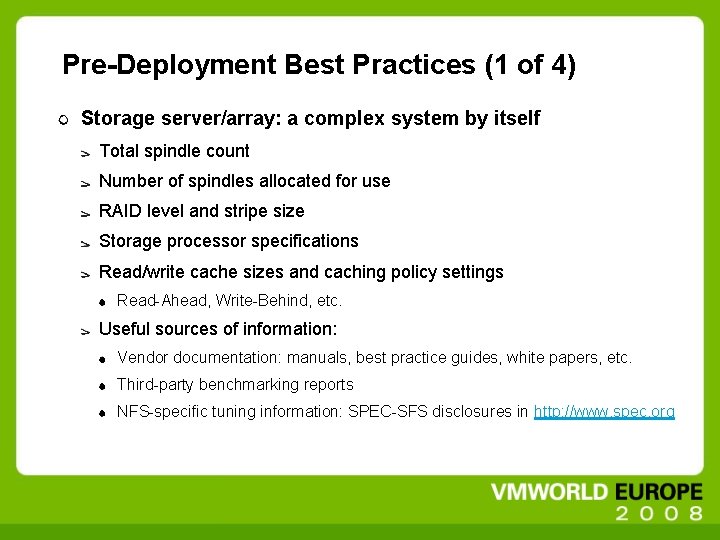
Pre-Deployment Best Practices (1 of 4) Storage server/array: a complex system by itself Total spindle count Number of spindles allocated for use RAID level and stripe size Storage processor specifications Read/write cache sizes and caching policy settings Read-Ahead, Write-Behind, etc. Useful sources of information: Vendor documentation: manuals, best practice guides, white papers, etc. Third-party benchmarking reports NFS-specific tuning information: SPEC-SFS disclosures in http: //www. spec. org

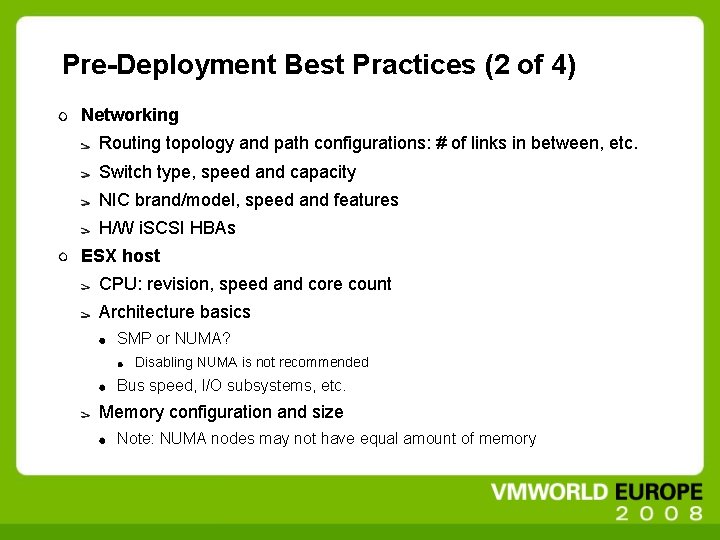
Pre-Deployment Best Practices (2 of 4) Networking Routing topology and path configurations: # of links in between, etc. Switch type, speed and capacity NIC brand/model, speed and features H/W i. SCSI HBAs ESX host CPU: revision, speed and core count Architecture basics SMP or NUMA? Disabling NUMA is not recommended Bus speed, I/O subsystems, etc. Memory configuration and size Note: NUMA nodes may not have equal amount of memory

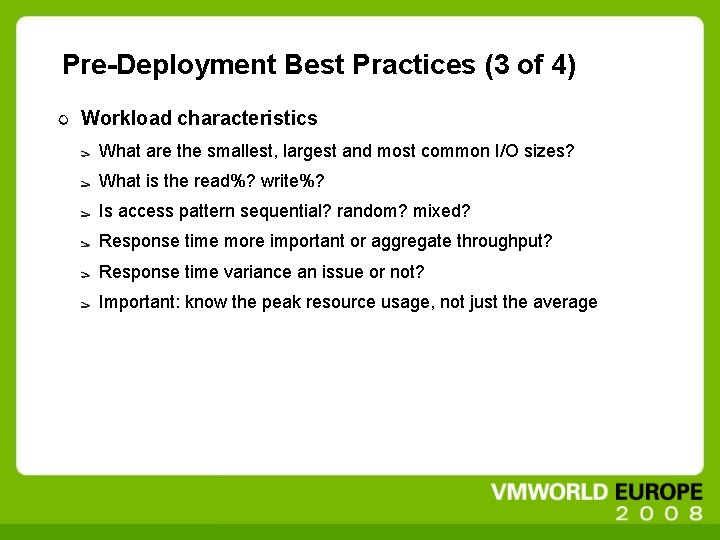
Pre-Deployment Best Practices (3 of 4) Workload characteristics What are the smallest, largest and most common I/O sizes? What is the read%? write%? Is access pattern sequential? random? mixed? Response time more important or aggregate throughput? Response time variance an issue or not? Important: know the peak resource usage, not just the average

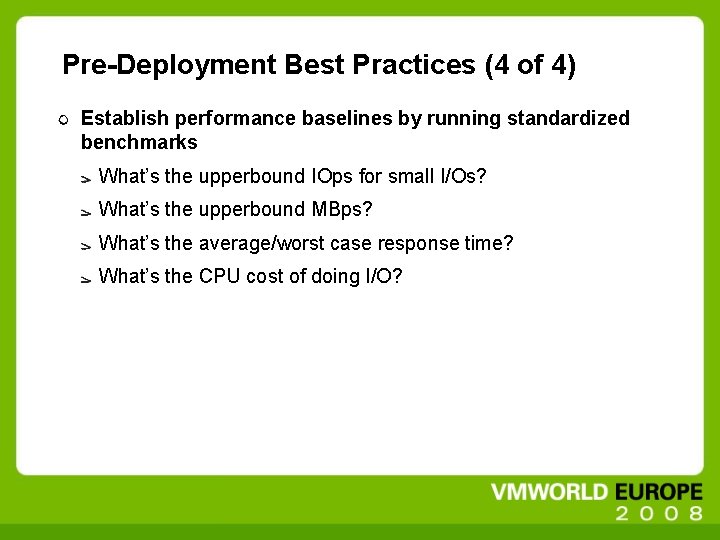
Pre-Deployment Best Practices (4 of 4) Establish performance baselines by running standardized benchmarks What’s the upperbound IOps for small I/Os? What’s the upperbound MBps? What’s the average/worst case response time? What’s the CPU cost of doing I/O?

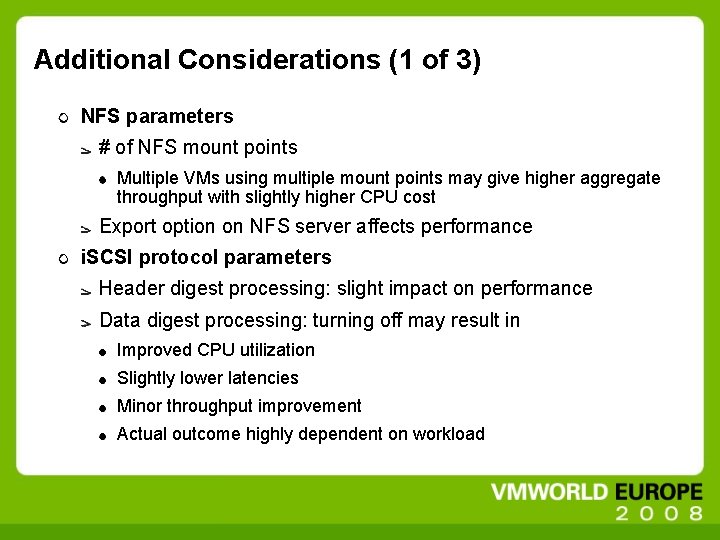
Additional Considerations (1 of 3) NFS parameters # of NFS mount points Multiple VMs using multiple mount points may give higher aggregate throughput with slightly higher CPU cost Export option on NFS server affects performance i. SCSI protocol parameters Header digest processing: slight impact on performance Data digest processing: turning off may result in Improved CPU utilization Slightly lower latencies Minor throughput improvement Actual outcome highly dependent on workload

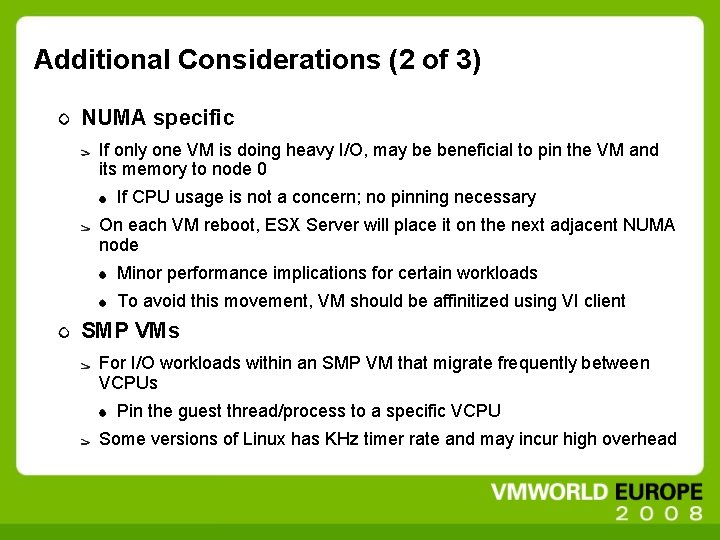
Additional Considerations (2 of 3) NUMA specific If only one VM is doing heavy I/O, may be beneficial to pin the VM and its memory to node 0 If CPU usage is not a concern; no pinning necessary On each VM reboot, ESX Server will place it on the next adjacent NUMA node Minor performance implications for certain workloads To avoid this movement, VM should be affinitized using VI client SMP VMs For I/O workloads within an SMP VM that migrate frequently between VCPUs Pin the guest thread/process to a specific VCPU Some versions of Linux has KHz timer rate and may incur high overhead

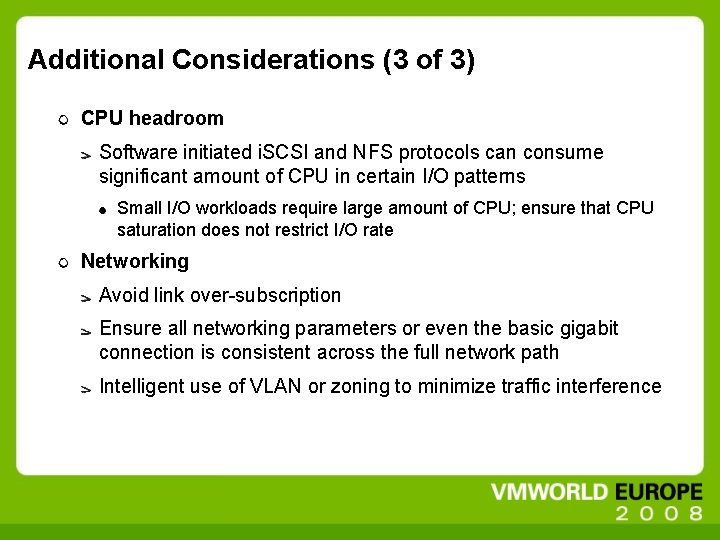
Additional Considerations (3 of 3) CPU headroom Software initiated i. SCSI and NFS protocols can consume significant amount of CPU in certain I/O patterns Small I/O workloads require large amount of CPU; ensure that CPU saturation does not restrict I/O rate Networking Avoid link over-subscription Ensure all networking parameters or even the basic gigabit connection is consistent across the full network path Intelligent use of VLAN or zoning to minimize traffic interference

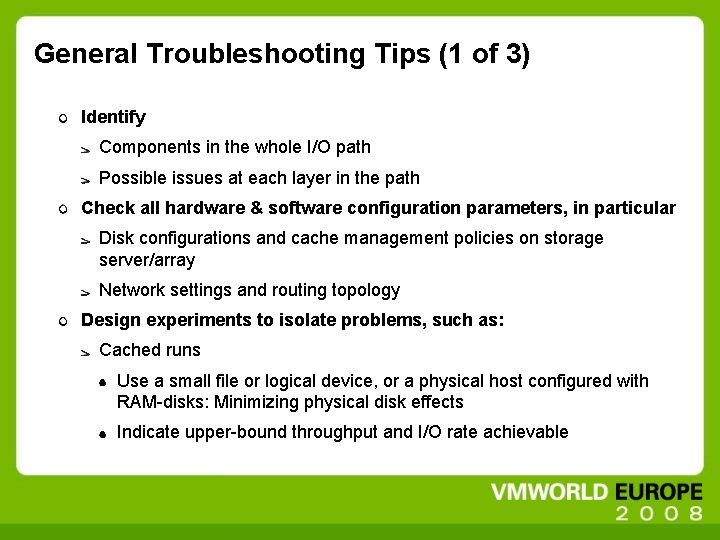
General Troubleshooting Tips (1 of 3) Identify Components in the whole I/O path Possible issues at each layer in the path Check all hardware & software configuration parameters, in particular Disk configurations and cache management policies on storage server/array Network settings and routing topology Design experiments to isolate problems, such as: Cached runs Use a small file or logical device, or a physical host configured with RAM-disks: Minimizing physical disk effects Indicate upper-bound throughput and I/O rate achievable

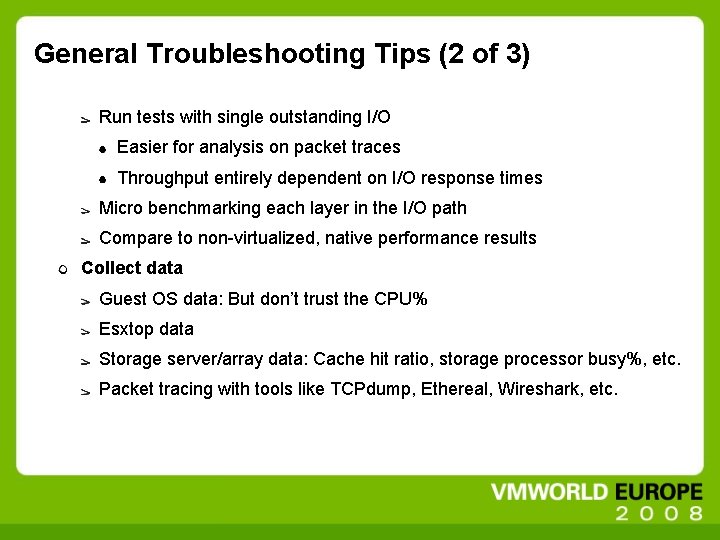
General Troubleshooting Tips (2 of 3) Run tests with single outstanding I/O Easier for analysis on packet traces Throughput entirely dependent on I/O response times Micro benchmarking each layer in the I/O path Compare to non-virtualized, native performance results Collect data Guest OS data: But don’t trust the CPU% Esxtop data Storage server/array data: Cache hit ratio, storage processor busy%, etc. Packet tracing with tools like TCPdump, Ethereal, Wireshark, etc.

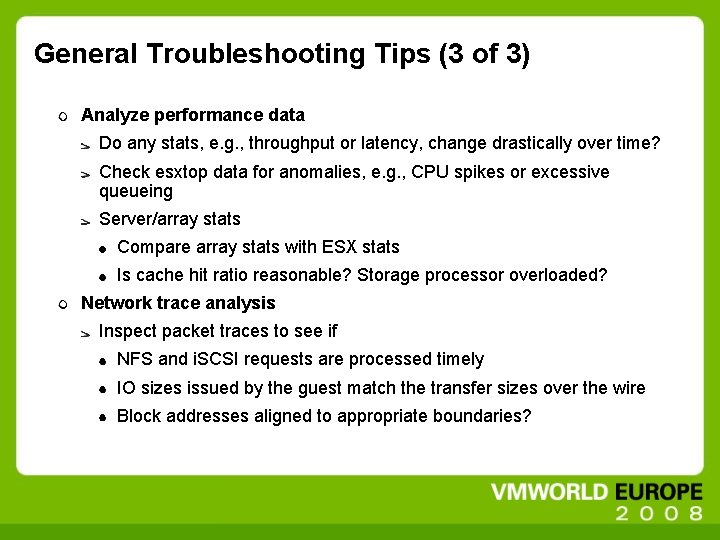
General Troubleshooting Tips (3 of 3) Analyze performance data Do any stats, e. g. , throughput or latency, change drastically over time? Check esxtop data for anomalies, e. g. , CPU spikes or excessive queueing Server/array stats Compare array stats with ESX stats Is cache hit ratio reasonable? Storage processor overloaded? Network trace analysis Inspect packet traces to see if NFS and i. SCSI requests are processed timely IO sizes issued by the guest match the transfer sizes over the wire Block addresses aligned to appropriate boundaries?

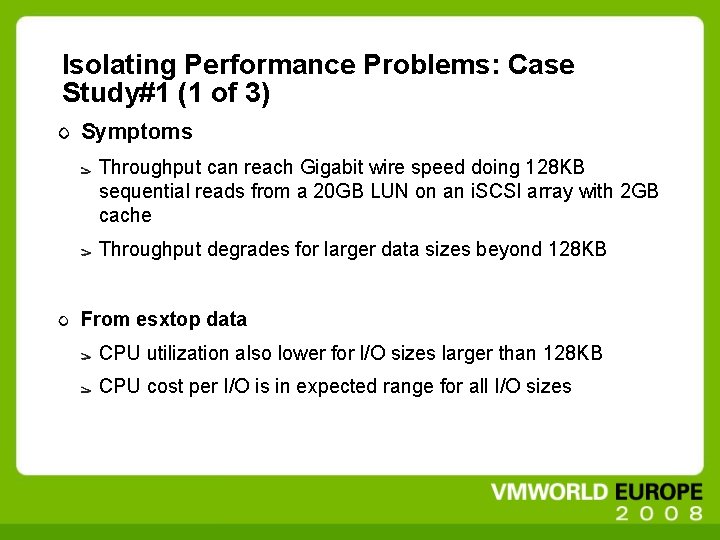
Isolating Performance Problems: Case Study#1 (1 of 3) Symptoms Throughput can reach Gigabit wire speed doing 128 KB sequential reads from a 20 GB LUN on an i. SCSI array with 2 GB cache Throughput degrades for larger data sizes beyond 128 KB From esxtop data CPU utilization also lower for l/O sizes larger than 128 KB CPU cost per I/O is in expected range for all I/O sizes

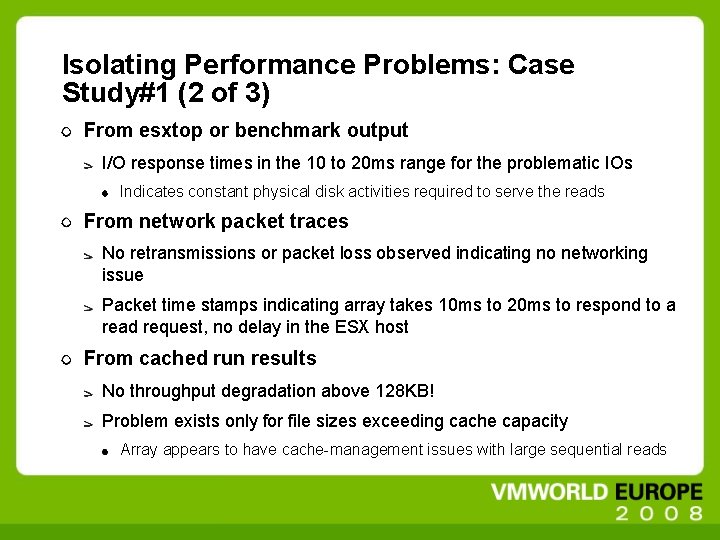
Isolating Performance Problems: Case Study#1 (2 of 3) From esxtop or benchmark output I/O response times in the 10 to 20 ms range for the problematic IOs Indicates constant physical disk activities required to serve the reads From network packet traces No retransmissions or packet loss observed indicating no networking issue Packet time stamps indicating array takes 10 ms to 20 ms to respond to a read request, no delay in the ESX host From cached run results No throughput degradation above 128 KB! Problem exists only for file sizes exceeding cache capacity Array appears to have cache-management issues with large sequential reads

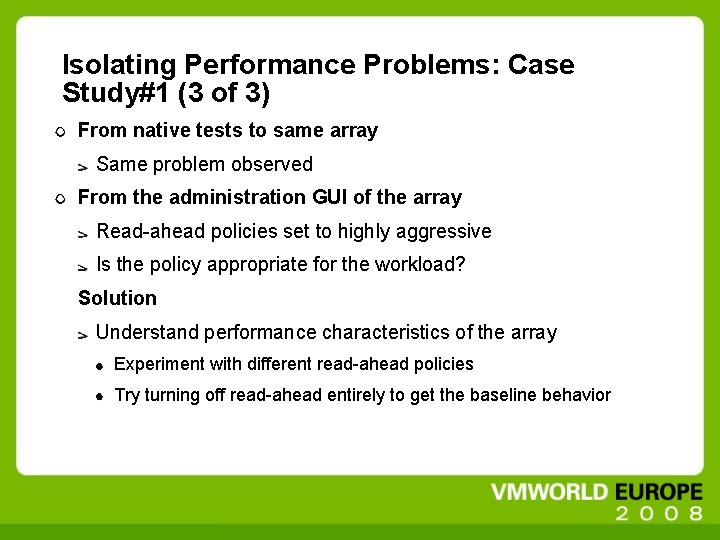
Isolating Performance Problems: Case Study#1 (3 of 3) From native tests to same array Same problem observed From the administration GUI of the array Read-ahead policies set to highly aggressive Is the policy appropriate for the workload? Solution Understand performance characteristics of the array Experiment with different read-ahead policies Try turning off read-ahead entirely to get the baseline behavior

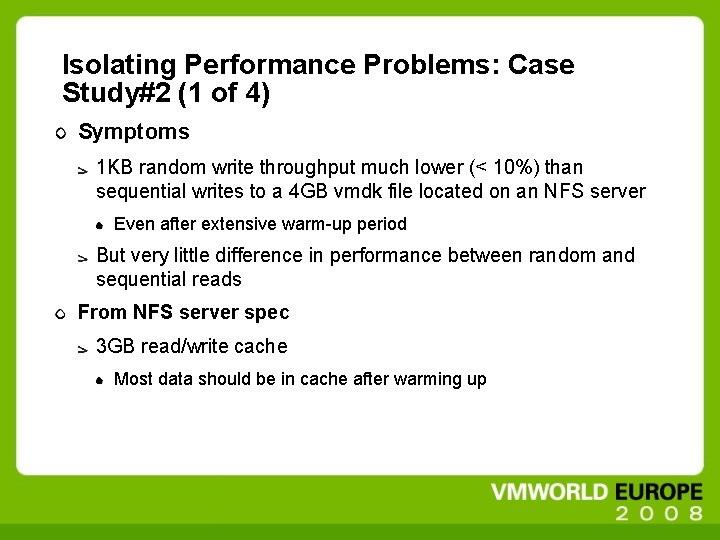
Isolating Performance Problems: Case Study#2 (1 of 4) Symptoms 1 KB random write throughput much lower (< 10%) than sequential writes to a 4 GB vmdk file located on an NFS server Even after extensive warm-up period But very little difference in performance between random and sequential reads From NFS server spec 3 GB read/write cache Most data should be in cache after warming up

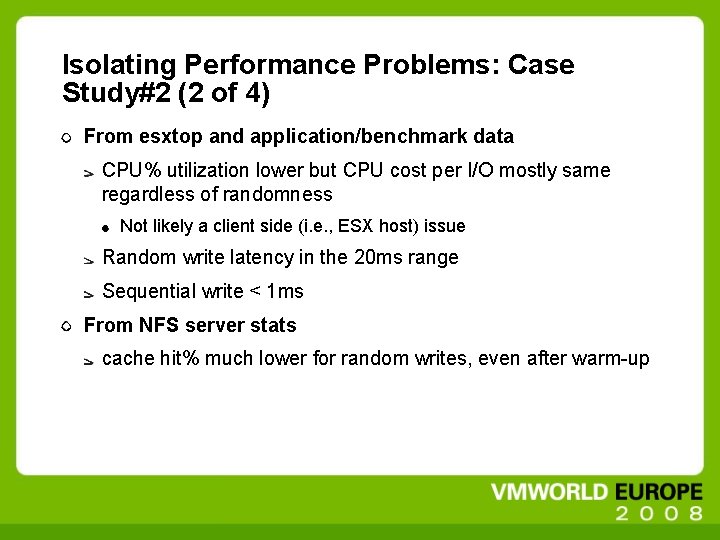
Isolating Performance Problems: Case Study#2 (2 of 4) From esxtop and application/benchmark data CPU% utilization lower but CPU cost per I/O mostly same regardless of randomness Not likely a client side (i. e. , ESX host) issue Random write latency in the 20 ms range Sequential write < 1 ms From NFS server stats cache hit% much lower for random writes, even after warm-up

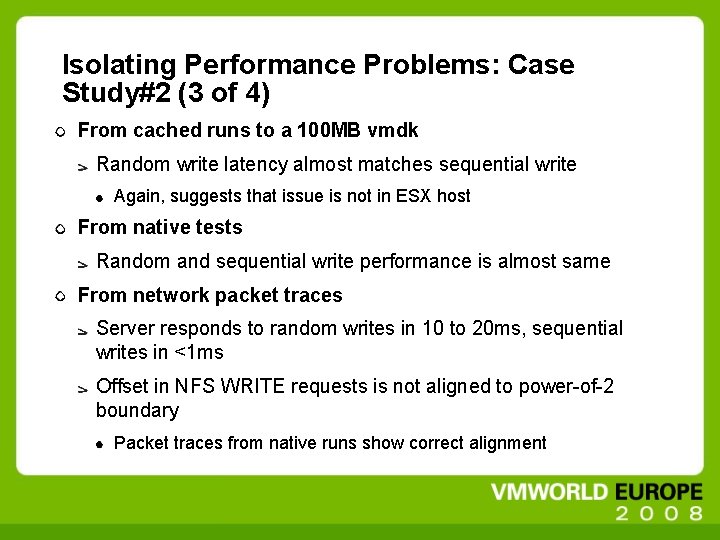
Isolating Performance Problems: Case Study#2 (3 of 4) From cached runs to a 100 MB vmdk Random write latency almost matches sequential write Again, suggests that issue is not in ESX host From native tests Random and sequential write performance is almost same From network packet traces Server responds to random writes in 10 to 20 ms, sequential writes in <1 ms Offset in NFS WRITE requests is not aligned to power-of-2 boundary Packet traces from native runs show correct alignment

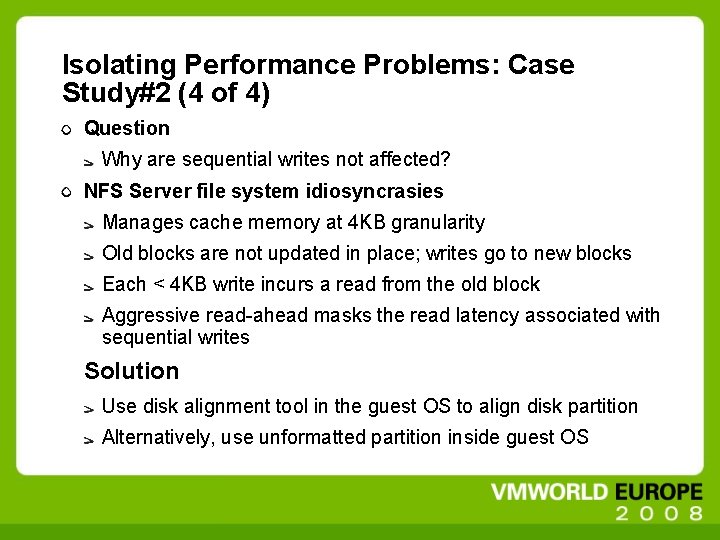
Isolating Performance Problems: Case Study#2 (4 of 4) Question Why are sequential writes not affected? NFS Server file system idiosyncrasies Manages cache memory at 4 KB granularity Old blocks are not updated in place; writes go to new blocks Each < 4 KB write incurs a read from the old block Aggressive read-ahead masks the read latency associated with sequential writes Solution Use disk alignment tool in the guest OS to align disk partition Alternatively, use unformatted partition inside guest OS

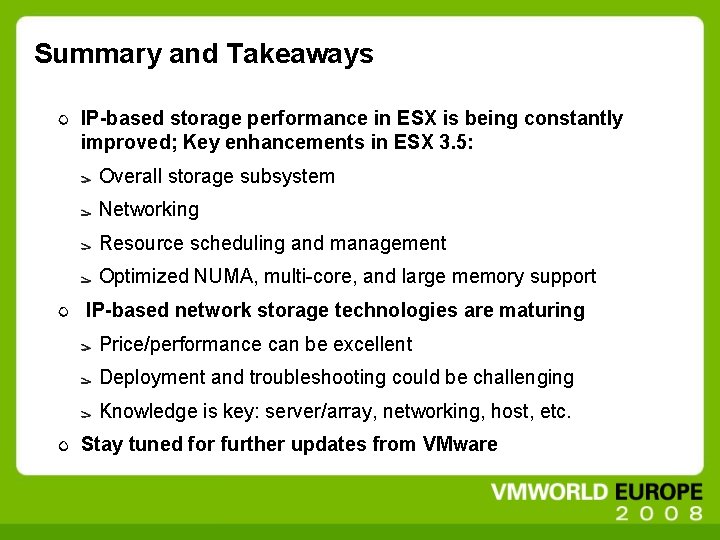
Summary and Takeaways IP-based storage performance in ESX is being constantly improved; Key enhancements in ESX 3. 5: Overall storage subsystem Networking Resource scheduling and management Optimized NUMA, multi-core, and large memory support IP-based network storage technologies are maturing Price/performance can be excellent Deployment and troubleshooting could be challenging Knowledge is key: server/array, networking, host, etc. Stay tuned for further updates from VMware

Questions? NFS & i. SCSI – Performance Characterization and Best Practices in ESX 3. 5 Priti Mishra & Bing Tsai VMware
