AORTIC STENOSIS AORTIC STENOSIS Bicuspid valve Degenerative calcific

AORTIC STENOSIS

AORTIC STENOSIS Bicuspid valve Degenerative calcific valve Rheumatic valve
 • normal - 3. 0 – 4. 0")
AORTIC STENOSIS Valve area (cm 2) • normal - 3. 0 – 4. 0 • mild AS - 1. 5 – 2. 0 • moderate AS - 1. 0 – 1. 5 • severe AS - < 1. 0 ( < 0. 6 cm 2 / m 2 ) • critical AS - < 0. 75 ( < 0. 5 cm 2 / m 2 )
 Area - decrease by 0. 12")
AORTIC STENOSIS Rate of progression ( annual ) Area - decrease by 0. 12 cm 2 Jet velocity - increase by 0. 32 m / sec Mean gradient - increase by 7 mm Hg

AORTIC STENOSIS Clinical Remain asymptomatic for long Severe AS • exertional angina , syncope / presyncope • dyspnea • low volume, slow rising pulse – parvus et tardus • narrow pulse pressure • prominent A in JVP (Bernheim effect) • heaving apex • LV S 4 , delayed A 2 • long MSM with late peaking • LV strain pattern in ECG

AORTIC STENOSIS
 … minimal area by planimetry Effective orifice area")
AORTIC STENOSIS Geometric orifice area (GOA) … minimal area by planimetry Effective orifice area (EOA) …. by continuity equation corresponds to venacontracta

AORTIC STENOSIS Hemodynamics

AORTIC STENOSIS Pressure recovery Peak gradient by Doppler
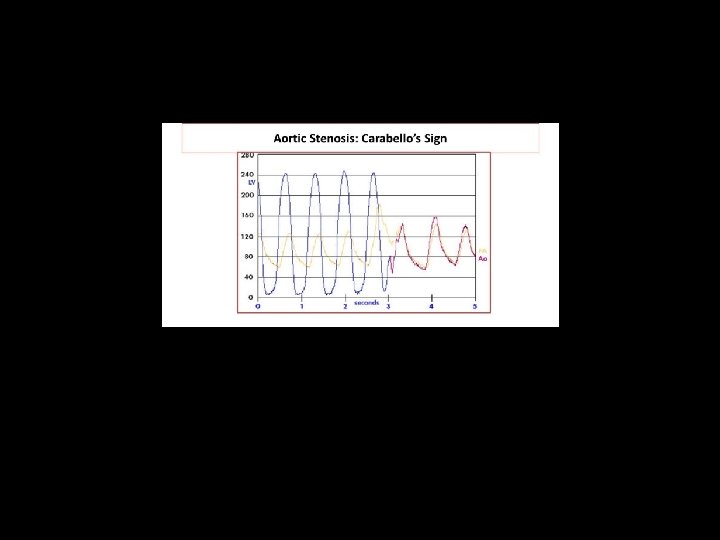

Cath Echo Mean gradient

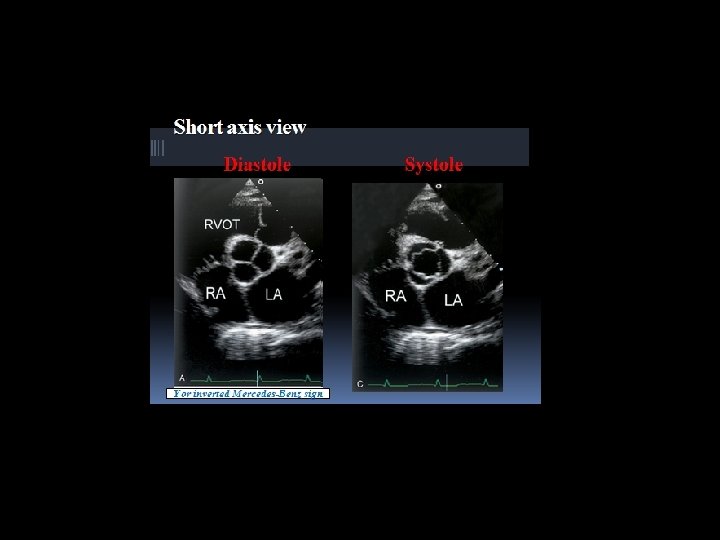
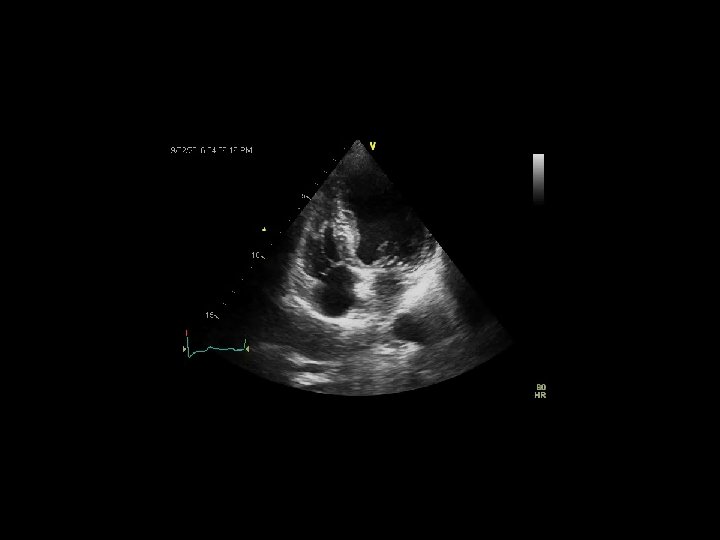
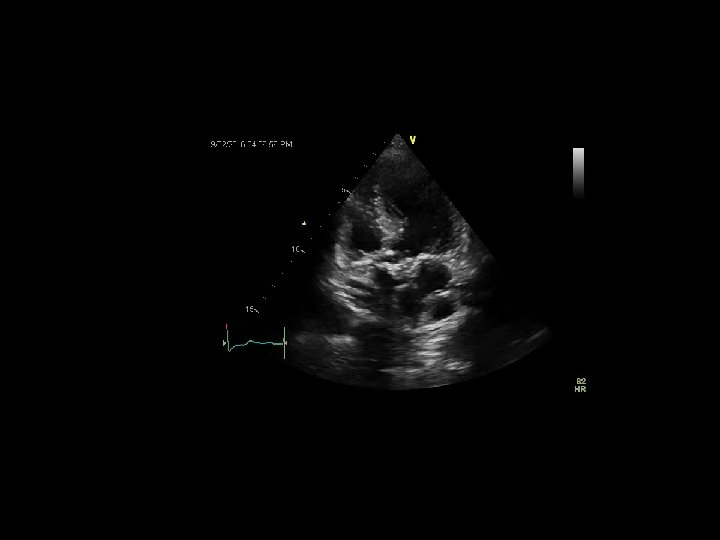
AORTIC STENOSIS Echocardiography 1. Anatomy - short & long axis views (occasionally TEE / 3 D) 2. LVOT diameter – midsystole ; at the site of measurement of LVOT velocity measurement parallel to AV 3. LVOT velocity - apical 4 C / 5 C ; V max / VTI 4. AS jet velocity (CW) – V max; peak and mean gr; VTI 5. SVI 6. DSE ( SOS)

AORTIC STENOSIS Primary data • AS jet velocity – V max • mean gradient • valve area Continuity equation Planimetry. . TTE / TEE / 3 D • flow. . SVI Gradient …. Diagnostic value Flow ………. Prognostic value

AORTIC STENOSIS Continuity equation Flow across LVOT and aortic valve is same Flow = area x VTI A LVOT x VTI LVOT = A AV x VTI AV AAV = A LVOT x VTI LVOT VTI AV A 1 x V 1_ V 2
 Very simple method Variable of area is")
AORTIC STENOSIS Dimensionless valve index (velocity ratio) Very simple method Variable of area is taken away from the continuity equation LVOT velocity Aortic valve velocity Value < 0. 25. . Severe AS

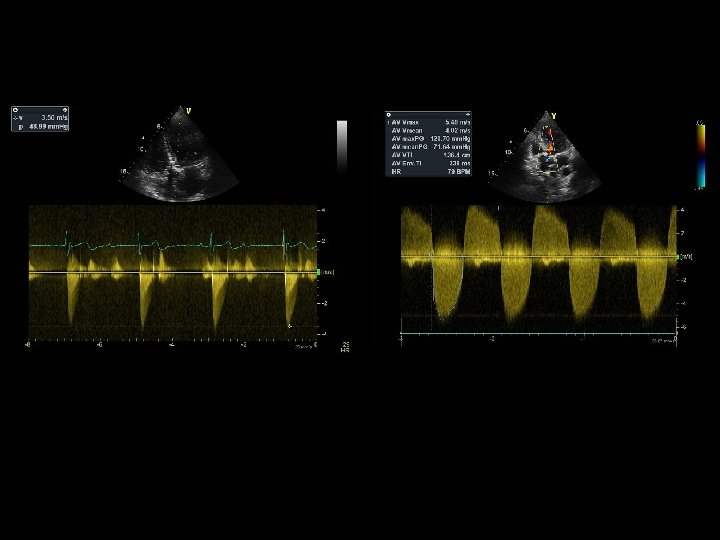
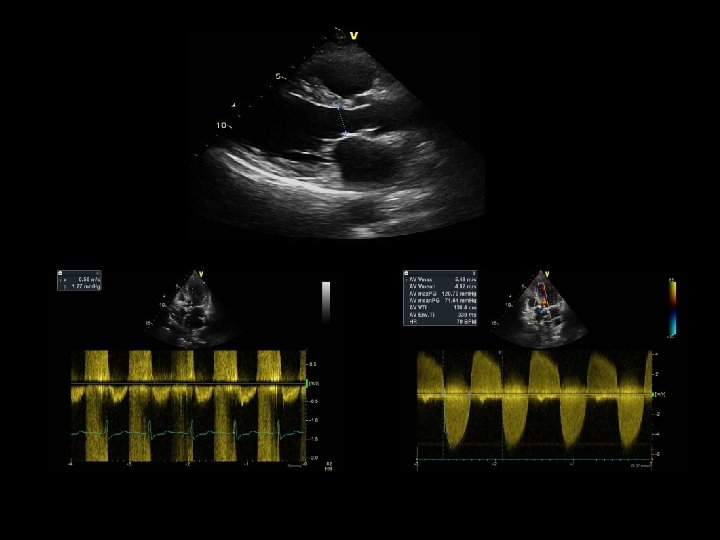
SEVERE AS Mean gradient = 71 mm Hg Dimensionless index = 0. 5 / 5. 5 = 0. 1

V 1 = 1. 5 m /sec V 2 = 4 m / sec DI = 1. 5 / 4 = 0. 375

AORTIC STENOSIS Severity Parameters sclerosis mild AS moderate severe Vmax. . m/sec < 2. 5 2. 6 – 2. 9 3. 0 – 3. 9 ≥ 4. 0 MPG mm Hg -- < 20 20 – 39 ≥ 40 AVA cm 2 -- > 1. 5 1. 0 – 1. 5 < 1. 0 AVAI cm 2 / m 2 -- > 0. 85 0. 6 – 0. 85 < 0. 6 Dimensionless index -- > 0. 5 0. 25 – 0. 5 < 0. 25
 Valvular resistance")
AORTIC STENOSIS Global LV hemodynamic load Valvuloarterial impedance ( Z va ) Valvular resistance + vascular resistance Mean gradient Zva = SBP + mean gradient Stroke volume index > 4. 5 … severe AS SBP

AORTIC STENOSIS Dobutamine stress echo • change in mean gradient • change in valve area • change in SVI Exercise test in severe “asymptomatic” AS • effort tolerance , symptoms • BP response • increase in mean gradient BNP. . Limitations + ; > 500 pg / ml …poor prognosis

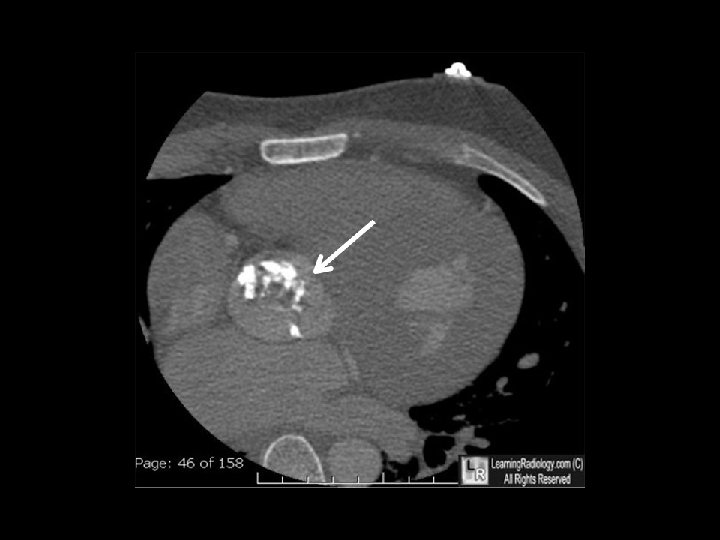
AORTIC STENOSIS CT • best method to assess annulus, aorta and calcium • assess GOA • assess coronaries • severity of AS. . < 700 AU. . excludes severe AS > 2000 AU. . severe AS > 1650. . optimal sensitivity & specificity • evaluation of prosthetic valve • planning TAVR CMR • assess myocardial fibrosis

AORTIC STENOSIS Terminologies Low flow gradient severe AS Paradoxical low flow AS Pseudosevere AS

AORTIC STENOSIS Low flow gradient AS Valve area < 1. 0 cm 2 Mean gr. < 40 mm Hg SVI < 35 ml / m 2 ? Possibilities EF < 50 % EF > 50 % • severe AS with reversible LV dysfunction • AS with severe myocardial failure • pseudo severe AS • paradoxical low flow severe AS (EF > 50 %)

AORTIC STENOSIS Physiologic discrepancies 1. V max > 4. 0 m /sec Mean gr. > 40 mm Hg Valve area > 1. 0 cm 2 associated AR high output states Large BSA … calculate AVAI 2. Valve area < 1. 0 cm 2 ; normal flow ; low gradient Gradient under assessed due to hypertension Prolonged LVET ; reduced flow rate > lower Vmax Moderate AS ; small body size ; AVA index - > 0. 6 cm 2
 mean gr. (mm Hg) SVI change (")
AORTIC STENOSIS DSE Valve area (cm 2) mean gr. (mm Hg) SVI change ( %) assessment < 1. 0 > 40 > 20 severe AS myocardium OK < 1. 0 < 40 < 20 myocardial failure ↑ by > 0. 3 no change > 20 pseudo severe AS
 1/3 rd")
AORTIC STENOSIS Paradoxical low flow severe AS ( Hachicha et al 2007) 1/3 rd of cases ; poor surgical outcome Severe true AS … area < 1. 0 cm 2 Low flow … SVI < 35 ml / m 2 Preserved EF. . > 50 % 1. Impaired LVEDV • severe LVH • AF , tachycardia • MS , MR, PAH, TR 2. Impaired LV longitudinal strain
 Vmax (m/sec)")
Stages of valvular AS Stage type A at risk of AS (BAV) Vmax (m/sec) <2 B progressive AS C. Asymptomatic severe AS mean gr (mm Hg) -2. 0 – 3. 9 ≥ 4. 0 ≥ 40 EF other data N upto 39 N ( C 1) -N valve area > 1. 0 valve area < 1. 0 < 50 % (C 2) D Symptomatic severe AS (valve area < 1. 0) D 1 (high gr) ≥ 4. 0 ≥ 40 N D 2 (low flow gr) < 4. 0 < 40 < 50 D 3 (paradoxical low flow gr) < 4. 0 DSE. . gr > 40 SVI > 35 < 40 > 50 DSE. . SVI < 35

AORTIC STENOSIS Surgery Class I • symptomatic severe AS. . Stage D 1 • asymptomatic severe AS ; EF < 50 %. . C 2 • asymptomatic severe AS + other cardiac surgery Class II a • very severe AS ( Vmax > 5 m/sec ; mean gr. 60 mm. Hg) abnormal ETT • low flow gradient AS with contractile reserve on DSE • pseudo low flow severe AS Class II b • asymptomatic severe AS with rapid progression V max > 0. 3 m / s / year
 AVA Vmax MPG EF SVI")
AS. . (Vmax, mean gr. , AVA, LVEF, SVI) AVA Vmax MPG EF SVI < 1. 0 > 40 > 50 > 35 Normal flow high gr. < 1. 0 < 40 > 50 < 35 < 1. 0 < 40 < 50 < 35 paradoxical low flow low gr Vs pseudo severe AS DSE symptomatic ? contractile reserve present AVR MPG > 40 AVA < 1. 0 absent AVA increase by > 0. 3 OMT pseudo severe AS
- Slides: 36