
Any Member of the Family Deserves the Best

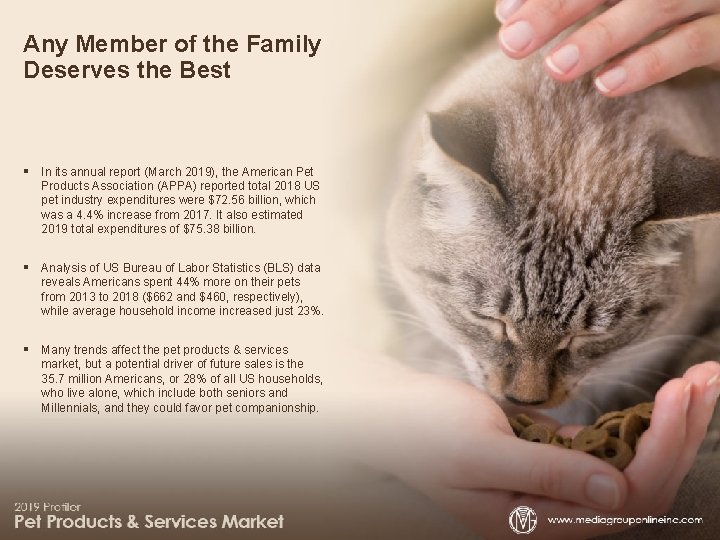
Any Member of the Family Deserves the Best § In its annual report (March 2019), the American Pet Products Association (APPA) reported total 2018 US pet industry expenditures were $72. 56 billion, which was a 4. 4% increase from 2017. It also estimated 2019 total expenditures of $75. 38 billion. § Analysis of US Bureau of Labor Statistics (BLS) data reveals Americans spent 44% more on their pets from 2013 to 2018 ($662 and $460, respectively), while average household income increased just 23%. § Many trends affect the pet products & services market, but a potential driver of future sales is the 35. 7 million Americans, or 28% of all US households, who live alone, which include both seniors and Millennials, and they could favor pet companionship.
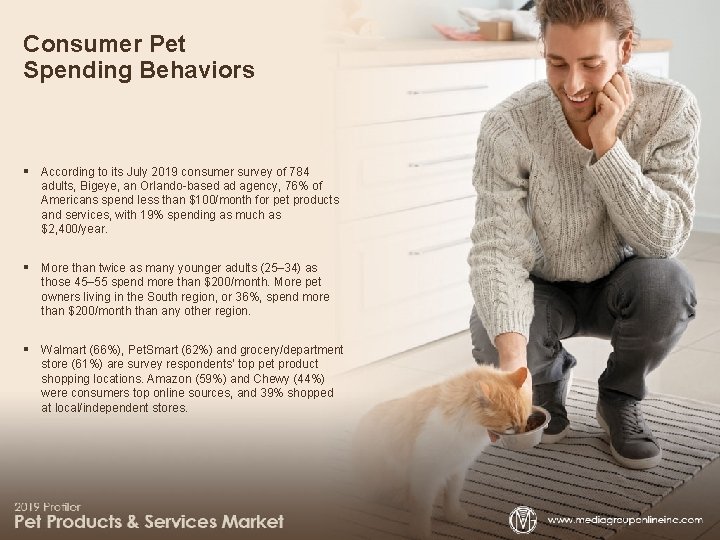
Consumer Pet Spending Behaviors § According to its July 2019 consumer survey of 784 adults, Bigeye, an Orlando-based ad agency, 76% of Americans spend less than $100/month for pet products and services, with 19% spending as much as $2, 400/year. § More than twice as many younger adults (25– 34) as those 45– 55 spend more than $200/month. More pet owners living in the South region, or 36%, spend more than $200/month than any other region. § Walmart (66%), Pet. Smart (62%) and grocery/department store (61%) are survey respondents’ top pet product shopping locations. Amazon (59%) and Chewy (44%) were consumers top online sources, and 39% shopped at local/independent stores.
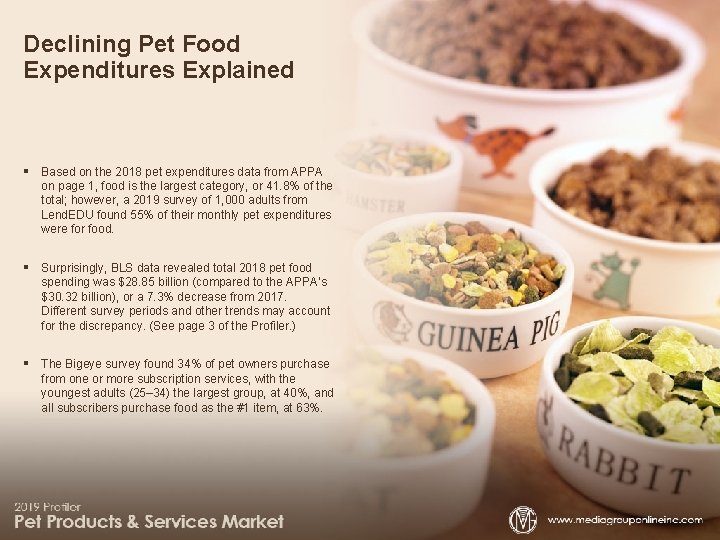
Declining Pet Food Expenditures Explained § Based on the 2018 pet expenditures data from APPA on page 1, food is the largest category, or 41. 8% of the total; however, a 2019 survey of 1, 000 adults from Lend. EDU found 55% of their monthly pet expenditures were for food. § Surprisingly, BLS data revealed total 2018 pet food spending was $28. 85 billion (compared to the APPA’s $30. 32 billion), or a 7. 3% decrease from 2017. Different survey periods and other trends may account for the discrepancy. (See page 3 of the Profiler. ) § The Bigeye survey found 34% of pet owners purchase from one or more subscription services, with the youngest adults (25– 34) the largest group, at 40%, and all subscribers purchase food as the #1 item, at 63%.
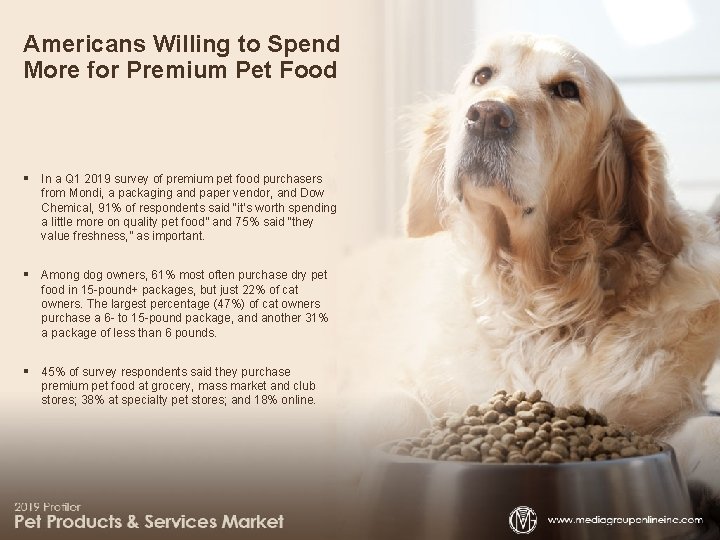
Americans Willing to Spend More for Premium Pet Food § In a Q 1 2019 survey of premium pet food purchasers from Mondi, a packaging and paper vendor, and Dow Chemical, 91% of respondents said “it’s worth spending a little more on quality pet food” and 75% said “they value freshness, ” as important. § Among dog owners, 61% most often purchase dry pet food in 15 -pound+ packages, but just 22% of cat owners. The largest percentage (47%) of cat owners purchase a 6 - to 15 -pound package, and another 31% a package of less than 6 pounds. § 45% of survey respondents said they purchase premium pet food at grocery, mass market and club stores; 38% at specialty pet stores; and 18% online.
Expenses Beyond Pet Food § The Bigeye survey found just 25% of pet owners have pet insurance. The findings of the Lend. EDU survey support this low percentage as only 56% of the pet owners it surveyed were aware of pet insurance, with 39% thinking it unnecessary and 40% too costly. § The Lend. EDU survey also revealed 24% of consumers had to rely on credit card or personal loan debt, to an average of $1, 566. 96, because of health/veterinarian costs and 8% have delayed their marriage, and 11% having children because of pet expenses. § One-third of pet owners in Northeastern states utilize pet walking services compared to just 13% in Midwest states. The vast majority (86%) of pet owners spend less than $1, 000/year for pet medical care, with 45% giving their pets vitamins or supplements.
Other Important Pet Market Factors § An FDA warning linking some dog food brands to a significant heart condition may be one of the reasons for the decrease in pet food sales cited on page 2 of the Profiler. Another may be Millennials’ financial straits, causing them to buy lower-priced pet foods. § According to 2018 Nielsen data, pet-products consumers who shop online and in-store spend 200% more yearly as those consumers who don’t. Pet shoppers also make 9% more shopping trips. § The Bigeye survey found coupon sale or discount, at 21%, and nutritional benefit claims, at 20%, are the top two factors that influence what Americans feed their pets.
Advertising Strategies § TV can be an advantageous advertising medium for many pet products & services retailers to reach the increasing number of older Americans living alone who are a ready market for pet companionship. § Local/independent pet retailers still retain 40% of total pet owner spending, but to maintain that share and increase it, they must offer unique products and services and emphasize their local knowledge and experience unavailable from online sources. § Because many pet owners are willing to spend more for premium pet food, local/independent retailers can market themselves as a premium pet food expert, feature a premium pet food display and possibly offer a monthly subscription service.
New Media Strategies § Although veterinarians (and rightly so) are pet owners #1 source for pet food recommendations, reviews is #3. Local retailers have an opportunity to encourage reviews and respond both to positive and negative reviews almost daily to increase their exposure. § Local retailers may want to partner with a local insurance agency that offers pet insurance and jointly post content to social media, especially short videos, promoting the value, how much debt people incur because they don’t have insurance and other topics. § Although the nutritional value of pet food is a major factor for pet owners when choosing food for their pets, coupons and discounts influence their choices even more. Initiating a regular text messaging campaign, especially with younger adults, could maximize sales.

- Slides: 10