Anthropometrics and assessment of energy expenditure Liz Hudson

")
 and Usual Body Weight (UBW) • Include these measures in")


 BMI >=40 35 -39. 9 30 -34. 9 25 -29.")


 • Validity depends on measurement technique and repetition")


, may also be presented")


")
 + 6.")


 • 15 -18 kcal/kg (obese/overweight)")

 • RMR = Mifflin(0.")
 • Estimated energy expenditure • Ventilator-dependent")

")


- Slides: 40
Anthropometrics and assessment of energy expenditure Liz Hudson MPH, RD September, 26 th 2016
Anthropometric data • Height • Weight • BMI • Ideal Body Weight (BMI)
Ideal Body weight (IBW) and Usual Body Weight (UBW) • Include these measures in every assessment, % of IBW and/or UBW provides important clinical information and can be part of criteria to diagnose malnutrition • Usual body weight is more useful in those who are ill • IBW Men: 106 lbs for first 5 feet of height + 6 lbs for every inch over 5 feet; for males under 5 feet in height, start with 106 lbs and subtract 6 lbs for every inch below 5 feet • IBW Women: 100 lbs for first 5 feet of height and plus 5 lbs for every inch thereafter; for women under 5 ft, start with 100 lbs and subtract 5 lbs for every inch under 5 ft
Example • Calculate the IBW of a man that is 190. 5 cm tall (height and weight in electronic medical records are most often in the metric scale) • Step 1. Convert 190. 5 cm to inches there are 2. 54 cm per inch, 190. 5 /2. 54 = 75 inches. • Step 2: How many inches over 5 ft is that? There are 12 inches per foot. 5 x 12 = 72 inches. 75 -60 = 15 (this man is 6 ft 3 inches) • Step 3: Plug into formula 106 lbs + (6 lbs x 15 inches) = 106+90 = 196 lbs. Report in kg 196/2. 2 = 89. 1 kg • IBW for a man 6 ft, 3 inches = 89. 1 kg
Note on adjusted body weight • Use in the past was common for obese patients • Rationale is that fat is less metabolically active than lean tissue; thus using actual body weight in an obese person will overestimate energy needs • However, studies have shown that in very overweight persons, calculating HBE using the adjusted wt tends to make calculations less accurate; underestimating total energy needs
Body Mass Index (BMI) BMI >=40 35 -39. 9 30 -34. 9 25 -29. 9 18. 5 -24. 9 <18. 5 17 -18. 4 16 -16. 9 <16 Classification Obesity grade III (morbid obesity) Obesity grade II Obesity grade I Overweight Normal Underweight Mild thinness Moderate thinness Severe thinness
BMI • Metric: BMI = Weight in kg / Height in meters ^2 • English: BMI = Weight (lbs) / Height in inches^2 x 703 • Does not measure body fat directly • Most researches and health practitioners think that it provides an acceptable estimation of body fat • What do you guys think? • BMI should be measured in conjunction with other information related to the patient’s health status
Weight Status as a Predictor of Morbidity and Mortality • In young to middle aged adults, morbidity/ mortality is highest in the highest quintile of BMI • In the elderly, morbidity/mortality is highest in the lowest quintile of BMI • In most populations, there is a U-shaped relationship between mortality and BMI
Body Composition: Skinfold thickness (subcutaneous fat) • Validity depends on measurement technique and repetition over time • Changes take 3 to 4 weeks • Accuracy decreases with increasing obesity • Skinfold sites most reflective of body fatness are over the triceps and the biceps, below the scapula, suprailiac, and upper thigh
Body Composition: circumference measurements • Waist circumference: smallest area below the ribcage and above the umbilicus; measurements >40 for men and >35 for women are risk factors for disease • Mid arm circumference (MAC) in combination with TSF can determine arm muscle area (lean body mass)
Body Composition: Other measurements – refer to book • Underwater weighing • Total body potassium • Neutron activation analysis • BIA: fat free mass and fat mass • CT: subcutaneous and intra-abdominal fat • MRI: size of skeleton and internal organs; abdominal fat • DEXA: dual-energy x-ray absorptiometry; bone mineral density and fat and boneless lean tissue
Nutrition focused physical exam • Four basic physical examination techniques utilized • Inspection • Palpation • Percussion • Auscultation • Recommend refer to appendix 29 for further detail
Energy Expenditure: Predictive Equations • Objectives: • Compare/contrast predictive equations used to calculate energy requirements • Discuss the strengths and limitations of various predictive equations used in clinical practice • BRIEFLY Describe the role of indirect calorimetry (IC) in assessing energy expenditure
Review of Terminology Use This! • Basal metabolic rate (BMR), may also be presented as Basal energy expenditure (BEE): minimum amount of energy expended that is compatible with life • Resting metabolic rate (RMR) or Resting Energy Expenditure (REE): energy expended in the activities necessary to sustain normal body functions now used in place of BEE, tends to be 10 -20% higher than BEE • Estimated energy expenditure (EEE): Often used interchangeably with REE • Thermic Effect of Food (TEF): increase in energy expenditure associated with consumption, digestion, and absorption of food • Total energy expenditure (TEE): REE + TEF + activity expenditure = TEE
Factors affecting REE • Age: REE highly affected by proportion of lean body mass, which often decreases with increased age • Body composition: people with higher percentage of lean body mass will have higher resting metabolism • Body size • Climate: REE can be affected by living in extreme temps • Gender • Hormonal Status: hormones affect metabolic rate • Body temperature: fever increases REE • Other: i. e caffeine, nicotine, alcohol can stimulate REE
Thermic Effect of Food • Presence, magnitude, duration influenced by: • • • Size of the meal Ratio of protein, carbohydrate, and fat Fiber content Time of day the meal is eaten Degree of psychological stress Age
Thermic Effect of Food • Thermic effect of digestion results in a 5 -10% increase in RMR • • Greater with larger meal Peaks at 60 -180 minutes Longer in obese patients Longer in older patients
Predictive Equations • So many choices….
Harris-Benedict Equation • Basal energy expenditure • Men: BEE= 66. 47 + 13. 75(W) + 5(H) – 6. 75(A) • Women: BEE = 655. 09+9. 56(W)+1. 85(H)– 4. 68(A) • Activity factors • Stress/injury factors W=weight in kg; H=height in cm; A=age in years
Mifflin-St. Jeor Equation • Resting metabolic rate • Men: RMR = 10(W) + 6. 25(H) – 5(A) + 5 • Women: RMR = 10(W) + 6. 25(H) – 5(A) -161 • Activity factors • Stress/injury factors • TEE = REE x AF (study or population-specific activity factor) W=actual weight in kg; H=height in cm; A=age in years
Mifflin St. Jeor Equation • Best validated of predictive equations in estimating REE in healthy patients • Like HBE, studies were done in healthy patients, so stress factors must be applied if used in medical or surgical patients
• Activity factors • Sedentary: 1 -1. 39 • Low active: 1. 4 -1. 59 • Active: 1. 6 -1. 89 • Very Active: 1. 9 -2. 5 • • Injury factors Surgery: Minor: 1. 0– 1. 2 Major: 1. 1– 1. 3 Skeletal trauma: 1. 1– 1. 6 Head trauma: 1. 6– 1. 8 Infection: • Mild: 1. 0– 1. 2 • Moderate: 1. 2– 1. 4 • Severe: 1. 4– 1. 8 • Burns (% body surface area [BSA]): • <20% BSA: 1. 2– 1. 5 • 20%– 40% BSA: 1. 5– 1. 8 • >40% BSA: 1. 8– 2. 0
Simplistic Weight-Based Equations • 11 -14 kcal/kg (morbid obesity) • 15 -18 kcal/kg (obese/overweight) • 22 -25 kcal/kg (normal, healthy weight) • 25 -30 kcal/kg (underweight, or have increased needs) • 30 -35 kcal/kg (underweight, higher degree of increased needs, hematologic malignancy) • 40+ kcal/kg (increased needs, weight gain)
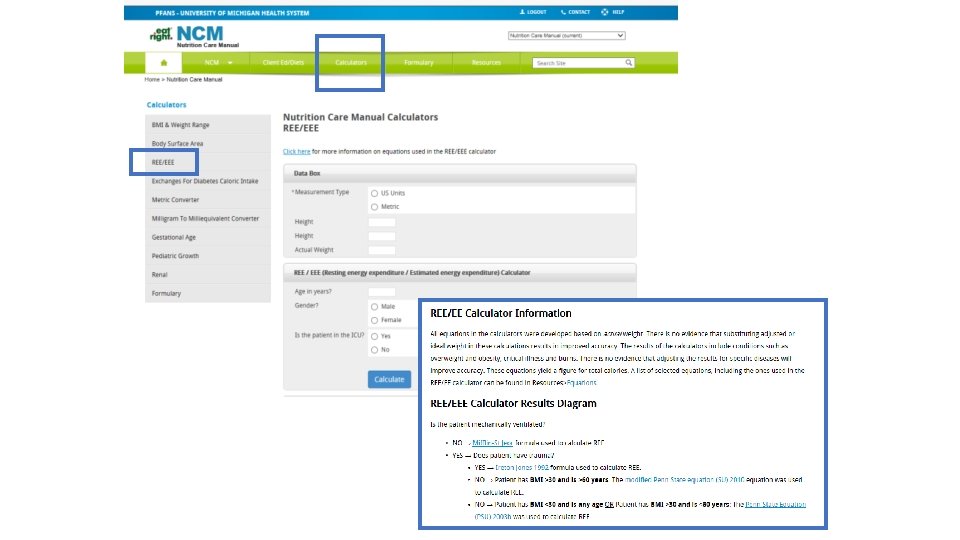
Using Predictive Equations to Estimate Energy Requirements Is the patient Critically Ill? Yes. Is the patient obese? Is a hypocaloric regimen appropriate? Yes 22 -25 kcal/kg IBW or 11 -14 kcal/kg actual body weight No. Is the patient <60? No Use Penn State 2003 b No Yes Penn State 2003(b) No Penn State 2010 Use Mifflin St. Jeor using actual body weight
Penn State Equation • PSU 2010 (Modified Penn State Equation) • RMR = Mifflin(0. 71) + VE (64) + Tmax(85) – 3085 • Used for patients with BMI over 30 and older than 60 years old. Validated in 2010 by the ADA Evidence Analysis Library (EAL). – 2003 b • RMR = Mifflin(0. 96) + VE(31) + Tmax(167) – 6212 REE calculated using the HBE or MSJ equation; VE=minute ventilation in liters per minute; Tmax=degrees Celsius
Critical Illness— Mechanically Ventilated, trauma: Ireton-Jones Equation (1992) • Estimated energy expenditure • Ventilator-dependent patients: • EEE = 1925 + 5(W) – 10(A) + 281(S) + 292(T) + 851(B) • Obese patients: • EEE = 1444 + 606(S) + 9(Q=W) – 12(A) + 400(V) A=age in years; W=actual weight in kg; V=ventilated (0=absent, 1=present); S=sex (0=female, 1=male); T=trauma (0=absent, 1=present)
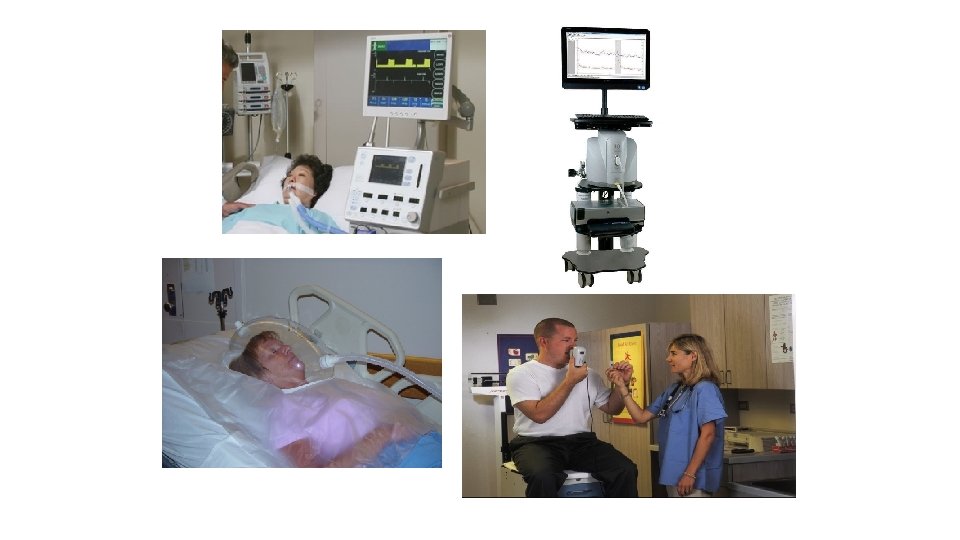
Indirect Calorimetry IC measures the volume of inspired oxygen and expired carbon dioxide to determine VO 2 and VCO 2 to calculate resting energy expenditure (REE) and respiratory quotient (RQ).
Indirect Calorimetry • REE is calculated using the Abbreviated Weir Equation – REE (kcal/d) = {VO 2(3. 94) + VCO 2(1. 11)} 1440 min/day • RQ is calculated as a ratio of carbon dioxide expired to oxygen consumed – RQ = VCO 2/VO 2
Indications for IC • Inability to accurately estimate energy requirements • Inadequate clinical response to nutrition therapy
Inability to Accurately Estimate Energy Requirements • • Trauma SIRS/fever MODS ARDS COPD Paralysis Altered body composition: – Underweight – Obesity – Alterations in fluid balance • Wounds • Paralytics • Sedation
Inadequate Clinical Response to Nutrition Therapy • Malnutrition despite “adequate” nutrition support • Poor wound healing • Failure to wean from mechanical ventilation • Underfeeding vs. overfeeding
Protein Requirements Not often done… • Can be determined through calculation of nitrogen balance • Compares nitrogen (protein) intake to nitrogen (protein) output • Limitations inaccurate urine collection and presence of renal dysfunction
Protein Requirements Condition Descriptor Adult Maintenance Older Adults Renal disease: pre-dialysis Renal disease: hemodialysis Renal disease: peritoneal dialysis Renal Disease: CRRT Hepatitis (acute or chronic) Liver disease/cirrhosis Cancer cachexia Bone Marrow Transplant (BMT) IBD Short bowel syndrome Solid organ transplant: (Acute posttransplant) Solid organ transplant (long-term) Pulmonary Disease Pregnancy Critical Illness (burns, sepsis, TBI) Stroke Protein Requirement 0. 8 -1. 0 g/kg 1. 0 -1. 2 g/kg 0. 6 -0. 8 g/kg 1. 2 -1. 3 g/kg >1. 5 -2. 5 g/kg 1 -1. 5 g/kg 1. 2 -1. 6 g/kg 1 -1. 5 g/kg 1. 5 -2. 5 g/kg 1. 0 -1. 5 g/kg 1. 5 -2. 0 g/kg 1. 2 -1. 5 g/kg +25 g/day 1. 5 -2. 0 g/kg 1 -1. 25 g/kg
Protein requirements: Older adults • Evidence suggests that older adults need more dietary protein than younger adults to support good health, promote recovery from illness, and maintain functionality. • Older adults need to make-up for age-related changes in protein metabolism • Need more protein to offset inflammatory and catabolic conditions associated with chronic and acute diseases that occur commonly with aging • Persons older than 65 years of age need at least 1. 0 -1. 2 g of protein per kg body weight to maintain and regain lean body mass and function
Protein Requirements: Wounds • For patients at risk for pressure ulcers, the recommendation for protein intake may be as high as 1. 5 g/kg to 2. 0 g/kg per day • The European Pressure Ulcer Advisory Panel recommends. 1. 0 g per kg to 1. 5 g per kg per day • Excess dietary protein in amounts greater than 1. 5 g per kg to 2 g per kg body weight per day can be a risk factor for dehydration, especially in the elderly
Fluid requirements • Goals of fluid management include maintenance of adequate hydration, tissue perfusion, and electrolyte balance • Depends on many factors • Insensible losses: fluid lost on a daily basis from the lungs, skin, respiratory tract • Measured losses: stool, urine, wound and/or ostomy drainage • Alterations in fluid balance due to • Metabolic changes: fever and hyperthyroidism • Medical therapy: diuretics
Estimating Fluid Needs: Different methods • m. L/kg method • Wt in kg – 20 x 20 (<50 years old) or 15 (>50 years old) + 1500 ml • Example: 65 y/o who weighs 70 kg (70 -20) x 15 + 1500 = 2250 ml daily • RDA method • 1 m. L fluid per kcal of estimate needs • Chronological age method • Age 16 -30 (active): 40 ml/kg, age 20 -55: 35 m. L/kg, age 55 -75: 30 m. L/kg, age >75: 25 m. L/kg • Fluid Balance method • Urine output + 500 m. L/day • Body Surface area method • 1500 m. L per square meter of body surface area
Let’s practice!