Anthropogenic Climate Change A very very brief introduction

Anthropogenic Climate Change A very, very brief introduction.

Consilience of Evidence Physics and Chemistry: Since the 1800 s, we’ve known that certain gasses trap heat creating a greenhouse effect. Historical Record Water vapor and other aerosols Reconstruction of historical temperatures using deep sea sediments and ice cores from the arctic and Antarctic. Scientists use the ratio of the two naturally occurring isotopes of oxygen, 18 O and 16 O, to extrapolate temperature data before the historical record, and direct measurement statistically adjusted to control for biased readings after the advent of regular meteorological record keeping. Nitrous Oxide Methane CO 2 All of these work by trapping energy from the sun. Direct measurement of historical CO 2 concentrations from air trapped in ice cores collected from arctic and Antarctic, as well as direct measurement of atmospheric CO 2 concentrations in the contemporary period.

Consilience of Evidence Comparisons to other sources of GHG emissions. Comparisons to other causes of warming. Scientists can rule out other possible sources of GHG to conclude that human caused emissions are currently the primary driver of climate change. Scientists can rule out other potential causes of rising temperatures such as changes in earth’s orbit. • Volcanoes, for example, emit a much smaller amount of GHG globally each year than we are finding in the atmosphere. • GHG from human sources have a different chemical signature than GRG from other sources; a different carbon isotope from fossil fuels. • GHGs create a specific pattern of warming. The temperature rises near the surfaces, but this is paired with cooling of the upper atmosphere. • Orbital changes would warm the atmosphere more uniformly.

Historical CO 2 Levels • https: //climate. nasa. gov/vi tal-signs/carbon-dioxide/ • Over last 1 million years: 172 -300 PPM • First broke 300: around the time the Titanic sank (1911) • June 2019: 413. 93 PPM

Temperature and CO 2 • https: //www. ncdc. noaa. go v/globalwarming/temperaturechange

Projections of Rising Global Temperature

Likely Effects @1. 5°C Warming @2°C Warming Ice-Free Arctic Summer 1 per century 1 per decade World Population affected by extreme heat waves 14% 37% Urban Water Scarcity +350 million people +411 million people Plant & Animal Loss 6% of insects 8% of plants 4%of vertebrates 18% of insects 16% of plants 8% of vertebrates Coral Reef Loss 80% > 99% Sea Level Rise and Effects 31 -69 million exposed to flooding Additional 10 cm rise. 32 -80 million exposed to flooding


What we must do… • http: //report. ipcc. ch/sr 15/ pdf/sr 15_spm_final. pdf
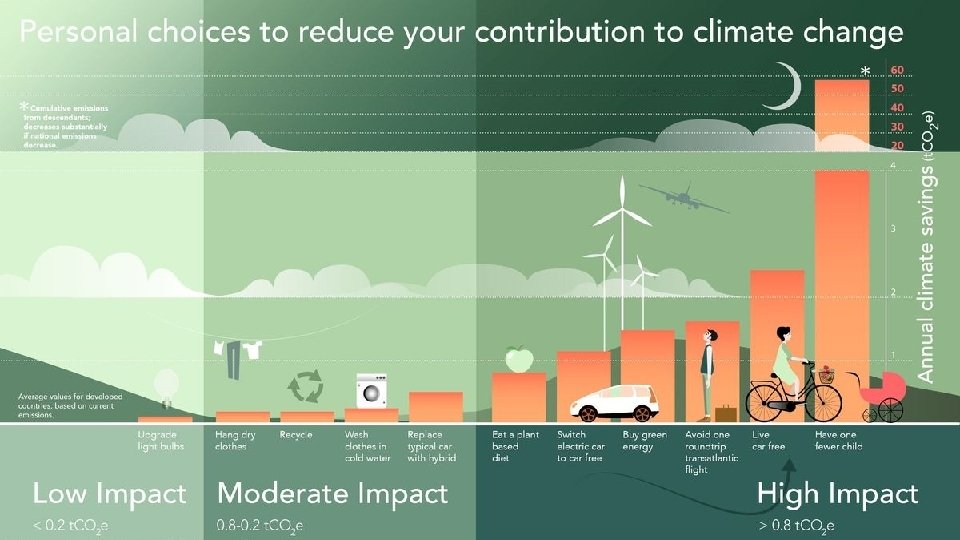

Where should we focus? • Oxfam
- Slides: 11