Antarctic Ice Core Data CO 2 varies over

 that")


 남극에서 관측된 10월의 오존전량 The big surprise")


 Aerosol: dispersed condensed matter suspended in a gas Size range:")

 use external meteorological data as input")
 Greenhouse")


![EFFECTS OF AIR POLLUTANTS ON CLIMATE CHANGE IPCC [2007] Air pollution - related greenhouse](https://slidetodoc.com/presentation_image_h/e22e60cbfd601646e45e1c77d37e2a96/image-21.jpg "EFFECTS OF AIR POLLUTANTS ON CLIMATE CHANGE IPCC [2007] Air pollution - related greenhouse")
 RELIES ON GLOBAL")


 Over the Past")


![Concentrations (ppbv) (a) 2050: Cumulative Probability [%] for O 3 2000 2050 2 20](https://slidetodoc.com/presentation_image_h/e22e60cbfd601646e45e1c77d37e2a96/image-38.jpg "Concentrations (ppbv) (a) 2050: Cumulative Probability [%] for O 3 2000 2050 2 20")

- Slides: 39
Antarctic Ice Core Data CO 2 varies over geologic time, within the range 190 – 280 ppm for the last 420, 000 years. The variations correlate with climate: cold low CO 2. Is CO 2 driving climate or vice versa? The heavier temperature lines 160, 000 BP to present reflect more data points, not necessarily variability. Source: Climate and Atmospheric History of thegreater past 420, 000 years from the Vostok Ice Core, Antarctica, by Petit J. R. , Jouzel J. , Raynaud D. , Barkov N. I. , Barnola J. M. , Basile I. , Bender M. , Chappellaz J. , Davis J. Delaygue G. , Delmotte M. Kotlyakov V. M. , Legrand M. , Lipenkov V. M. , Lorius C. , Pépin L. , Ritz C. , Saltzman E. , Stievenard M. , Nature, 3 June 1999.
FAQ 6. 1, Figure 1 Schematic of the Earth’s orbital changes (Milankovitch cycles) that drive the ice age cycles
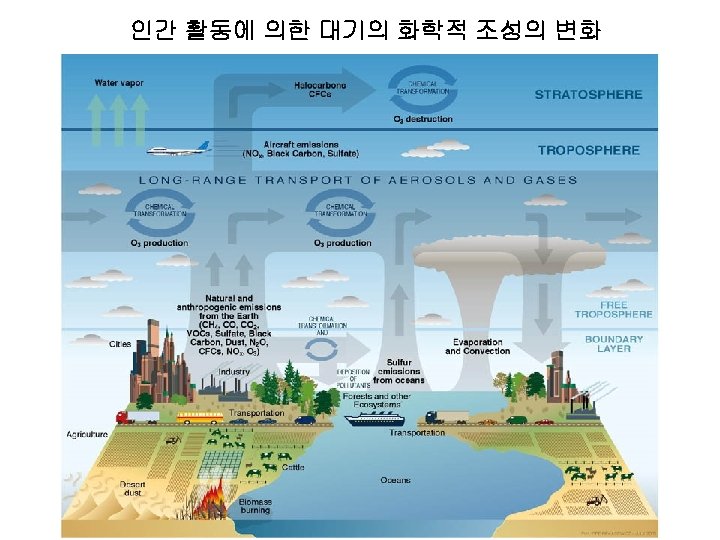
HISTORY OF EARTH’S ATMOSPHERE N 2 CO 2 H 2 O O 2 oceans CO 2 form dissolves Outgassing 4. 5 Gy B. P O 2 reaches current levels; life invades continents Life forms in. Onset of oceans photosynthesis 4 Gy B. P. 3. 5 Gy B. P. 0. 4 Gy B. P. present 4
COMPARING THE ATMOSPHERES OF EARTH, VENUS, AND MARS Venus Earth Mars 6100 6400 3400 91 1 0. 007 0. 96 4 x 10 -4 0. 95 N 2 (mol/mol) 3. 4 x 10 -2 0. 78 2. 7 x 10 -2 O 2 (mol/mol) 6. 9 x 10 -5 0. 21 1. 3 x 10 -3 1 x 10 -2 3 x 10 -4 Radius (km) Surface pressure (atm) CO 2 (mol/mol) H 2 O (atm, mol/mol) H 2 O (total, bars) x 10 -6 0. 3 400 2
RUNAWAY GREENHOUSE EFFECT ON VENUS lost to space? EARTH VENUS
OZONE TREND AT HALLEY BAY, ANTARCTICA (OCTOBER) 남극에서 관측된 10월의 오존전량 The big surprise of 1985 Farman et al. paper published in Nature 8
ANTARCTIC OZONE HOLE SEEN BY TOMS SATELLITE INSTRUMENT 인공위성으로 관측한 남극의 오존 전량농도 Total column O 3 in 2001 1 Dobson Unit (DU) = 0. 01 mm O 3 STP = 2. 69 x 1016 molecules cm-2 9
CHAPMAN MECHANISM vs. OBSERVATION shape determined by k 1 n. O 2 -3 Chapman mechanism reproduces shape, but is too high by factor 2 -3 e missing sink!
OZONE: “GOOD UP HIGH, BAD NEARBY” Nitrogen oxide radicals; NOx = NO + NO 2 Sources: combustion, soils, lightning Tropospheric ozone precursors Volatile organic compounds (VOCs) Methane Sources: wetlands, livestock, natural gas… Non-methane VOCs (NMVOCs) Sources: vegetation, combustion Carbon monoxide (CO) Sources: combustion, VOC oxidation
ATMOSPHERIC PARTICULATE MATTER (AEROSOLS) Aerosol: dispersed condensed matter suspended in a gas Size range: 0. 001 mm (molecular cluster) to 100 mm (small raindrop) 2) Secondary PM Lifetime ≈ 4 – 6 days SO 42 - NO 3 - NH 4+ OC BC ultra fine aerosol (<0. 01 μm) nucleation condensation coagulation fine accumulation OH, O 3 SO 2 Scavenging/ evaporation NOx NH 3 VOCs Emission aerosol (0. 01 – 1 μm) rainout/ washout 1) Primary PM Soil dust Sea salt coarse aerosol (1 – 10 μm) Emission Dry Deposition
AEROSOL IS A PRIMARY AIR POLLUTANT AFFECTING HUMAN HEALTH AND CAUSING VISIBILITY DEGRADATION A healthy lung The lung of a coal miner damaged by particles Shenandoah National Park 7. 6 µg m-3 Studies have shown 1 -8% increases in death per 50 μg m-3 increase in outdoor aerosol concentrations [Wallace, 2000] 65. 3 µg m-3
Atmospheric Chemistry Modeling • Chemical Transport Models (CTMs) use external meteorological data as input • General Circulation Models (GCMs) compute their own meteorological fields Solve continuity equation for individual gridboxes • Detailed chemical/aerosol models can presently afford -106 gridboxes • In global models, this implies a horizontal resolution of ~ 1 o (~100 km) in horizontal and ~ 1 km in vertical Some big problems in tropospheric chemistry Budget of CO 2 Regional air pollution Trends in emissions Chemistry-climate and oxidants interactions
SPATIAL SCALES OF AIR POLLUTION: A HISTORICAL PERSPECTIVE Stratospheric ozone depletion (1970 s) Greenhouse and aerosol-driven climate change (1980 s) Urban (pre-1970 s) Intercontinental (2000 s) • ozone, PM Regional (1970 s) • Mercury, POPs • acid rain • haze • ozone smog SOURCE CONTINENT OCEAN RECEPTOR CONTINENT
DUST STORMS PROVIDE VISIBLE EVIDENCE OF INTERCONTINENTAL TRANSPORT OF AEROSOLS Clear day April 16, 2001: Asian dust! Glen Canyon, AZ Anthropogenic pollution is transported together with the dust. satellite data Heald et al. [JGR 2005]
TREND IN OZONE BACKGROUND OVER WESTERN U. S Observations suggest 10 -15 ppbv springtime increase over past 20 years according to Jaffe et al. [2003]…but this is controversial Jaffe et al. [2003] In contrast, models find background increase of only ~3 ppbv for that period
Effects of Aerosols on Climate Semidirect Effect Direct Effect Burn cloud droplets by UV absorption Reflection Absorption Refraction Indirect Effect Increase cloud droplets SO 2 + OH H 2 SO 4 1) Brighter Cloud Reduce cloud droplet size 2) Suppress precipitation, increase cloud lifetime
EFFECTS OF AIR POLLUTANTS ON CLIMATE CHANGE IPCC [2007] Air pollution - related greenhouse forcing: 0. 4 (O 3) + 0. 3 (BC) + 0. 5 (CH 4) = 1. 2 W m -2…comparable to CO 2 Cooling from scattering anthropogenic aerosols: -0. 5 (direct) – 0. 7 (cloud albedo effect) – α (cloud lifetime effect) = -1. 1 or lower W m-2 …would cancel significant amount of warming Global radiative forcing is not the whole story, pollutants also affect regional and surface forcing e regional climate change
IPCC RADIATIVE FORCING ESTIMATE FOR TROPOSPHERIC OZONE (0. 4 W m-2) RELIES ON GLOBAL MODELS …but these underestimate the observed rise in ozone over the 20 th century Preindustrial ozone models } Observations at mountain sites in Europe [Marenco et al. , 1994]
RADIATIVE FORCING BY TROPOSPHERIC OZONE COULD THUS BE MUCH LARGER THAN IPCC VALUE Global simulation of late 19 th century ozone observations [Mickley et al. , 2001] Standard model: DF = 0. 44 W m-2 “Adjusted” model (lightning and soil NOx decreased, biogenic hydrocarbons increased): DF = 0. 80 W m-2
Figure 2. 13 -0. 55 W m-2 -0. 23 W m-2 -0. 22 W m-2 Aerosol direct radiative forcing: observation vs. models Measurement based mean estimate of aerosol direct radiative forcing is -0. 55 W m-2 much greater in magnitude than -0. 22 W m-2 of mean estimate from global models. • model error with natural aerosol simulation • cloud contamination of satellite measurements • complex assumptions about aerosol properties IPCC [2007]
PROJECTED SOx EMISSIONS IN ASIA One projection suggests that emissions of SOx will more than double in China between 1995 -2020 [Streets & Waldhoff, 2000] courtesy: David Streets Increasing SOx emissions from Asia will degrade North American air quality and present a further barrier to attainment of domestic air quality regulations in the United States (eg. EPA Haze Rule)
RISING ASIAN EMISSIONS AS SEEN FROM SPACE 1996 -2002 trend in tropospheric NO 2 columns from GOME [Richter et al. , 2005] 2006 observations of NO 2 columns from OMI show doubling of Chinese emissions since 2000 [Zhang et al. , 2008]
Air Quality in the Future? Rice Cultivation CH 4 Concentration (ppbv) Over the Past 1000 years 1600 IPCC [2001] Projections of Future CH 4 Emissions (Tg CH 4) to 2050 900 [Etheridge et al. , 1998] 1400 800 1200 700 1000 800 1000 Biomass burning Fossil fuels A 1 B A 1 T A 1 F 1 A 2 B 1 B 2 IS 92 a 600 1500 Year 2000 2020 Year 2040
EFFECTS OF CLIMATE CHANGE ON AIR QUALITY -through perturbations to air pollution meteorology, chemistry, scavenging -through perturbations to fires, dust generation, biogenic emissions Probability of max 8 -h O 3 > 84 ppbv vs. daily max. temperature Observed O 3 in Europe for 1992 -2003 Northeast Los Angeles Southeast Lin et al. [2001] Probability of exceedance doubles Temperature, K DT = 3 K O 3 in 2003 is highest due to heat wave!!
Previous GCM-CTM studies of the effect of climate change on ozone & PM air qua Mean US Europe Surface O 3: 3 Liao et al. (2006) Langner et al. (2005) Forkel and Knoche (2006, 2007) Meleux et al. (2007) PM air quality: 3 Liao et al. (2006) Racherla and Adanms (2006) Unger et al. (2006) Eastern China Surface O 3: 1 J. T. Lin et al. (2008) PM air Quality: 0 Surface O 3: 2 Jacobson (2008) J. T. Lin et al. (2008) PM air quality: 3 Tagaris et al. (2007) Jacobson (2008) Western US Pye et al. (2008) Eastern US Surface O 3: 4 Avise et al. (2008) Surface O 3: 10 Murazaki and Hofrefe et al. Hess (2006) Midwestern US (2004) Jacobson (2008) Surface O 3: 4 Liao et al. (2006) Nolte et al. (2008) Kunkel et al. (2007) Murazaki and Hess Avise et al. Tagaris et al. (2007)(2006) (2008) Nolte et al. (2008) Kunkel et al. (2007) PM air quality: 1 Wu et al. (2008) Tagaris et al. Spracklen et al. (2007) (2008) Jacobson (2008) J. T. Lin et al. (2008) Nolte et al. (2008) Wu et al. (2008) Avise et al. (2008) PM air quality: 3 Liao et al. (2006) Racherla and Adanms (2006) Heald et al. (2008) Previous GCM-CTM studies of the effect of climate change on O 3 and PM air quality focus mainly on the United States and Europe [Jacob and Winner, AE 2008].
EFFECT OF CLIMATE CHANGE ON REGIONAL AIR QUALITY GISS GCM simulations for 2050 vs. present-day climate using pollution tracers with constant emissions 2045 -2052 Thursday night weather map illustrating cyclonic ventilation of the eastern U. S. summer 1995 -2002 Pollution episodes double in duration in 2050 due to decreasing frequency of cyclones ventilating the eastern U. S. Mickley et al. [GRL 2004]
SENSITIVITY OF SURFACE AIR QUALITY TO METEOROLOGICAL VARIABLES Insights into the effect of climate change on air quality Climate change Meteorological Variables Ozone PM (aerosol) Stagnation Temperature ? ? Mixing depth Precipitation = = Cloud cover Humidity = (relative) Jacob and Winner, AE 2008
EFFECT OF CLIMATE CHANGE ON SURFACE AIR QUALITY IN THE CONTEXT OF CHEMISTRY-CLIMATE INTERACTIONS Global Climate Model Global Chemical Transport Model Jacob and Winner, AE 2008
CCSM 3 & GEOS-Chem COUPLING FOR INVESTIGATING EFFECT OF CLIMATE CHANGE ON AIR QUALITY IPCC ozone-PM precursors future emission A study on Global Chemistry-Transport (SRES) Scenario greenhouse gases input meteorology GEOS-Chem (CTM) for global ozone. PM NCAR CCSM v 3 (GCM) boundary conditions Modeling boundary conditions CMAQ for regional ozone -PM MM-5 or WRF RCM input meteorology GEOS-Chem/CCSM 3 climate-chemistry model developed last year has been applied to 1998 -2007 present-day simulations for the model evaluations
Future projections of climate change and air quality using GEOS-Chem/CCSM-3 • Predicted air quality in 2020, 2050, and 2100 climates according to IPCC SRES A 1 B, A 2, and B 1 • Predicted air quality considering both future climate and anthropogenic/biofuel emission changes according to IPCC SRES A 1 B, A 2, and B 1
2050 JJA 2000 JJA 2050 -2000 JJA
대기화학배출량 고려된 전 지구 대기화학모델 수 행 50년과 100년 후 장기 예측 값 생산 및 분석 THIS STUDY: A 2, B 1 선행연구: A 1 B (Wu et al. , JGR 2008) World North America East Asia 2050 A 2 2050 B 1 2000 KKU Change 2050 -2000 A 2, % CO [Tg /Yr] 1178. 7 252. 1 550. 6 83. 7 21. 3 84. 5 -0. 9 306. 4 60. 1 167. 1 83. 4 IPCC SRES NOx World North America East Asia [Tg /Yr] 86. 8 96. 9 22. 1 10. 1 21. 1 4. 7 46. 0 14. 0 21. 0 119. 0 [Tg/Yr ] 63. 0 126. 8 92. 3 16. 8 5. 3 22. 1 -23. 9 61. 4 8. 7 28. 6 114. 3 [Tg /Yr] 233. 2 190. 7 104. 2 123. 7 35. 5 21. 7 10. 4 242. 0 43. 0 30. 2 31. 2 37. 7 NMVOC World North America East Asia 113. 1 243. 8 NH 3 World North America East Asia 206. 5 SO 2 World North America East Asia 114. 1 [Tg /Yr] 604. 5 307. 2 285. 6 57. 4 25. 4 51. 7 11. 0 99. 3 53. 3 45. 5 118. 1
2050 JJA 2000 JJA 2050 -2000 JJA
Concentrations (ppbv) (a) 2050: Cumulative Probability [%] for O 3 2000 2050 2 20 C 3 M Climate A 1 B Climate B 1 Clim. +Emiss. A 2 Clim. +Emiss. 16 50 (b) 2099: Cumulative Probability [%] for O 3 2000 2099 84 98 Cumulative Probability 2 20 C 3 M Climate A 1 B Climate B 1 Clim. +Emiss. A 2 Clim. +Emiss 16 50 84 98 Cumulative Probability High ozone episodes over East Asia occurs more frequently in A 2 scenario.
OBSERVING SYSTEM FOR ATMOSPHERIC COMPOSITION MUST INTEGRATE SATELLITES, IN SITU MEASUREMENTS, AND MODELS NEW KNOWLEDGE Satellites Air quality monitoring & forecasting Source quantification, policing of environmental agreements Chemical transport models Long-range transport Biogeochemical cycling Climate forcing Surface monitors Aircraft, lidar Weather forecasting