ANOVA Analysis of Variance NWIn G Oneway ANOVA


- Slides: 63
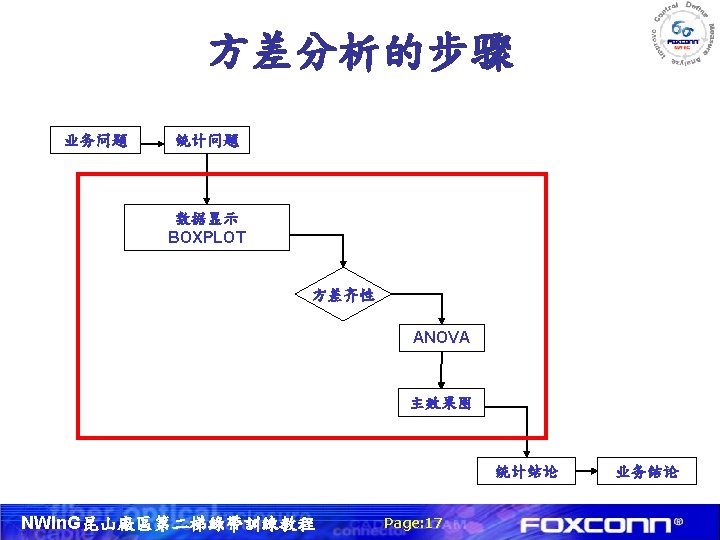
方差分析 ANOVA Analysis of Variance NWIn. G昆山廠區第二梯綠帶訓練教程
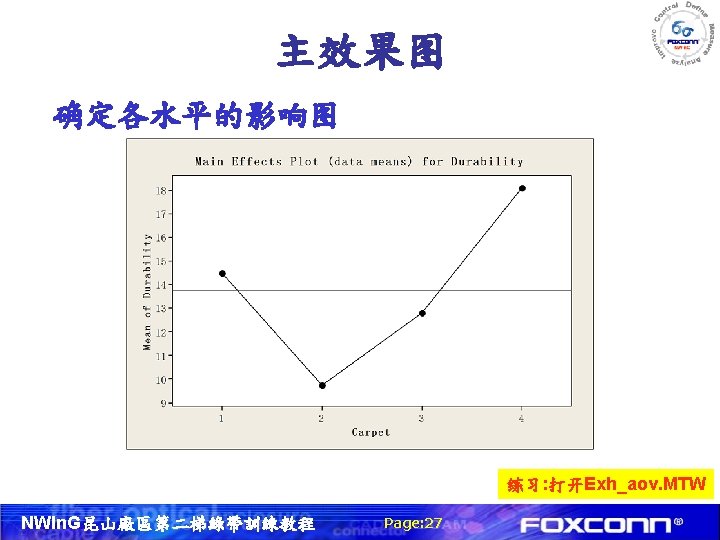
方差分析结果 One-way ANOVA: Durability versus Carpet Source DF SS MS F P Carpet 3 146. 4 48. 8 3. 58 0. 047 Error 12 163. 5 13. 6 Total 15 309. 9 S = 3. 691 R-Sq = 47. 24% R-Sq(adj) = 34. 05% Individual 95% CIs For Mean Based on Pooled St. Dev Level N Mean St. Dev ---------+---------+ 1 4 14. 483 3. 157 (-------*-------) 2 4 9. 735 3. 566 (-------*----) 3 4 12. 808 1. 506 (-------*-------) 4 4 18. 115 5. 435 (-------*-------) ---------+---------+ 10. 0 15. 0 20. 0 25. 0 Pooled St. Dev = 3. 691 P<0. 05 拒绝零假设 H 0: μ 1 = μ 2=……=μn 即接受备择假设 Ha: μ 1, μ 2, ……μn 不全相等 说明: 不同水平间均值存在差异 NWIn. G昆山廠區第二梯綠帶訓練教程 Page: 24
方差分析结果 Source Carpet Error Total 来源 组间 因子 组内 误差e 总计 DF SS MS F P 3 146. 4 48. 8 3. 58 0. 047 12 163. 5 13. 6 15 309. 9 自由度 偏差平方和 均方和 fa=g-1 SSB MSa=SSB/fa fe =n-g SSW MSe=SSW/fe f. T =n-1 SST n=r*m NWIn. G昆山廠區第二梯綠帶訓練教程 Page: 25 F比 MSa/MSe
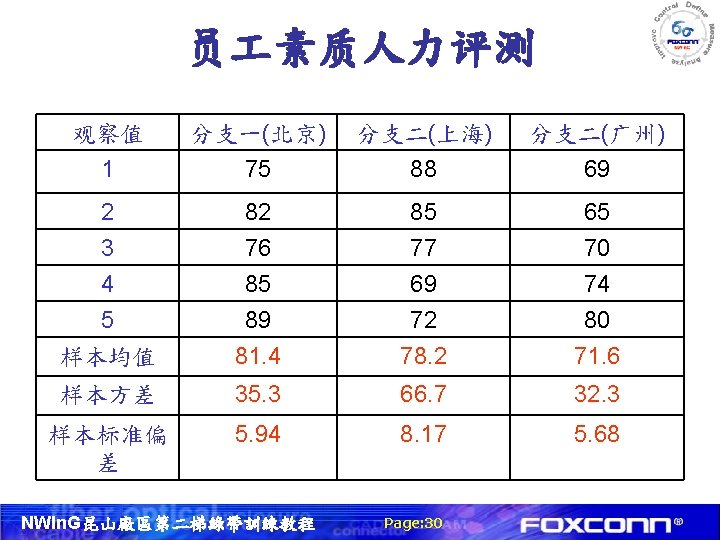
单因子方差分析结果输出 One-way ANOVA: 北京, 上海, 广州 Source DF SS MS F P Factor 2 249. 7 124. 9 2. 79 0. 101 Error 12 537. 2 44. 8 Total 14 786. 9 S = 6. 691 R-Sq = 31. 74% R-Sq(adj) = 20. 36% Individual 95% CIs For Mean Based on Pooled St. Dev Level N Mean St. Dev --+---------+-----+------北京 5 81. 400 5. 941 (-----*-----) 上海 5 78. 200 8. 167 (-----*-----) 广州 5 71. 600 5. 683 (-----*-----) --+---------+-----+------66. 0 72. 0 78. 0 84. 0 Pooled St. Dev = 6. 691 结论: NWIn. G昆山廠區第二梯綠帶訓練教程 Page: 36
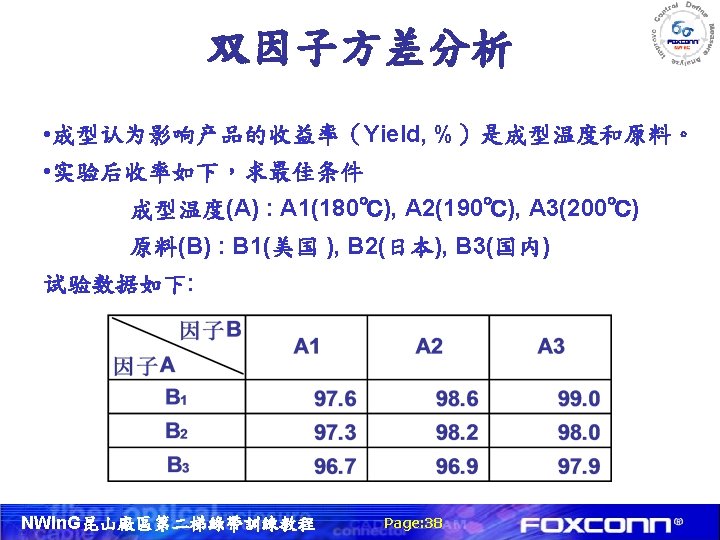
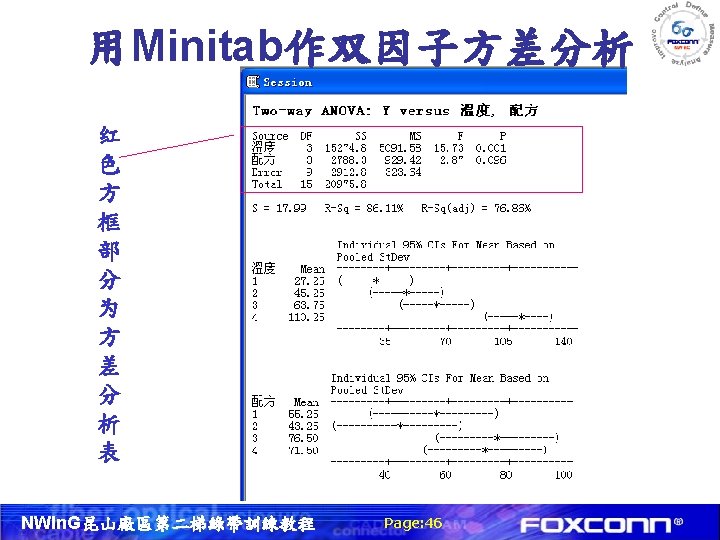
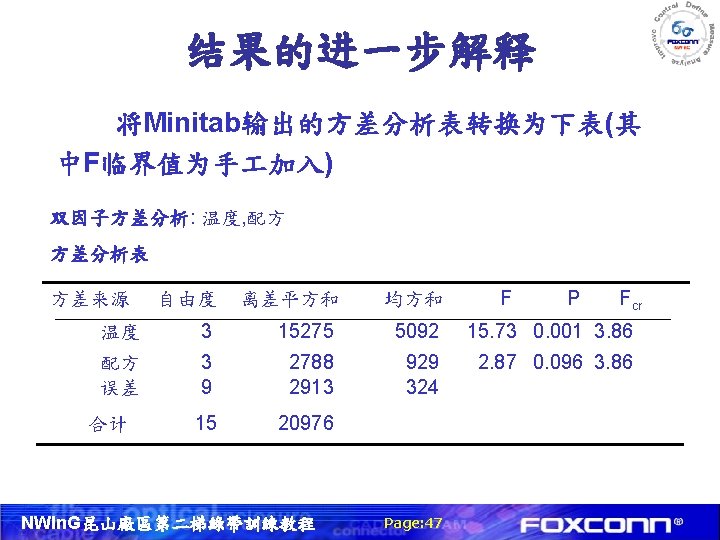
双因子方差分析结果输出 Two-way ANOVA: Y versus A, B Source DF SS MS F P A 2 1. 86000 0. 93000 8. 21 0. 038 B 2 2. 28667 1. 14333 10. 09 0. 027 Error 4 0. 45333 0. 11333 Total 8 4. 60000 S = 0. 3367 R-Sq = 90. 14% R-Sq(adj) = 80. 29% Individual 95% CIs For Mean Based on Pooled St. Dev A Mean ---------+---------+ 1 97. 2 (----*----) 2 97. 9 (----*----) 3 98. 3 (----*----) ---------+---------+ 97. 20 97. 80 98. 40 99. 00 Individual 95% CIs For Mean Based on Pooled St. Dev B Mean +---------+-----+----1 98. 4000 (----*----) 2 97. 8333 (----*----) 3 97. 1667 (----*----) +---------+-----+----96. 60 97. 20 97. 80 98. 40 NWIn. G昆山廠區第二梯綠帶訓練教程 Page: 40 A, B的P-Value均<0. 05, 说明成型温度和原料均 为影响Y的显著因子
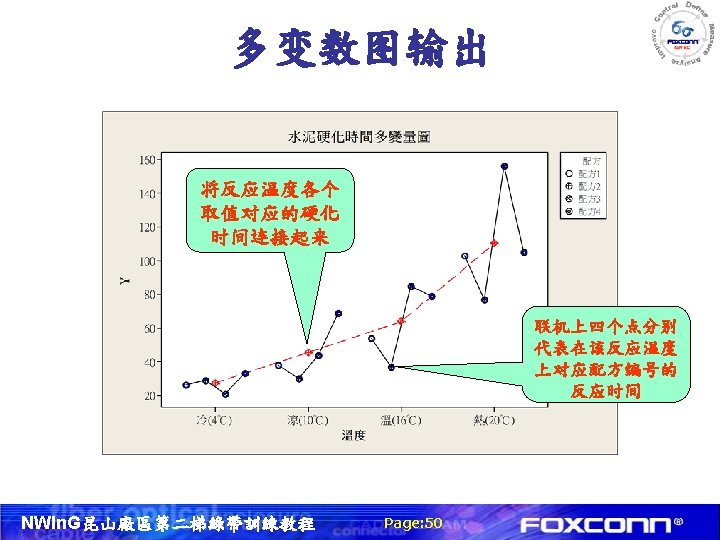
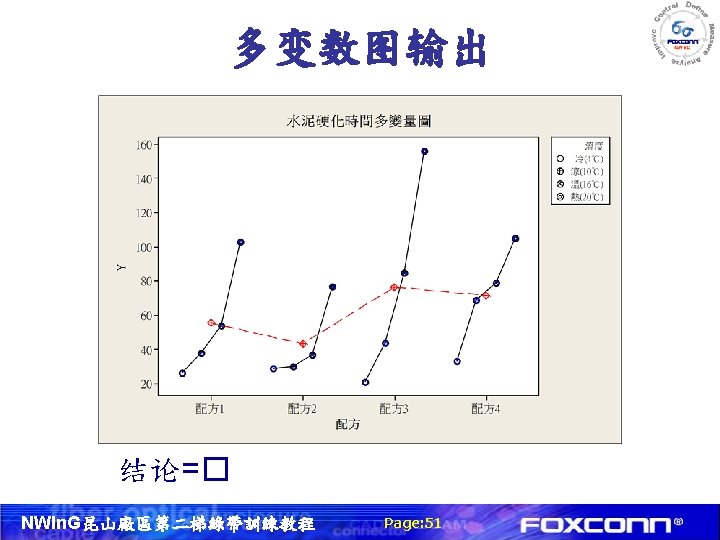
多变量图分析 多变量图: Stat→Quality Tools→Multi-Vari Chart NWIn. G昆山廠區第二梯綠帶訓練教程 Page: 49
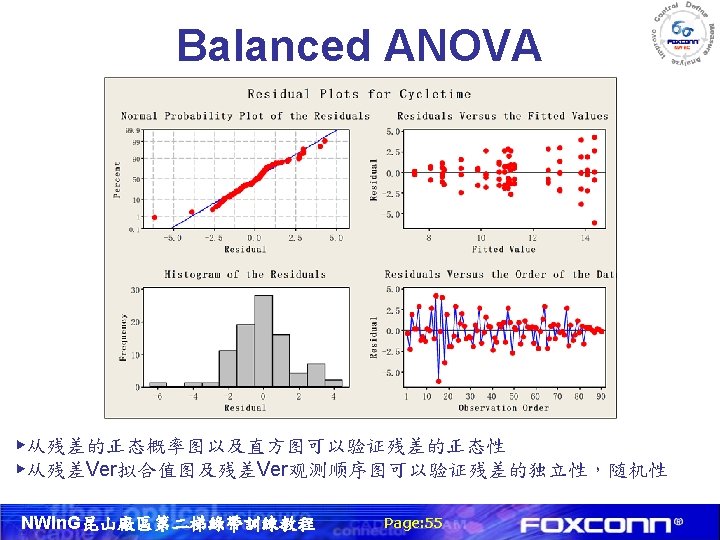
Balanced ANOVA Stat > ANOVA > Balanced ANOVA NWIn. G昆山廠區第二梯綠帶訓練教程 Page: 52
Balanced ANOVA: Cycletime versus Region, Shift, Worker. Exp Factor Region Shift Worker. Exp Type fixed Levels 3 3 2 Values 1, 2, 3 1, 2 Analysis of Variance for Cycletime Source Region Shift Worker. Exp Region*Shift Region*Worker. Exp Shift*Worker. Exp Region*Shift*Worker. Exp Error Total S = 1. 82337 DF SS MS 2 181. 154 90. 577 2 49. 150 24. 575 1 63. 003 4 5. 708 1. 427 2 22. 666 11. 333 2 20. 522 10. 261 4 29. 671 7. 418 72 239. 378 3. 325 89 611. 251 R-Sq = 60. 84% NWIn. G昆山廠區第二梯綠帶訓練教程 F 27. 24 7. 39 18. 95 0. 43 3. 41 3. 09 2. 23 R-Sq(adj) = 51. 59% Page: 54 P 0. 000 0. 001 0. 000 0. 787 0. 039 0. 052 0. 074