Annual Press Conference 2013 30 5 2013 New


- Slides: 42

Annual Press Conference 2013 30. 5. 2013 New Delhi 1

Structure of the presentation Industry synopsis… At the core of Indian. Oil… The year that was… Performance at a glance… Open forum… 2

Industry Synopsis 12/3/2020 3

Economy and oil Economy vs. POL consumption 8 7 Oil Consumption Growth (%) 9. 5 9. 6 9. 3 6 4 6. 7 3 12 9. 3 10 6. 2 8 6 6. 8 4. 5 2 0 8. 6 6. 7 5 1 GDP Growth (%) 3. 5 1. 4 2005 -06 2006 -07 2007 -08 2008 -09 2009 -10 5 4. 9 5 2. 9 4 2 0 2010 -11 2011 -12 2012 -13 • Indian economy grows at 5% • POL consumption @ 155. 4 MMT in 2012 -13 from 148. 1 MMT during 2011 -12 4

Indian oil and gas overview Crude Imports (MMT) Domestic Production (MMT) 159. 3 111. 5 99. 4 32. 2 2005 -06 34. 0 2006 -07 121. 7 34. 1 2007 -08 163. 6 171. 7 184. 5 132. 8 33. 5 2008 -09 33. 7 2009 -10 37. 7 2010 -11 38. 1 2011 -12 37. 9 2012 -13 • Crude imports (volume) - CAGR 9. 2% since 2005 -06 Import dependency about 77% from 76% in 2011 -12 • Crude import bill @ USD 144 billion - CAGR 20. 6% since 2005 -06 • • Domestic oil production stagnant at ~38 MMT • Gas production declined to 40. 7 BCM from 47. 6 BCM in 2011 -12 5

Oil dynamics 120 Benchmark crude oil price movement USD/ bbl 117. 98 110 106. 45 Av. Indian Crude Basket: USD 108/ bbl 100 94. 51 90 80 Apr'12 May Jun Brent(Dated) Jul Aug Sep NYMEX WTI Oct Nov Dubai Dec Jan'13 Feb Mar'13 Indian basket Moderation in Indian crude basket - Average price at USD 108/bbl vs. USD 112/bbl in FY 12 6

At the core of Indian. Oil 7

Indian. Oil – A paragon in the sector Nation’s largest refiner * 65. 7 MMTPA capacity * 30. 5% of domestic refining capacity Country-wide network * Over 11, 000 KM crude oil, products & natural gas pipelines Domestic market leader * 48. 2 % market share * Over 39, 400 touch-points R&D – among the best * Pioneer in lube & refining technologies * New focus on Alternate and Renewable energy The highest ranked Indian Company in Fortune Global 500, 2012 listing: 83 rd rank

Indian. Oil – A paragon in the sector… Petrochemicals – moving ahead * 2 nd largest domestic player * 2. 25 MMTPA capacity Natural gas * 8. 2% domestic market share * Aggressive infrastructure plans Exploration & Production * First-ever revenue from equity oil * Discovery in three wells Sustainable development * 25 MW wind capacity added since last year The highest ranked Indian Company in Fortune Global 500, 2012 listing: 83 rd rank

The year that was… 10

Indian. Oil – Redefining growth Highest-ever turnover of Rs. 4, 14, 909 crore - a rise of 11% from 2011 -12 Over 100% refining capacity utilization, 6 th year in a row Bringing energy to rural India –Kisan Sewa Kendras ~ 24% of total RO network 49% of the domestic LPG customer base. Record 69 lakh new LPG connections in 2012 -13 Commissioned Integrated Crude oil Handling Facilities at Paradip

Performance at a glance 12

Refineries – Performance par excellence 78. 1 56. 3 Highest-ever Distillate Yield of 78. 1%: Barauni, Panipat and Bongaigaon > 80% Lowest-ever energy consumption at 56. 3: Panipat @ 51, among the best in industry Panipat – capable of processing 90% HS and 20% Heavy crude 13

Refineries – Profitability through optimization • Highest HS crude processing at 53. 3% from 49. 2% in 2011 -12 • Heavy/ high TAN crude processing @ 13. 4% • Crude basket enlarged to 156 crudes 26 opportunity crudes out of 32 new crudes Ø Processed 1. 32 MMT Rajasthan crude; 0. 99 MMT in 2011 -12 Ø Procured 0. 88 MMT Maya crude for the first time – heaviest crude in Indian. Oil basket Ø 14

Refineries – Forward agenda • Projects under implementation: To augment by 2016 -17 Ø Capacity to 74. 0 MMTPA from 54. 2 MMTPA Ø HS crude processing capability to 67% from 53. 3% Ø Heavy crude processing capability to 21. 4% from 13. 4% Ø Distillate yield to a level of 80. 7% • Paradip - State-of-the-art, one of the most modern refineries Ø Ø Ø Capable of processing 100% HS including 40% Heavy crude Nelson complexity factor – 12. 2, comparable to the best in industry Distillate yield – 81%, Energy index – 50 MBN 15

Pipelines – Resplendent networking Economic transportation – 47% of total white oil products moved through pipelines; 36% by rail, 2% by road & 14% through coastal 12/3/2020 16

Pipelines – Spreading wings • Two additional SPMs commissioned at Paradip 5 SPMs in operation - 2 on west coast, 3 on east coast Ø Cumulative handling of over 500 MMT crude at Vadinar & over 50 MMT crude at Paradip Ø • Added storage capacity of over 360 TMT for crude oil • Blending facility at Vadinar – ready for commissioning • First customer connectivity through gas pipeline 17

Pipelines – Forward agenda • Over 110 MMTPA capacity & 19, 000 KM by 2016 -17 • Enhancement of capability to transport heavy crude Ø • • From 25 cst to 40 cst Major Crude oil pipelines Ø Debottlenecking of Salaya-Mathura pipeline Ø Augmentation of Paradip-Haldia-Barauni Pipeline Major Product pipelines Ø Paradip Raipur Ranchi Pipeline Ø Paradip-Haldia-Durgapur LPG pipeline Ø Cauvery Basin Refinery (CPCL) -Trichy pipeline 18

Domestic growth(%) - Major POL products 17. 3 4. 8 20. 7 7. 4 14. 1 13. 9 9. 0 4. 6 11. 3 ATF 10. 7 9. 7 -2. 6 2005 -06 2006 -07 2007 -08 2008 -09 2009 -10 2010 -11 9. 0 6. 7 1. 4 2. 1 2005 -06 8. 8 9. 1 7. 7 6. 8 10. 7 5. 0 5. 6 2011 -12 2012 -13 -4. 8 HSD 11. 1 8. 5 MS 7. 8 LPG 6. 8 7. 1 3. 8 2006 -07 2007 -08 1. 5 2008 -09 2009 -10 2010 -11 2011 -12 1. 6 2012 -13 Trend in line with economy & prices Declining growth in LPG due to capping of domestic cylinders 19

Marketing – Effulgent performance Domestic POL sales (MMT) 66. 7 6. 6 70. 1 5. 0% 7. 0 LPG 1. 5% 71. 2 7. 2 6. 3 6. 7 6. 9 5. 8 5. 4 5. 0 31. 6 34. 1 Naphtha MS ATF SKO HSD 35. 6 6. 0 5. 0 3. 9 2010 -11 2011 -12 2012 -13 LDO FO/LSHS Lube Greases Bitumen Others Highest-ever product sales; Market leader with 48. 2% market share 20

Marketing – Making winning moves • Highest No. of ROs commissioned Ø Over 10% sales contributed by KSKs • 1600 ROs automated during the year, total reached to 4, 377 • Commissioned an AFS at Thoise: 10, 500 ft. above MSL • Highest-ever supplies of 1 MMT to Nepal • Added over 600 TMTPA of LPG bottling capacity 21

Marketing – Reaching out, touching lives SKO/ LDO Terminal/ Dealers, 3938 Depots, 135 (42. 2%) (59. 8%) Consumer Pumps, 6361 (86. 0 %) As on 31. 3. 2013 AFS, 97 (50. 3%) LPG Distributors, 6467 (51. 3%) Retail Outlets, 22372 (45. 6%) LPG Bottling Plants, 90 (48. 4%) 39, 460 touch points - 51. 7 % of the industry 22

Marketing – Forward agenda • Major projects under implementation Ø LPG facilities and marketing terminal at Paradip Ø LPG import facility at Kochi Ø Various re-sitement projects for optimal logistics • Dedicated ATF pipelines • Initiatives in retail network Ø Automation of 12, 000 ROs (all ROs selling more than 100 KL/ Month) by 2016 -17 Ø Introduction of large format ROs at highways 23

R&D – Class apart • Indigenously developed technologies Ø Indmax at Guwahati & Paradip Ø LPG Deasphalting process implemented at Haldia Ø INDAdept. G being implemented at Guwahati Ø View of Indigenously developed INDMAX technology at Paradip Food grade Hexane unit commissioned at HMEL, Bhatinda • India’s first Integrated lignocellulosic biomass to ethanol pilot plant • First time co-processing of non-edible oil in DHDT unit of CPCL, Chennai Lignocellulosic Biomass to ethanol pilot plant 24

R&D – Class apart • Lubricants Ø 120 product formulations developed Ø Received 43 OEM/customer/defence approvals & re -certifications • Patents Ø Applied record No. of 52 patents in a year: 8 patents granted • Status of patents: India USA Others Total Lubes Refineries Others Total 133 56 65 254 35 138 81 254 25

PROPEL – Ideas for growing business Domestic Petrochemicals sales, KT 1824 1480 POLYMERS 842 909 208 147 GLYCOLS 614 228 312 447 542 552 107 96 118 2010 -11 2011 -12 2012 -13 PX/ PTA LAB 2 nd largest petrochemicals capacity share in the country 12/3/2020 26

Petrochemicals – Forward agenda • Entering into niche segment Ø 139 TMTPA, Butadiene Extraction Unit at Panipat Ø 120 TMTPA, Styrene Butadiene Rubber plant at Panipat • Revamp & debottlenecking of existing PX/PTA & LAB units • Poly Propylene unit at Paradip • Petcoke Gasification & Acetic Acid project 27

Gas – Emerging as the fuel of choice 25% 12/3/2020 10% Highest-ever R-LNG sales 28

Gas – Emerging as the fuel of choice… • Finalized PMC for Ennore LNG project • Aggressive moves for laying cross-country gas pipelines • Authorized to build CGD networks in Chandigarh & Allahabad • Supplies through ‘LNG at Doorstep’ - growth of 77% 29

E&P – A landmark year • Acquired 10% stake in Niobrara Shale Oil JV asset, Carrizo, USA – brought in 1 st E&P earnings • Production started in Project Carabobo, Venezuela • 1 st ever drilling in the domestic operated block • Discovery in 3 wells A view of the drilling site: IOC Khambel 1 30

Clean energy – Towards a sustainable future • Wind capacity enhanced to 63 MW • 100 GWH grid-connected renewable energy generation in a year Initiatives towards cleaner tomorrow Ø Carbon foot printing at 48 locations Ø Energy audit of 28 buildings Ø Rain water harvesting at 54 locations Ø Solarization of about 300 ROs 31

CAPEX plans - Investing for a brighter tomorrow Rs. crore • CAPEX of Rs. 48, 655 crore during XI Five Year Plans, BE Plan, 7. 1% more than plan • Budgeted Estimate (BE) of Rs. 56, 200 XII Plan 56, 200 XI Plan 45, 430 crore in XII Plan Ø Rs. 9378 crore in 2012 -13 Ø BE of Rs. 11, 277 crore in 2013 -14 XII Plan CAPEX, Rs. crore E&P Refining & Marketing Petrochemicals 56, 200 41, 456 8, 544 X Plan 24, 400 32

Global agenda – Beyond boundaries Turnover (Rs. crore) Indian. Oil • Aviation, terminaling & retail Mauritius • 24, 000 MT storage terminal • 18 retail outlets Ltd. Lanka IOC Ltd. 1274 2011 -12 2012 -13 841 2010 -11 • Storage, terminaling & retail • 157 retail outlets • Bunkering, lube blending & marketing, bitumen 1192 2090 2010 -11 2557 2011 -12 3147 2012 -13 Other overseas subsidiaries: IOC Middle East FZE – Marketing of Lubricants and POL products IOC Sweden AB and IOC (USA) Inc: Facilitating overseas upstream operations 33

CSR – Making a difference Assam Oil School of Nursing, Digboi 20 girls successfully completed 4 -year nursing course Cumulatively, 317 girls employed so far (100% success) 34

CSR – Extending care and support • 2600 educational scholarships • Total cost: Rs. 11 crore in 2012 -13 • 52 Mobile Medical Units operational, linked to 52 Kisan Seva Kendras in AP & UP • Treated over 1 million patients 12/3/2020 35

Financials 36

Turnover – Marching ahead (Rs. crore) Description Inland sales & exports Product sales to OMCs 2011 -12 2012 -13 Var. (%) 313044 344484 9. 6 49255 52547 6263 54. 3 Petrochemicals 11889 16533 39. 1 Total 378247 419827 11% 110607 Q-4 16. 1 4059 Less: Discount 373926 101105 Gas Sub-Total 414909 11. 0 96006 86102 Q-3 107686 Q-2 94680 Q-1 4321 4918 13. 8 90713 101936 373926 414909 11. 0 2011 -12 2012 -13

Profit after tax Rs. crore 7445 5005 3955 2010 -11 2011 -12 2012 -13 38

Under-recoveries (Rs. crore) 2011 -12 2012 -13 75469 85793 Discount from upstream companies 29961 31967 Budgetary support from Govt. 45486 53278 Total compensation 75447 85245 22 548 % of Unmet Under-Recovery 0. 03% 0. 64% Loss on MS (Due to non-revision of prices) 2203 485 Total Unmet U/R (including loss on MS) 2225 1033 Gross Under-Recovery Less: Compensation Unmet Under-Recovery

Borrowings 80000 Rs. crore 75, 447 2 80, 894 1. 8 70000 60000 1. 6 52, 734 1. 32 1. 27 50000 1. 4 1. 2 40000 0. 950000001 1 30000 0. 8 20000 10000 D/E Ratio 90000 2, 670 6, 409 5, 591 0 0. 6 0. 4 31. 3. 2011 31. 3. 2012 Interest Cost 31. 3. 2013 Borrowings Debt Equity Ratio 40

Contribution to Exchequer (Rs. crore) 41

Open Forum 42
 Rundown press conference
 Whats a press conference
 Https //bit.ly2v
 Organization development network annual conference
 Problemitize
 Hepi conference
 Nmls annual conference 2019
 Gie annual conference
 Annual fuze conference
 Pbfeam
 Travel health insurance association annual conference
 Gcyf 2011 annual conference
 2017 dvhimss annual fall conference
 Iowa league of cities annual conference
 Stfm abstract submission
 Stfm annual conference
 To start a new line in a cell press the ____ keys
 Agile 2013 conference
 Third party risk management conference 2019 new york
 Animal farm summary
 Wmpress
 Preparo cavitario classe 2
 Thermal press hair
 Penny press newspaper
 There were fifteen candies in that bag
 Hmt hettstedt
 Smart bench press
 Drill press safety poster
 Press tool design
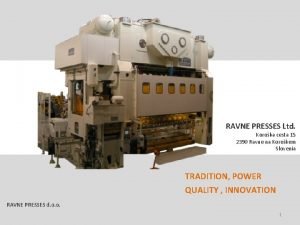
 Ravne presses
 Pine forge press
 Maria press
 Pengertian siaran pers
 Struktur press release
 Phk buku ub press
 Oxford university press south africa
 Theories of the press
 Normative society
 Authoritarian theory of mass communication
 Lateral fault
 Alo press
 Color20082009
 Press release subhead


