Annotate your ECG Electrocardiogram ECG Electrodes are placed

 Electrodes are placed on the skin over opposite sides of the heart,")


 Fatty deposits")


 Need height Need waist BMI = Mass kg")


 ◦")


, fibrous")


- Slides: 28
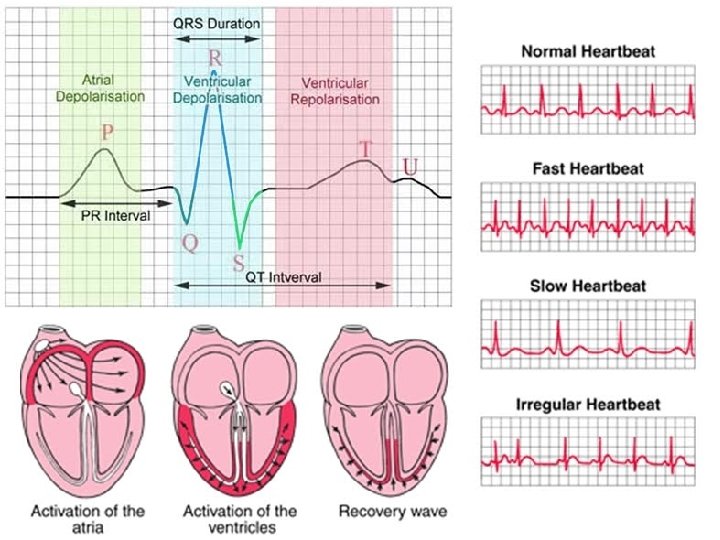
Annotate your ECG
Electrocardiogram (ECG) Electrodes are placed on the skin over opposite sides of the heart, and the electrical potentials generated recorded with time. The result is an ECG. P wave = electrical activity during atrial systole QRS complex = electrical activity during ventricular systole T wave = ventricular repolarisation (recovery of ventricular walls) Q-T interval – contraction time (ventricles contracting) T-P interval – filling time – ventricles relaxed and filling with blood Pattern are studied in different conditions and compared to the standard ECG in order to diagnose heart conditions, such as arrythmias and fibrillation. Fibrillation is stopped by passing a strong electric current through the chest wall – the heart stops for up to 5 seconds after which it begins to beat in a controlled way
Feature Description Duration RR interval The interval between an R wave and the next R wave; normal resting heart rate is between 60 and 100 bpm. 0. 6 to 1. 2 s P wave During normal atrial depolarization, the main electrical vector is directed from the SA node towards the AV node and spreads from the right atrium to the left atrium. This turns into the P wave on the ECG. PR interval The PR interval is measured from the beginning of the P wave to the beginning of the QRS complex. The PR interval reflects the time the electrical impulse takes to travel from the sinus node through the AV node and 120 to 200 ms entering the ventricles. The PR interval is, therefore, a good estimate of AV node function. PR segment The PR segment connects the P wave and the QRS complex. The impulse vector is from the AV node to the bundle of His to the bundle branches and then to the Purkinje fibers. This electrical activity does not produce 50 to 120 ms a contraction directly and is merely traveling down towards the ventricles, and this shows up flat on the ECG. The PR interval is more clinically relevant. 80 ms The QRS complex reflects the rapid depolarization of the right and left ventricles. The ventricles have a large QRS complex muscle mass compared to the atria, so the QRS complex usually has a much larger amplitude than the P 80 to 120 ms wave. J-point The point at which the QRS complex finishes and the ST segment begins. It is used to measure the degree of N/A ST elevation or depression present. ST segment The ST segment connects the QRS complex and the T wave. The ST segment represents the period when the 80 to 120 ms ventricles are depolarized. It is isoelectric. T wave The T wave represents the repolarization (or recovery) of the ventricles. The interval from the beginning of the QRS complex to the apex of the T wave is referred to as the absolute refractory period. The last half of the T wave is referred to as the relative refractory period (or vulnerable period). 160 ms ST interval The ST interval is measured from the J point to the end of the T wave. 320 ms QT interval The QT interval is measured from the beginning of the QRS complex to the end of the T wave. A prolonged QT interval is a risk factor for ventricular tachyarrhythmias and sudden death. It varies with heart rate and, for clinical relevance, requires a correction for this, giving the QTc. Up to 420 ms in heart rate of 60 bpm U wave The U wave is hypothesized to be caused by the repolarization of the interventricular septum. It normally has a low amplitude, and even more often is completely absent. It always follows the T wave, and also follows the same direction in amplitude. If it is too prominent, suspect hypokalemia, hypercalcemia or hyperthyroidism. [31] J wave The J wave, elevated J-point or Osborn wave appears as a late delta wave following the QRS or as a small secondary R wave. It is considered pathognomonic of hypothermia or hypercalcemia. [32]
Learning Outcomes q Go through ECG q Analyse the different methods of taking body measurements q. Explain the course of events that leads to atherosclerosis q Describe the blood clotting process and its role in cardiovascular disease (CVD) q Know the symptoms of CVD
Atherosclerosis – the narrowing of arteries Leads to coronary vascular disease (CVD) Fatty deposits block artery or cause clot (thrombosis) to occur Blockage of coronary arteries causes heart attack (myocardial infarction) Blockage of arteries supplying brain leads to stroke
Causes Thin endothelium layer of cells on inside of artery becomes damaged e. g. by high blood pressure or cigarette toxins When lining damaged, large white blood cells move to artery wall and accumulate blood chemicals, especially cholesterol Fatty deposit builds up - an ATHEROMA
Calcium salts and fibrous tissue also build up at site - forms PLAQUE (hard swelling) Fibrous tissue means artery loses elasticity (hardens) Plaque causes narrowing of arteries Difficult for blood to pump – rise in blood pressure Leads to POSITIVE FEEDBACK (plaque leads to high blood pressure which leads to more plaque) Oxygen and nutrients can’t get to cells
Health measurements BMI (body mass index) Need height Need waist BMI = Mass kg / height m 2 But wait. . .
Health measurements Waist/Hip Measuring tape To determine the ratio, divide your waist measurement by your hip measurement. A waist to hip ratio of more than 0. 95 for men and 0. 85 for women is “apple” shape – more PRONE to heart disease
Estimating Percent Body Fat Skinfold measurements: Folds of skin are measured with a caliper. The measurements are used in equations that link the thickness of skinfolds to percent body fat calculations made from more precise experiments.
Health measurements Percentage fat From skin fold or Electric impulse Description Women Men Essential fat 10– 13% 2– 5% Athletes 14– 20% 6– 13% Fitness 21– 24% 14– 17% Average 25– 31% 18– 24% 32%+ 25%+ Nowadays a pod can be. Obese used
Measurements from yesterday. . . BMI Waist/Hip ratio Percentage fat Skin fold callipers So why do we need fat?
Essential Fatty Acids Body cannot synthesise (so need to be supplied in diet) ◦ Fat soluble vitamins (A, D, E and K) only enter our diet in fats SO fats are essential to our diet to avoid deficiency symptoms e. g. linoleic acid deficiency (scaly skin, hair loss) Also for. . .
In cell membranes Essential for hormones etc.
OXYGEN AND NUTRIENTS CAN’T GET INTO CELLS Fibrous tissue caused artery to lose elasticity Rearr a these nge in the corre ct order Fatty deposits then build up forming an ATHEROMA Thin layer of cells in artery inner membrane are damaged Calcium salts and fibrous tissue build up forming hard plaque Narrow arteries make it difficult to pump blood so blood pressure rises The plaque causes the arteries to narrow High blood pressure damages inner artery wall even more so cycle continues = POSTIVE FEEDBACK White blood cells move to damaged wall and accumulate cholesterol
Thin layer of cells in artery inner membrane are damaged White blood cells move to damaged wall and accumulate cholesterol Fatty deposits then build up forming an ATHEROMA Calcium salts and fibrous tissue build up forming hard plaque fibrous tissue caused artery to lose elasticity The plaque causes the arteries to narrow Narrow arteries make it difficult to pump blood so blood pressure rises high blood pressure damages inner artery wall even more so cycle continues = POSTIVE FEEDBACK OXYGEN AND NUTRIENTS CAN’T GET INTO CELLS
Consequences of the atheroma As the artheroma grows the artery thickens and loses its elasticity. The diameter of the artery becomes reduced and blood flow becomes restricted resulting in increased blood pressure.
Myocardial Infarction Fatty plaque in artery ruptures Cholesterol released leading to clot formation Blood supply to heart blocked Heart muscle ischaemic (without blood) Muscles starved of oxygen too long are permanently damaged leading to dead cells Large area of dead cells more likely to be fatal
Stroke Numbness Dizziness Confusion Slurred speech Blurred or loss of vision Paralysis of one side of body
Transient Ischaemic Attack Short lived stroke Full recovery possible warning
Angina Chest pain Heart muscle respires ANAEROBICALLY Produces lactic acid Symptoms similar to indigestion
Arrhythmia Heart beats irregularly Can lead to heart failure
Atherosclerosis Summary Atherosclerosis is the accumulation of fatty material (consisting mainly of cholesterol), fibrous material and calcium forming an atheroma or plaque beneath the endothelium. As the artheroma grows the artery thickens and loses its elasticity. The diameter of the artery becomes reduced and blood flow becomes restricted resulting in increased blood pressure. Atherosclerosis is the root cause of various cardio vascular diseases including angina, heart attack, stroke and peripheral vascular disease.
Demonstrate 1. Create a flow diagram for the formation of blood clots 2. Think up a way to remember the chemical changes in the blood Damage to vessels wall means blood can come into direct contact with collagen in wall l This causes LOADS of chemical changes in the blood: l Soluble plasma protein PROTHROMBIN is converted into THROMBIN (enzyme) l THROMBIN causes soluble plasma protein FIBRINOGEN to form long INSOLUBLE strands of protein FIBRIN l FIBRIN strands form tangled mess that traps blood cells to form a clot l
Review Construct a flow chart using words and annotated pictures showing what happens in atherosclerosis. Key points in Atherosclerosis: v. Endothelial damage v. Inflammatory response v. Plaque formation v. Raised blood pressure Key points in Blood clotting process: v. Conversion of soluble proteins to insoluble protein
A T H E R O S C L E R O S I S R T E R Y