ANNAJAH NATIONAL UNIVERSITY ENGINEERING COLLEGE Civil Engineering Department


 Combination: Ultimate")
=(21. 38/5. 63)= 3. 8 >")


 LL(ton/m)")
 B. M. D(ton. m) Reinforcement")


 30 x")


: Maximum ultimate load at C 3 =381.")
 Group (2) Ultimate loads (ton) 381. 22 540.")

 2. 5*2. 9 4*3. 3 Thickness")

")

 S. F. D(ton)")
 Reinforcement")


 300 250 R 2 = 0. 9951 200 150")
 500 400 300")
 800 R 2 = 0. 9932 700 600")


: T = Rayleigh")


 Period")

 2. 5 2 1.")
/0.")


 Group (2) Group(3) Ultimate loads (ton) Dimension")

 2. 5*2.")

- Slides: 63
ﺍﻟﺮﺣﻴﻢ ﺍﻟﺮﺣﻤﻦ ﺍﻟﻠﻪ ﺑﺴﻢ AN-NAJAH NATIONAL UNIVERSITY ENGINEERING COLLEGE Civil Engineering Department Graduation project " 3 D-DYNAMIC BUILDING DESIGN INCLUDE SHEAR WALLS " Prepared By Ra`fat Amarneh Hammad Judeh Nidal Abu-Baker Instructor Dr. Imad Al-Qasem
Abstract This project is a design of an office building which located in Ramallah city. This building is consisted of seven stories. Firstly the building designed under a static load by both, hand calculation and SAP 2000 v. 12 program, after that it is analysis for dynamic by exposing the building lateral load; finally the building is redesigned by using shear walls.
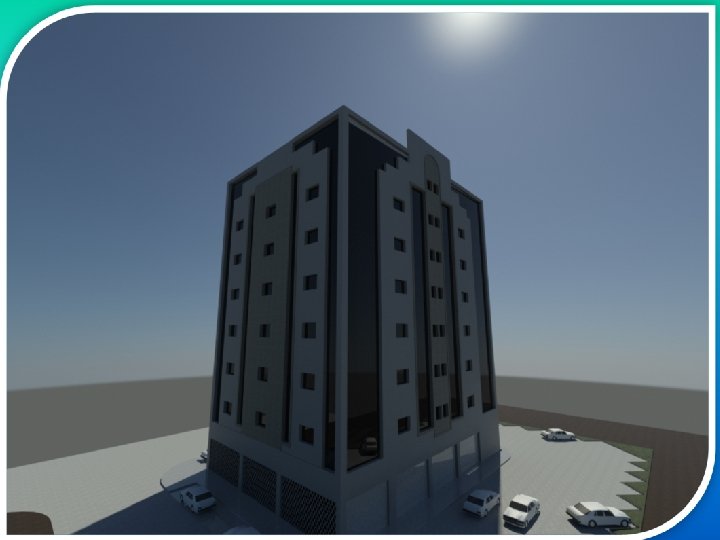
3 D of the building
Contents Chapter One: Introduction 1 -1 About the project 1 -2 Philosophy of analysis & design 1 -3 Materials 1 -4 Loads 1 -5 Codes Chapter Two: Design of floor system 2 -1 Slab systems 2 -2 Floor system 2 -3 Thickness of the slab 2 -4 Design of rib 2 -5 Shear design of rib
Contents Chapter Three: Beams 3 -1 Beams system 3 -2 Shear design of beams Chapter Four: Columns 4 -1 Introduction 4 -2 Types of columns 4 -3 Column groups 4 -4 Group design 4 -5 Summary
Contents Chapter Five: Footing 5. 1 Footing system 5. 2 Footing groups 5. 3 Groups design 5. 4 Structural analysis program modal for footing F 4 5. 5 Summary of footing group 5. 6 Tie beam Chapter Six: Dynamic Analysis 6. 1 Introduction 6. 2 Static Analysis 6. 3 Required dynamic analysis 6. 4 Summary Comment
Contents Chapter Seven: Redesign the Building with Shear Walls 7. 1 Introduction 7. 2 Design of walls 7. 3 Design of Slabs 7. 4 Design of beams 7. 5 Design of Columns 7. 6 Design of Footings
INTRODUCTION n About the project: The building in Ramallah, is an office building consists of seven floors having the same area(600 m 2) and height(3. 5 m), the first floor will be used as a garage(4 m). n Philosophy of analysis & design: Sap 2000 v 12 is used to analysis of building. Ultimate design method is used to design the building. Ø Ø
INTRODUCTION Materials of construction: Ø Reinforced concrete: unit weight= 2. 5 ton/m 3 fc = 250 kg/cm 2 But for columns fc = 300 kg/cm 2 Fy =4200 kg/cm 2 Block density = 1. 4 ton/m 3 Stone density = 3 ton/m 3 Ø Soil capacity = 4. 0 kg/cm²
INTRODUCTION n loads: Ø Live load: LL=0. 4 ton/m 2 Ø Dead load: Owen weight=(Calculated By SAP) Ø Ø SID= 0. 3 ton/m 2 Earthquake load: its represents the lateral load that comes from an earthquake.
INTRODUCTION n n Code Used: American Concrete Institute Code (ACI 318 -05) Combination: Ultimate load= 1. 2 D+1. 6 L
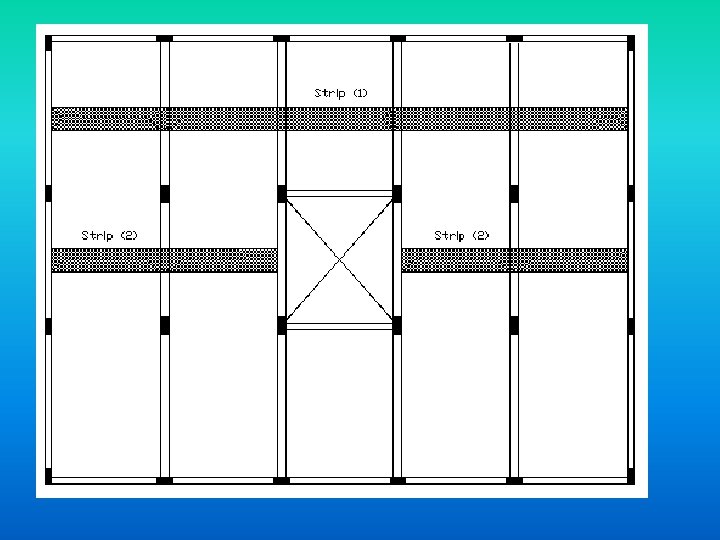
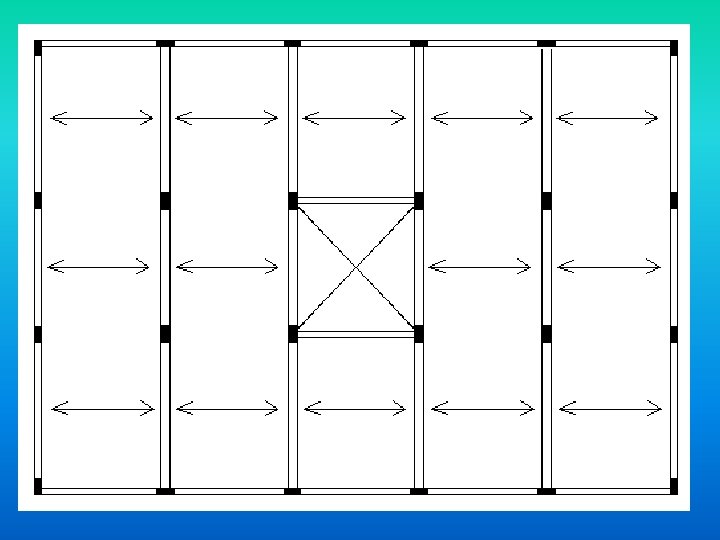
SLAB One way ribbed slab is used : (L/B)=(21. 38/5. 63)= 3. 8 > 2 Thickness of slab: hmin = Ln/18. 5 =533/18. 5=28. 81 cm Use h=30 cm. Slab consists of two strips (strip 1 & 2) n
cross section in ribbed slab
SLAB n n Design of Slab : Rib 1 :
SLAB M-ve. =3. 02 ton. m ρ= ρ= 0. 0094 As = ρ* b* d = 3. 52 cm 2 Use (2Φ 16) M+ve. =2. 24 ton. m ρ= 0. 00175 As = ρ* b* d = 2. 41 cm 2 Use (2Φ 14)
SLAB Shear Design Vu = 3. 05 ton at distance d from support Shear strength of concrete Vc =1. 1* 0. 53 * = 3. 45 ton min. Vs = 3. 5 * bw * d = 1. 31 ton Vc< Vu < Vc + min. Vs So use minimum shear reinforcement. S= use stirrups Φ 8 Use 1Φ 8 / 40 cm. * bw * d
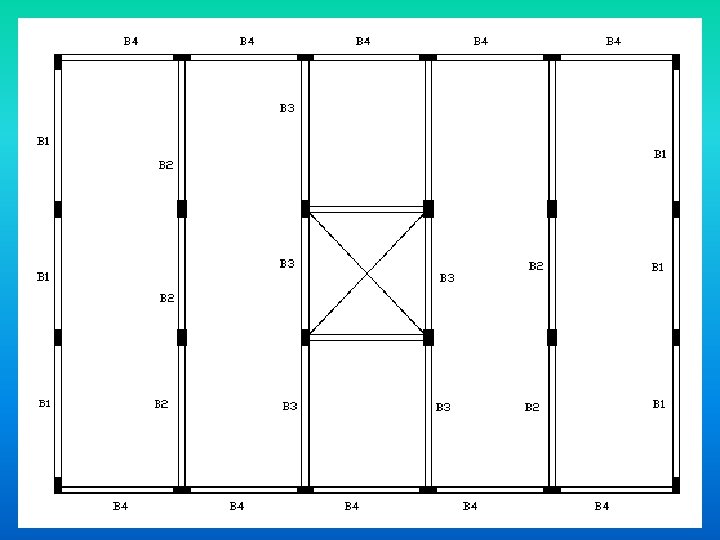
BEAMS n BEAMS SYSTEM: Beams will be designed using reaction method (Loads from slab reactions), all the beams are dropped.
BEAMS Design of beam 2: DL(ton/m) LL(ton/m)
BEAMS S. F. D(ton) B. M. D(ton. m) Reinforcement
BEAMS n Design of Beam 2: n M-ve = 49. 65 ton. m n ρ = 0. 0087 n As = 19. 39 cm 2 Use (8Φ 18). n M+ve = 47. 3 ton. m n ρ = 0. 0083 n As = 18. 38 cm 2 Use (8Φ 18)
BEAMS Check shear for B 2 Ø Ø Ø Ø Vu =42. 95 ton. min. Vs = 3. 5 * bw * d = 7. 77 ton. Vc< Vn < Vc + min. Vs = 18. 6 + 7. 77 =19. 7 ton. Use Φ 10 S = 70 cm not Ok. use Smax = d/2 < 60 cm if Vs<1. 06 * *b*d Or Smax = d/4 < 30 cm if Vs>1. 06 * *b*d Here Vs<1. 06 * * b * d S=d/2=74/2=37 cm Use 1Φ 10 /30 cm.
BEAMS Ø Summary: Beam 1 Beam 2 Beam 3 Beam 4 DIMENSION(cm) 30 x 80 Ast TOP 4 ф 16 mm 8 ф 18 mm 7 ф 18 mm 2 ф 18 mm Ast BOTTOM 4 ф 16 mm 8 ф 18 mm 2 ф 18 mm Stirrups 1 ф10@35 cm 1 ф10@30 cm 1 ф10@35 cm
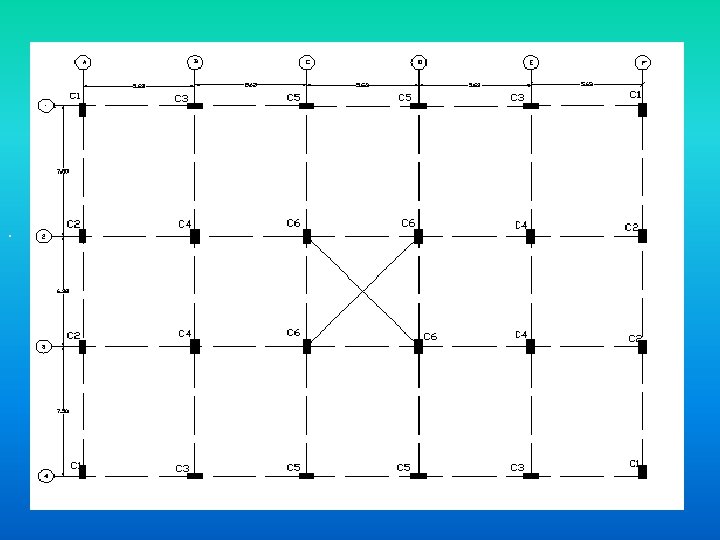
COLUMNS Ø . Ø Ø Ø Columns System : Columns are used primarily to support axial compressive loads, that coming from beams that stand over them. 24 columns in this project are classified into 2 groups depending on the ultimate axial load. The ultimate axial load on each column from the reactions of beams.
COLUMNS . Column name Ultimate load C 1 C 2 C 3 C 4 C 5 C 6 24. 85 41. 22 54. 46 77. 16 52. 49 60. 9 Group (1) C 1 C 2 C 3 C 5 Ultimate load for 7 stories 173. 95 288. 54 381. 22 540. 12 367. 43 426. 3 Group (2) C 4 C 6
COLUMNS . Design columns in group (1): Maximum ultimate load at C 3 =381. 22 ton. Use ρ=1. 5 % lie between (1 -8) % ok Pnreq =Pu/Ф = 381. 22/0. 7 = 544. 6 ton. Pn=. 8 Po =0. 8 (0. 85* fc*Ac + As Fy) 544. 6*103 = 0. 8[(0. 85*300(Ag -0. 015 Ag) + 0. 015*Ag*4200] Ag = 2166. 77 cm 2 Use 30 x 75 Ag=2250 cm 2 As = 0. 015*30*75 = 33. 75 cm 2 Use (14 Ф 18)
Summary of Columns: Groups. Group (1) Group (2) Ultimate loads (ton) 381. 22 540. 12 Dimension (cm) 30 x 75 40 x 80 Reinforcement 14 Ф 18 16 Ф 20 Ф 10 Spacing (cm) 20 20 Cover (cm) 4 4 Stirrups
FOOTING : n Footing System: Ø All footings were designed as isolated footings. The design depends on the total axial load carried by each column. Ø n Groups of footings : Group 1 Ultimate load (ton) Group 2 Ultimate load (ton) F 1 F 2 F 3 F 5 173. 95 288. 54 381. 22 367. 43 F 4 F 6 540. 12 426. 3
FOOTING : Summary Group 1 Group 2 Dimension(m) 2. 5*2. 9 4*3. 3 Thickness (cm) 75 80 Steel in the short direction Use 6Φ 20/m Steel in the long direction Use 6Φ 20/m Cover(cm) 8 8
FOOTING : q Group 2 using sap :
FOOTING : Ø Group 2 using sap : Ø Moment per meter= (128. 75/3) = 42. 9 ton. m/m Compare it with hand calculation Mu= 44. 5 ton. m % of error = (44. 5 -42. 9)/44. 5 = 3. 5 % ok Ø Ø
Tie Beam Design: n Ø Ø Tie Beam Design: Tie beams are beams used to connect between columns necks, its work to provide resistance moments applied on the columns and to resist earthquakes load to provide limitation of footings movement. Tie beam was designed based on minimum requirements with dimensions of 30 cm width and 60 cm depth.
Tie Beam Design: Tie beam 1 : DL(ton/m) S. F. D(ton)
Tie Beam Design: Tie beam 1 : B. M. D(ton. m) Reinforcement
DYNAMIC ANALYSIS In this chapter the investigation of building in static and dynamic analysis is very important by using manual and SAP results the building is exposed to EL-Centro earthquake in dynamic analysis, the building consists of seven stories but in this chapter the analysis will be made for one, three, seven and ten stories, and the comparison made between them.
DYNAMIC ANALYSIS Static Analysis n Reactions from tributary area & from SAP for 3 storey building. Column Name C 1 C 2 C 4 Reaction manual(ton) 67. 788 117. 19 213. 09 Reaction from SAP(ton) 62. 94 114. 58 250 Percent of difference(%) 7. 15 2. 23 14. 76 Reactions from tributary area & from SAP for 7 storey building Column Name C 1 C 2 C 4 Reaction manual(ton) 157. 26 272. 99 498. 24 Reaction from SAP(ton) 163. 99 264. 19 570. 13 Percent of difference(%) 4. 1 3. 22 12. 61
DYNAMIC ANALYSIS Reactions from tributary area & from SAP for 10 storey building Column Name Reaction manual(ton) Reaction from SAP(ton) Percent of difference(%) C 1 238. 31 253. 03 5. 89 C 2 379. 75 374. 87 1. 29 C 4 709. 19 798. 36 11. 17 There are differences between the values of reactions in columns from tributary area and from SAP, this because the assumption that the building is rigid , and the true that the building is semi rigid.
DYNAMIC ANALYSIS Manual Reactions (ton) 300 250 R 2 = 0. 9951 200 150 100 50 0 0 50 100 150 Reactions from SAP (ton) 200 250 Manual Reactions & Reactions from SAP (3 story building).
DYNAMIC ANALYSIS 600 R 2 = 0. 9898 Manual reactions (ton) 500 400 300 200 100 0 0 50 100 150 200 250 300 350 Reactions from SAP (ton) 400 450 500 550 Manual Reactions & Reactions from SAP (7 story building).
DYNAMIC ANALYSIS 900 Manual Reactions (ton) 800 R 2 = 0. 9932 700 600 500 400 300 200 100 0 0 100 200 300 400 500 Reactions from SAP (ton) 600 700 Manual Reactions & Reactions from SAP (10 story building). 800
DYNAMIC ANALYSIS Ø These figures show a linear graph between the reactions from manual and SAP, the correct equations with no difference must be( Y=X), but the fact that the reactions are different from SAP and manual, so these figures show these differences, if the three equations for the graphs checked; the conclusion that the coefficients of ( X) decrease; and get closer to one and this is good because the equation get closer to (Y=X) and this means the percentage of difference decreases when the number of floors increases.
DYNAMIC ANALYSIS Ø The building will be analyzed due to an earthquake of (0. 2 g) amplitude with duration and frequencies similar to El-Centro earthquake and comparing the results with static results.
DYNAMIC ANALYSIS Periods For Building : ( 2, 3, 7&10 floors): T = Rayleigh equation. Where: M: mass of floor (ton). F: earth quake force (KN). : Deflection for floor (m). Ø The building was exposed to earth quake in the wake direction (X- direction), and this the periods in this direction.
DYNAMIC ANALYSIS periods for 1 storey building f# 1 M F 549. 37 565. 93 ∆st 0. 0082 F∆st 4. 640626 M∆st 2 T 0. 03694 0. 560296 periods for 3 storey building f# 1 M 549. 37 F ∆st F∆st 565. 93 2. 57 E-02 14. 5330824 M∆st 2 T 3. 62 E-01 1. 126908 2 549. 37 565. 93 3. 38 E-02 19. 1340933 6. 28 E-01 3 549. 37 565. 93 3. 77 E-02 21. 335561 7. 81 E-01 55. 0027367 1. 77 E+00
DYNAMIC ANALYSIS periods for 7 storey building C M F ∆st F∆st M∆st 2 1 549. 37 565. 93 0. 06221 35. 20651 2. 126108 2. 104329 2 549. 37 565. 93 0. 08583 48. 57377 4. 047093 3 549. 37 565. 93 0. 10327 58. 44359 5. 858862 4 549. 37 565. 93 0. 11692 66. 16854 7. 510045 5 549. 37 565. 93 0. 12718 71. 97498 8. 885924 6 549. 37 565. 93 0. 13413 75. 90819 9. 883637 7 549. 37 565. 93 0. 13798 78. 08702 10. 45917 434. 3626 48. 77084 T
DYNAMIC ANALYSIS periods for 10 storey building f# 1 2 3 4 5 6 7 8 9 10 M 549. 37 549. 37 F 565. 93 565. 93 ∆st 0. 08048 0. 11188 0. 13628 0. 15677 0. 17387 0. 18765 0. 19811 0. 20525 0. 20917 0. 21047 F∆st 45. 54605 63. 31625 77. 12494 88. 72085 98. 39825 106. 1968 112. 1164 116. 1571 118. 3756 119. 1113 945. 0635 M∆st 2 3. 558286 6. 876538 10. 20303 13. 50177 16. 60788 19. 3447 21. 56144 23. 14362 24. 03609 24. 33578 163. 1691 T 2. 609445
DYNAMIC ANALYSIS periods for buildings from manual &SAP Building name Period manual (sec) Period from SAP(sec) B 1(1 floor) 0. 560296 0. 51788 B 2(3 floors) 1. 126908 1. 04799 B 3(7 floors) 2. 104329 1. 96805 B 4(10 floors) 2. 609445 2. 63431 Ø The values of periods for buildings are acceptable and safe, this is due to the stabilization of building and because the use of drop beams.
DYNAMIC ANALYSIS 8 7 NUMBER OF FLOOR 6 5 4 3 2 1 0 0 0. 02 0. 04 0. 06 0. 08 ∆ST (m) 0. 12 difference deflections with deferens floors 0. 14 0. 16
DYNAMIC ANALYSIS 3 R 2 = 0. 999 Periods (sec) 2. 5 2 1. 5 1 0. 5 0 0 2 4 6 Number of Floors 8 10 12 Period from SAP & Number of floors Ø This graph shows the relationship between periods and the number of floors in building (R 2=0. 999), this means that the relationship is linear, and in this graph proves that there is a relationship between the number of floors of the building and the period for this building.
DYNAMIC ANALYSIS Ø El-Centro : Factor for El-Centro = (0. 2 x 0. 01)/0. 35 = 0. 0057 The two combinations used: Comb 2: 1. 2 DL+1. 6 LL. Comb 3: 1. 2 DL+LL+EQ. Comb 3 is critical.
Redesign Building with Shear Walls Introduction Ø Horizontal forces acting on building, those due to wind or seismic action , can be resisted by different means, rigid frame resistance of the structure, augmented by the contribution of ordinary masonry walls and partitions. when heavy horizontal loading is likely, such as would result from an earthquake, reinforced concrete shear walls are used.
Redesign Building with Shear Walls Design of walls øPn= 0. 55 ø fc Ag[1 -(KLc/32 h)2] Wall Thickness (cm) Pu(ton/m) øPnw(ton/m) Wall (1) 25 18 19. 5 Wall (2) 25 17. 2 19. 5 ØThe notes from this table that øPnw > Pu for all walls so it is safe.
Redesign Building with Shear Walls Wall Reinforcement ØVertical reinforcement: According to ACI code (14. 3. 2) minimum ratio of vertical reinforcement area to gross concrete area shall be 0. 0012. As = ρ*Ag = 0. 0012*100*25 = 3 cm 2 Use (1Φ 14/20 cm) ØHorizontal reinforcement According to ACI (14. 3. 3) minimum ratio of horizontal reinforcement area to gross concrete area shall be 0. 002 As = ρ*Ag = 0. 002*100*25 = 5 cm 2 Use (1Φ 12/20 cm)
Comparison between Two Design Beam: The value of negative moment increase , and the value of positive moment decrease by using shear walls. this is because fixation at the edge slab which gives a different value , in chapter three of the project, because the assumption in chapter three that the edge of beams are hinge.
Comparison between Two Design Columns After use the shear wall in building for each story without the first floor the load increased on columns due to the weight of walls, so some of columns will be changed in dimension to carry the extra loads. load in columns after used shear walls. Column Name C 1 C 2 C 3 C 4 C 5 C 6 Total Ultimate Load (ton) 352. 45 381. 52 372. 14 550. 52 373. 5 544. 53
Comparison between Two Design Groups Group (1) Group (2) Group(3) Ultimate loads (ton) Dimension (cm) 352. 45 550. 52 372. 14 30 x 75 40 x 80 30 x 80 Reinforcement 14 Ф 18 16 Ф 20 16 Ф 18 Ф 10 Spacing (cm) 20 20 20 Cover (cm) 4 4 4 Stirrups Group 3: C 2, C 3&C 5
Comparison between Two Design
Comparison between Two Design Footing Group 1 Group 2 Group 3 Dimension(m) 2. 5*2. 9 2. 5*3. 0 4*3. 3 Thickness (cm) 75 80 80 Steel in the short direction Use 6Φ 18/m Use 6Φ 20/m Steel in the long direction Use 6Φ 18/m Use 6Φ 20/m Cover(cm) 8 8 The footing dimension increased because the loads increase. 8
Thank You