ANIMAL GENETICS BREEDING UNIT I Biostatistics Computer Application

ANIMAL GENETICS & BREEDING UNIT – I Biostatistics & Computer Application Lecture – 8 &9 Correlation Dr K G Mandal Department of Animal Genetics & Breeding Bihar Veterinary College, Patna Bihar Animal Sciences University, Patna

Correlation: Association or relationship or interdependence between two or more variables. Variables: Continuous and discrete Attributes: qualitative traits Types of correlation 1. According to direction: (i) Positive (ii) Negative (iii) Zero
 Simple (ii) Multiple (iii) partial 3. According")
2. According to number of variables: (i) Simple (ii) Multiple (iii) partial 3. According to proportionate change between two variables: (i) Linear (ii) Non-linear
According to direction: (i) Positive correlation – Both the variables move in the same")
(A)According to direction: (i) Positive correlation – Both the variables move in the same direction. Example 1. – height and weight Height (inch) : 50, 51, 52, 53, 54, 55 Body wt. (kg) : 60, 61, 62, 64, 65, 67 Example 2. variable (X) : 60, 55, 50, 45, 40, 35, 30 variable (Y) : 40, 35, 30, 25, 20, 15, 10 • Body weight increases with the increase in height. Both are moving in the same direction.
 Negative correlation – Both the variables move in the opposite direction. Example –")
(ii) Negative correlation – Both the variables move in the opposite direction. Example – Milk yield & fat percentage Daily M Y (kg): 10, 12, 14, 16, 17, 18, 20 Fat % : 6. 5, 6, 5. 5, 5, 4 • One variable is increasing while the other is decreasing. With the increase in milk production, the fat % in milk is going down.
Zero correlation – One variable increases or decreases but the other variable remains constant.")
(iii)Zero correlation – One variable increases or decreases but the other variable remains constant. Example 1. Variable X – 2, 5, 6, 8, 10, 12 Variable Y – 5, 5, 5, 5 Example 2. Variable X : 15, 12, 10, 8, 6, 4, 2 Variable Y : 6, 6, 6, 6 • With the increasing or decreasing in one variable there is no change in the second variable.
 According to no. of variables: (i) Simple – only two variables are studied")
(B) According to no. of variables: (i) Simple – only two variables are studied at a time. Eg. Height & Body wt. (ii) Multiple – three or more variables studied at a time. Example – feed quality, quantity given, feed conversion, body weight, etc. (iii) Partial correlation – studied three or more variables but find out correlation between two variables at a time while others kept constant. Eg. Correlation between crop yield and amount of fertilizer given while number of irrigation given is kept as constant.
According to proportionate change between variables: (i) Linear - Both the variables move")
( C)According to proportionate change between variables: (i) Linear - Both the variables move at a constant ratio throughout. Example: X 5, 10, 15, 20, 25 Y 10, 20, 30, 40, 50 constant ratio ½. (ii) Non-linear – Variables do not follow a constant ratio throughout. Example: X = 10, 15, 20, 25, 30, 35, 40 Y = 8, 10, 12, 13, 18, 20, 25

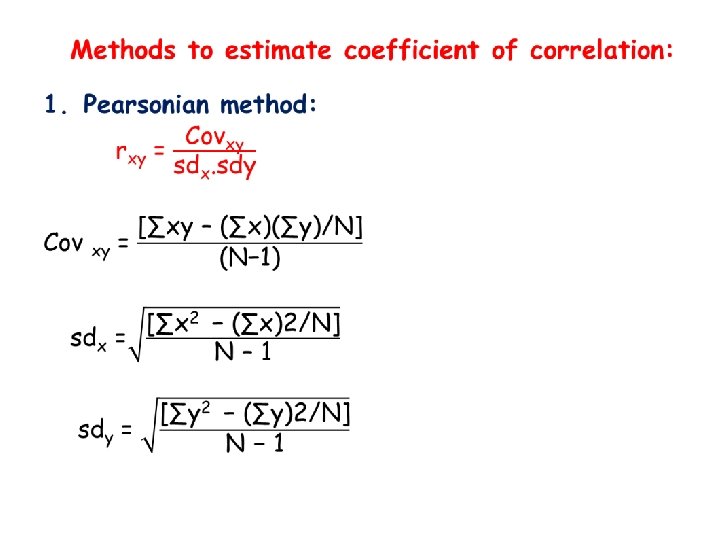
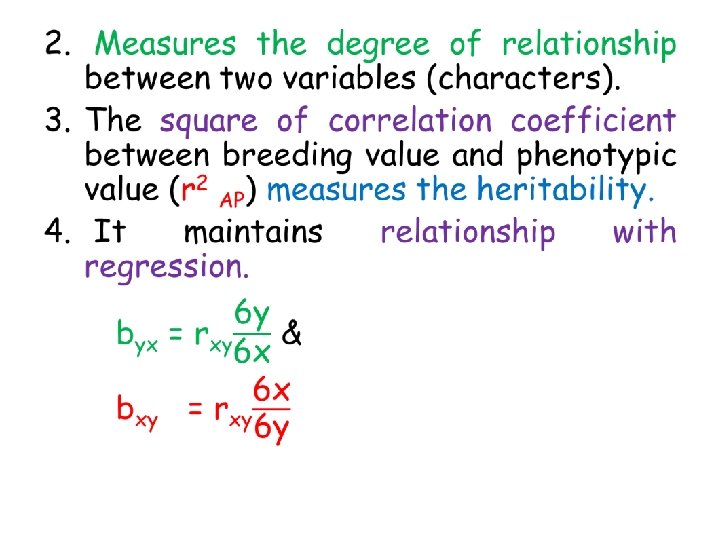
Coefficient of correlation: • It measures the degree of association or degree of interdependence or relationship between two or more variables. • Denoted as ‘r’, i. e. , rxy so that, rxy = ryx • Concept given by Karl Pearson.
 Ranges from -1 to +1 (ii) Pure number (iii)")
Properties of correlation coefficient: (i) Ranges from -1 to +1 (ii) Pure number (iii) No unit (iv) + 1 is perfect positive correlation (v) - 1 is perfect negative correlation (vi) when r = 0, it means no correlation (vii) rxy = ryx

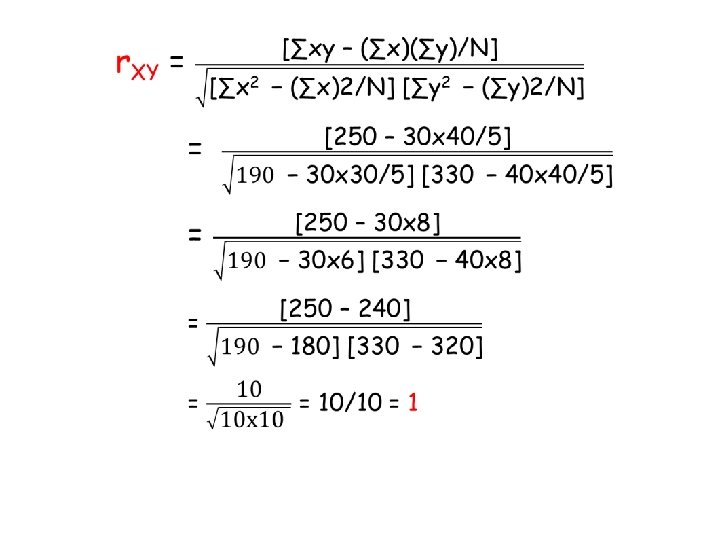
• Sl. No. X Y X 2 Y 2 XY 1 4 6 16 36 24 2 5 7 25 49 35 3 6 8 36 64 48 4 7 9 49 81 63 5 8 10 64 100 80 Total 30 40 190 330 250

Other methods to estimate Coefficient of Correlation: 1. Scatter diagram method 2. Graphic method 3. Rank correlation method 4. Least squares method

Exercise No. 1. Estimate the coefficient of correlation between X and Y variables from the following data. Sl. No. 1. 2. 3. X 2 4 6 Y 4 6 8 4. 5. 8 10 10 12 X 2 Y 2 XY
 and fat")
Exercise no. 2. Calculate the coefficient of correlation between daily milk yield(kg) and fat percentage (%) in milk of following cows. Sl. No. DMY (X) Fat % (Y) 1. 5 6. 0 2. 6 6. 0 3. 7 5. 5 4. 8 5. 5 5. 9 5. 0 6. 10 5. 0 7. 11 4. 5 8. 12 4. 0 9. 5 6. 0 10. 6 6. 0 Total X 2 Y 2 XY
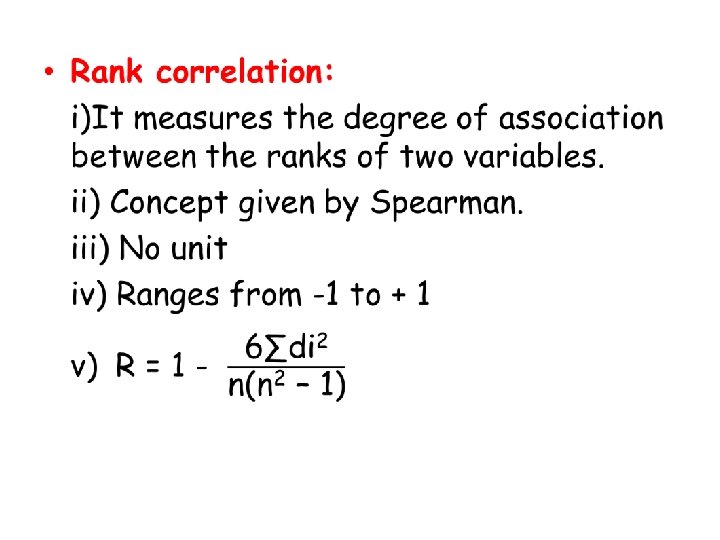

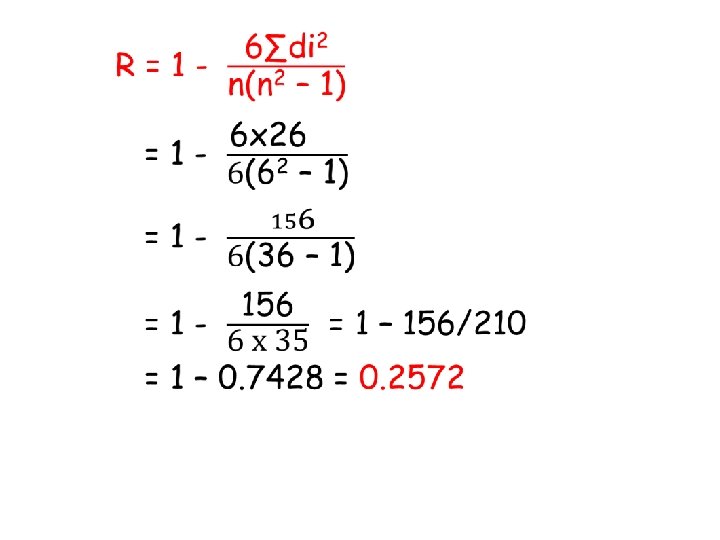
Where, di = xi – yi xi = ith rank of x variable yi = ith rank of y variable n = pair number of observation ∑di = 0 • To avoid the mathematical complexity the differences between the ranks are squared.

• Example: Estimation of rank correlation between the ranks of students secured for marks obtained in two subjects. AGB 605 Mid-term Rank (Xi) (x) Final (y) Rank (Yi) di = xi – yi di 2 A 60 6 58 6 0 0 B 70 4 68 5 -1 1 C 90 1 78 3 -2 4 D 65 5 88 1 4 16 E 75 3 84 2 1 1 F 85 2 72 4 -2 4 ∑di = 0 ∑di 2= 26 Total
 of r : S. E. of r =")
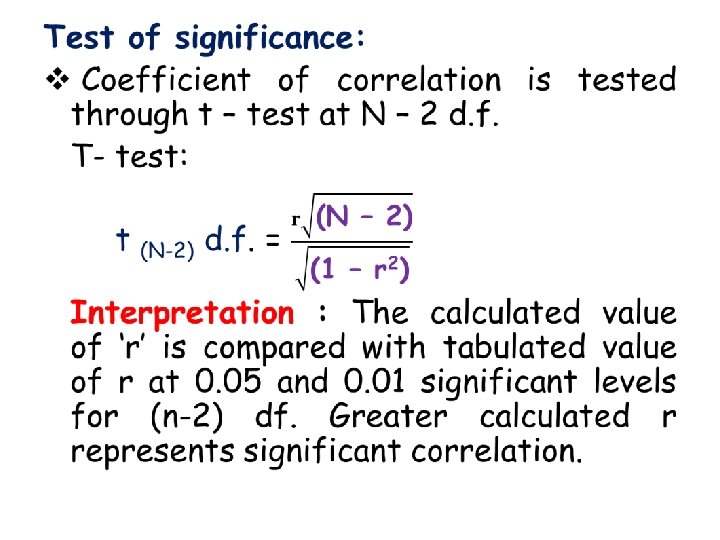
v Standard Error (S. E. ) of r : S. E. of r = (1 - r 2)/ √N v Probable Error (P. E. ) of r : P. E. (r) = 0. 6745 (1 – r 2)/ √N v If r < SE or PE, there is no correlation. v If r > 6 PE, the coefficient of correlation is said to be certain and significant.
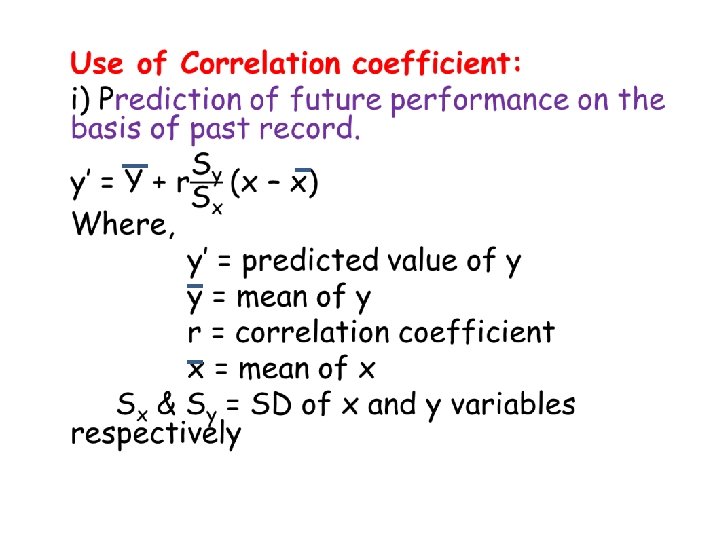

Exercise no. 3. One cow yielded 3000 kg milk in her first lactation. Predict how much milk she will give in her second lactation on the basis of following information. 1 st lactation milk yield(X) = 2 nd lactation milk yield = Y 3000 kg X = 2200 kg Y = 2500 kg SD (X) = 150 kg SD (Y) = 160 kg r. XY = 0. 80

THANK YOU
- Slides: 27