
Animal Agriculture Emissions A UK perspective Dr Dave
- Slides: 26
Animal Agriculture Emissions A UK perspective Dr. Dave Chadwick
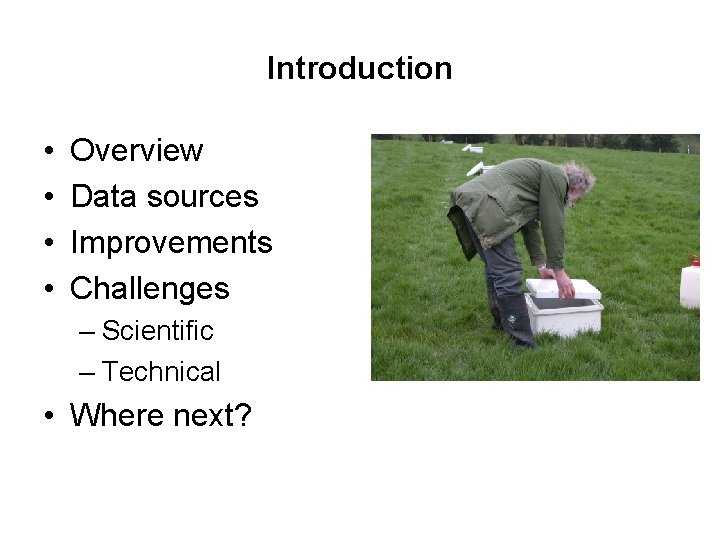
Introduction • • Overview Data sources Improvements Challenges – Scientific – Technical • Where next?
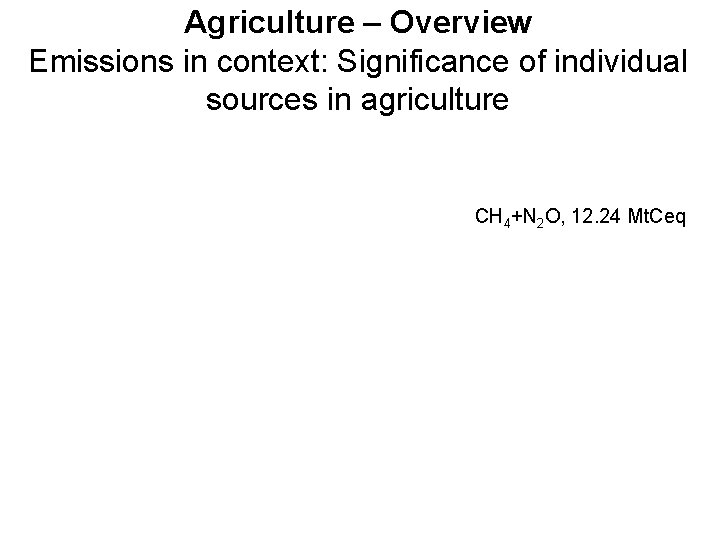
Agriculture – Overview Emissions in context: Significance of individual sources in agriculture CH 4+N 2 O, 12. 24 Mt. Ceq
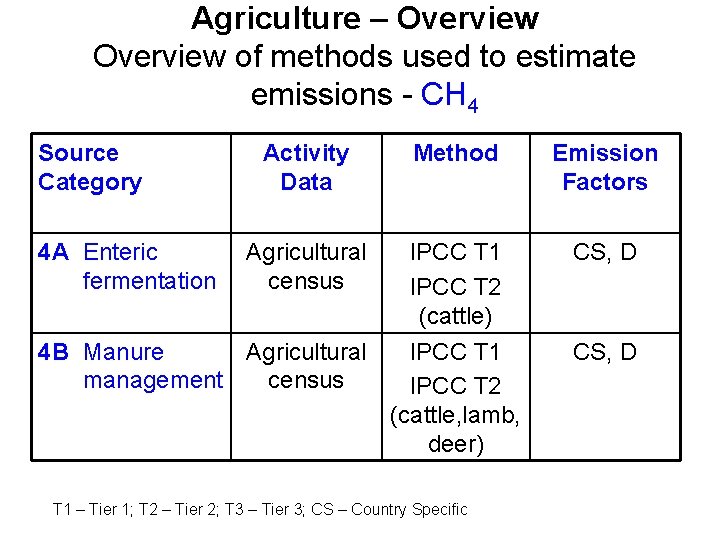
Agriculture – Overview of methods used to estimate emissions - CH 4 Source Category 4 A Enteric fermentation Activity Data Method Emission Factors Agricultural census IPCC T 1 IPCC T 2 (cattle) CS, D IPCC T 1 IPCC T 2 (cattle, lamb, deer) CS, D 4 B Manure Agricultural management census T 1 – Tier 1; T 2 – Tier 2; T 3 – Tier 3; CS – Country Specific
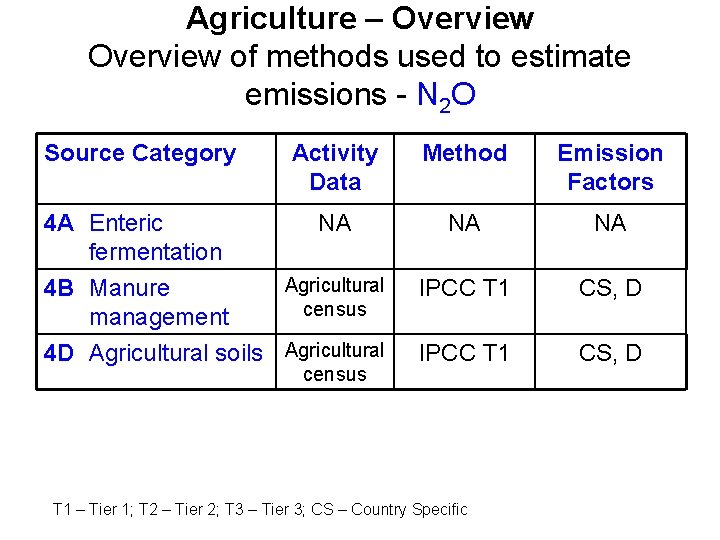
Agriculture – Overview of methods used to estimate emissions - N 2 O Source Category Activity Data Method Emission Factors 4 A Enteric fermentation NA NA NA 4 B Manure management Agricultural census IPCC T 1 CS, D 4 D Agricultural soils Agricultural IPCC T 1 CS, D census T 1 – Tier 1; T 2 – Tier 2; T 3 – Tier 3; CS – Country Specific
Agriculture – Overview Emissions in context: Agriculture sector by gas
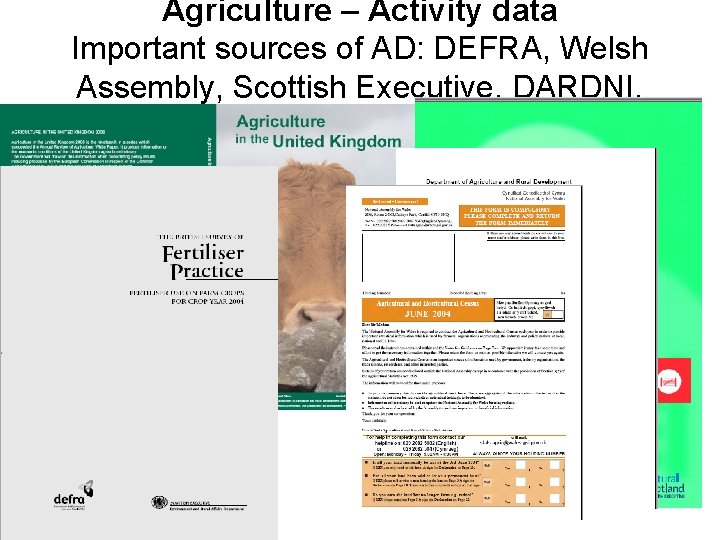
Agriculture – Activity data Important sources of AD: DEFRA, Welsh Assembly, Scottish Executive, DARDNI, BSFP
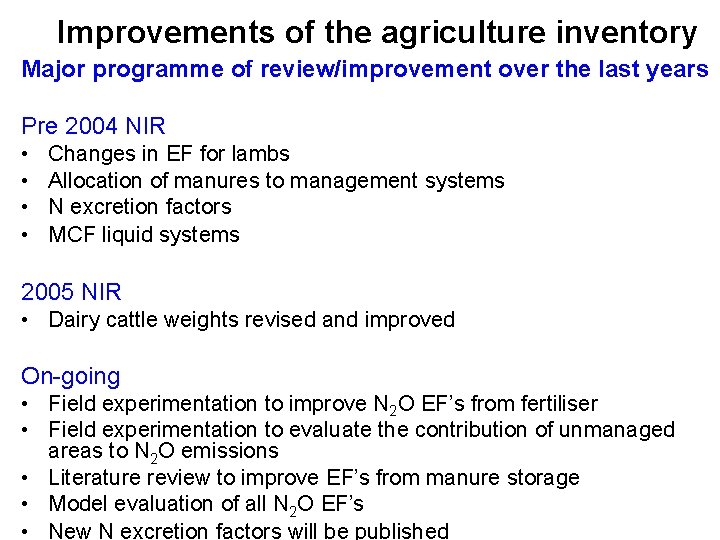
Improvements of the agriculture inventory Major programme of review/improvement over the last years Pre 2004 NIR • • Changes in EF for lambs Allocation of manures to management systems N excretion factors MCF liquid systems 2005 NIR • Dairy cattle weights revised and improved On-going • Field experimentation to improve N 2 O EF’s from fertiliser • Field experimentation to evaluate the contribution of unmanaged areas to N 2 O emissions • Literature review to improve EF’s from manure storage • Model evaluation of all N 2 O EF’s • New N excretion factors will be published
Challenges • SMARTER inventories – Better reflect national agriculture – More accurate – Reflect mitigation options – Linkage to other inventories
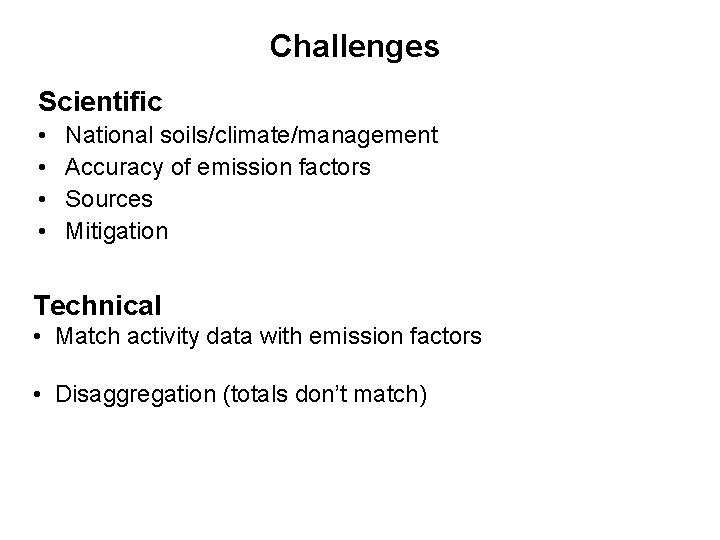
Challenges Scientific • • National soils/climate/management Accuracy of emission factors Sources Mitigation Technical • Match activity data with emission factors • Disaggregation (totals don’t match)
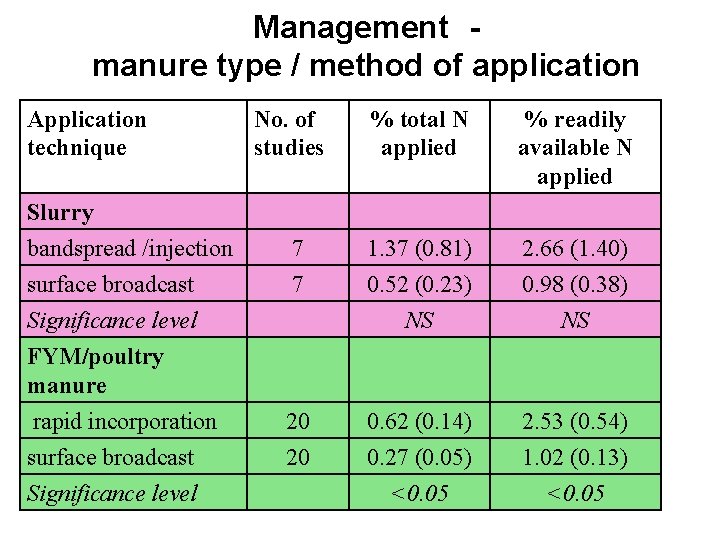
Management manure type / method of application Application technique No. of studies % total N applied % readily available N applied 7 7 1. 37 (0. 81) 0. 52 (0. 23) NS 2. 66 (1. 40) 0. 98 (0. 38) NS 20 0. 62 (0. 14) 2. 53 (0. 54) 20 0. 27 (0. 05) <0. 05 1. 02 (0. 13) <0. 05 Slurry bandspread /injection surface broadcast Significance level FYM/poultry manure rapid incorporation surface broadcast Significance level
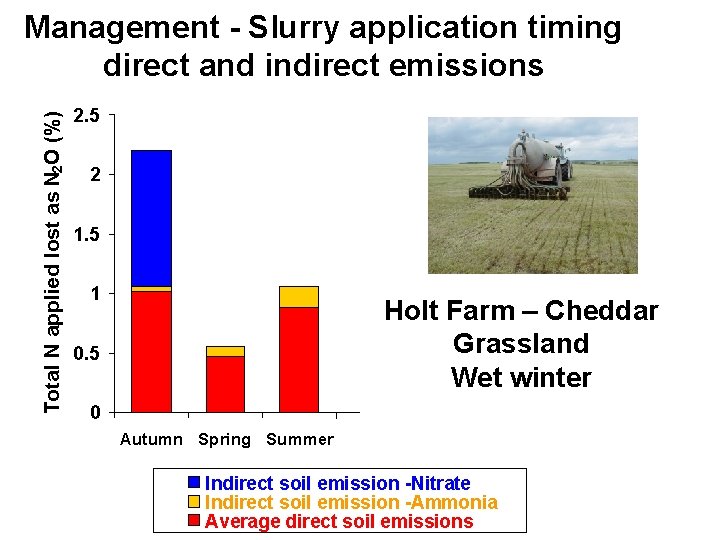
Total N applied lost as N 2 O (%) Management - Slurry application timing direct and indirect emissions 2. 5 2 1. 5 1 Holt Farm – Cheddar Grassland Wet winter 0. 5 0 Autumn Spring Summer Indirect soil emission -Nitrate Indirect soil emission -Ammonia Average direct soil emissions
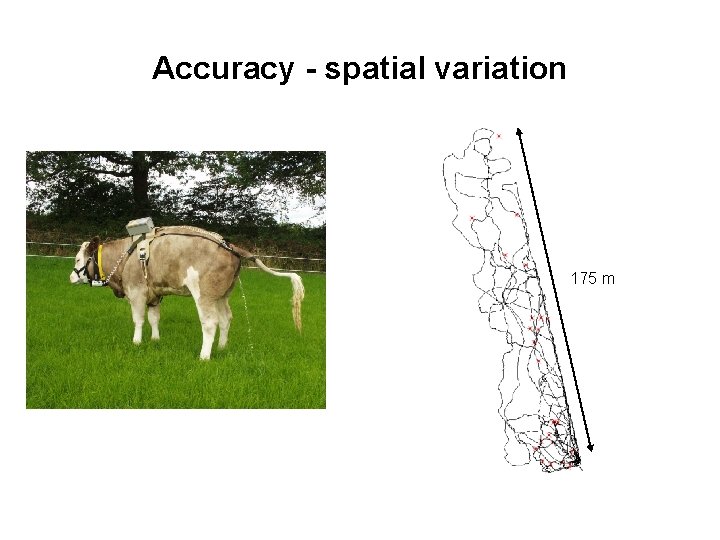
Accuracy - spatial variation 175 m
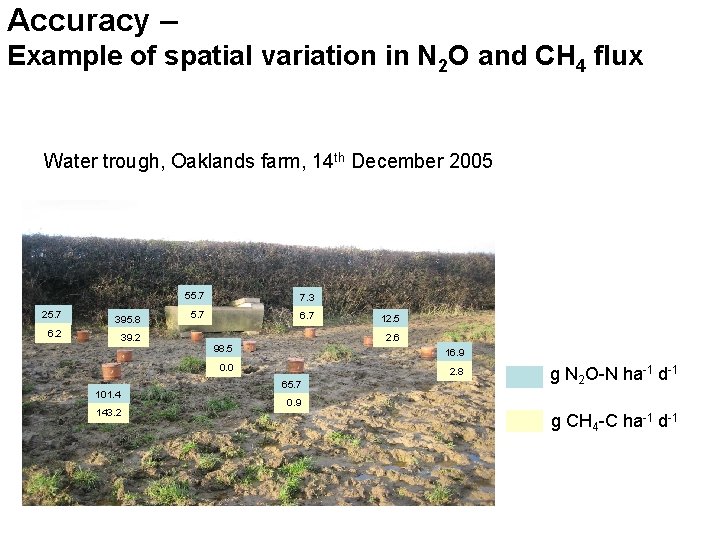
Accuracy – Example of spatial variation in N 2 O and CH 4 flux Water trough, Oaklands farm, 14 th December 2005 25. 7 395. 8 6. 2 39. 2 55. 7 7. 3 5. 7 6. 7 2. 6 98. 5 16. 9 0. 0 101. 4 143. 2 12. 5 2. 8 65. 7 g N 2 O-N ha-1 d-1 0. 9 g CH 4 -C ha-1 d-1
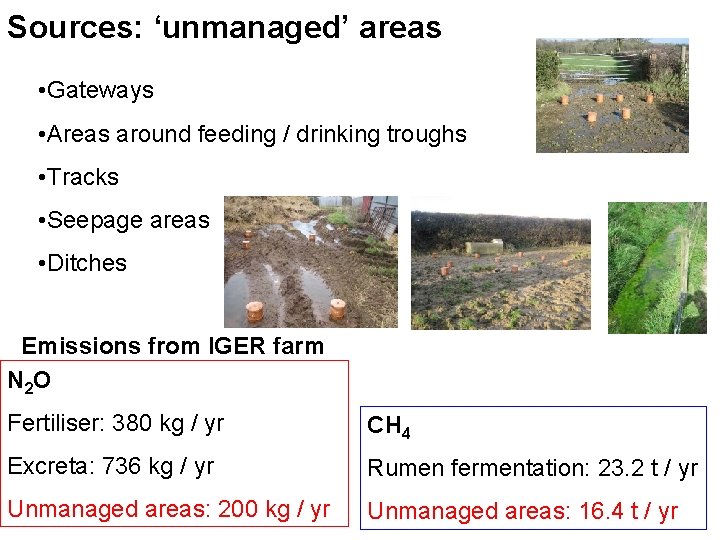
Sources: ‘unmanaged’ areas • Gateways • Areas around feeding / drinking troughs • Tracks • Seepage areas • Ditches Emissions from IGER farm N 2 O Fertiliser: 380 kg / yr CH 4 Excreta: 736 kg / yr Rumen fermentation: 23. 2 t / yr Unmanaged areas: 200 kg / yr Unmanaged areas: 16. 4 t / yr
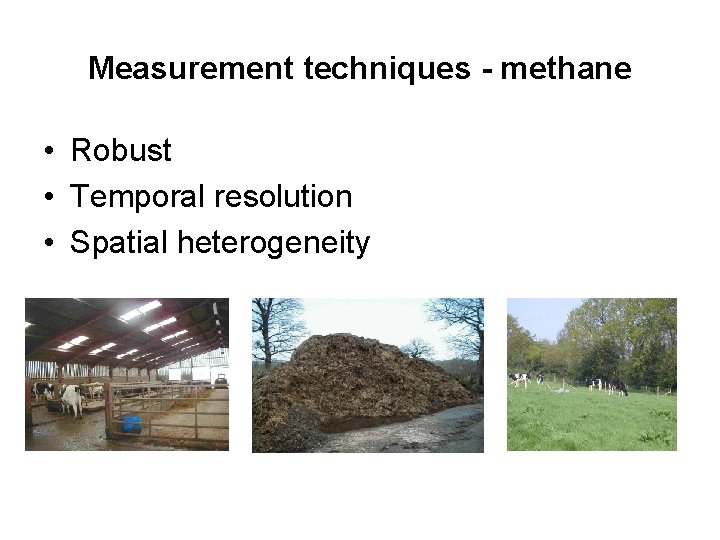
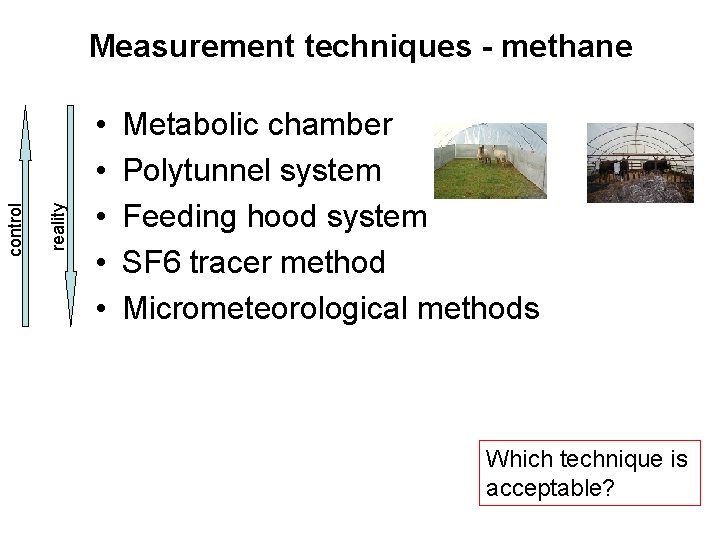
Measurement techniques - methane • Robust • Temporal resolution • Spatial heterogeneity
reality control Measurement techniques - methane • • • Metabolic chamber Polytunnel system Feeding hood system SF 6 tracer method Micrometeorological methods Which technique is acceptable?
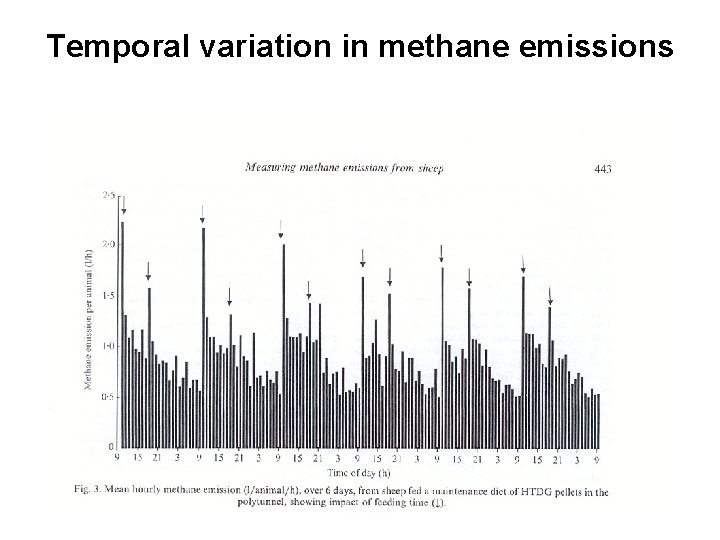
Temporal variation in methane emissions
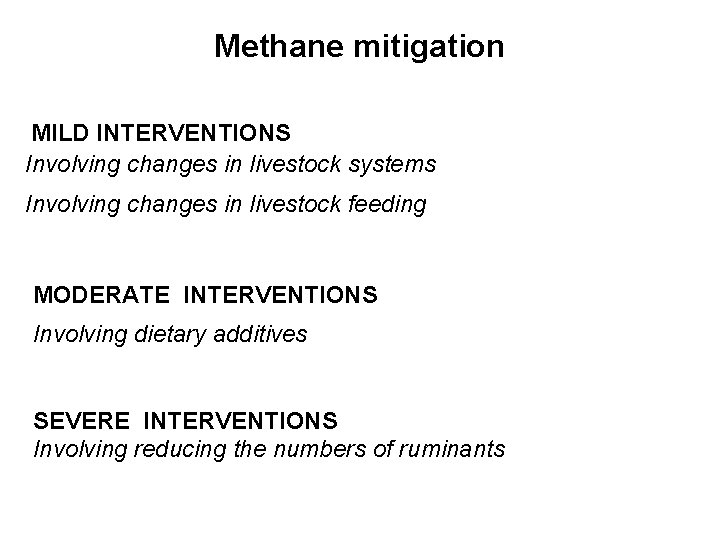
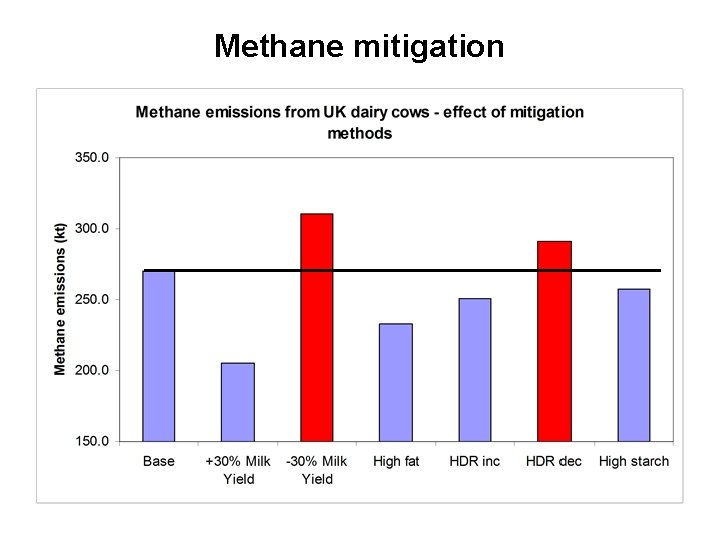
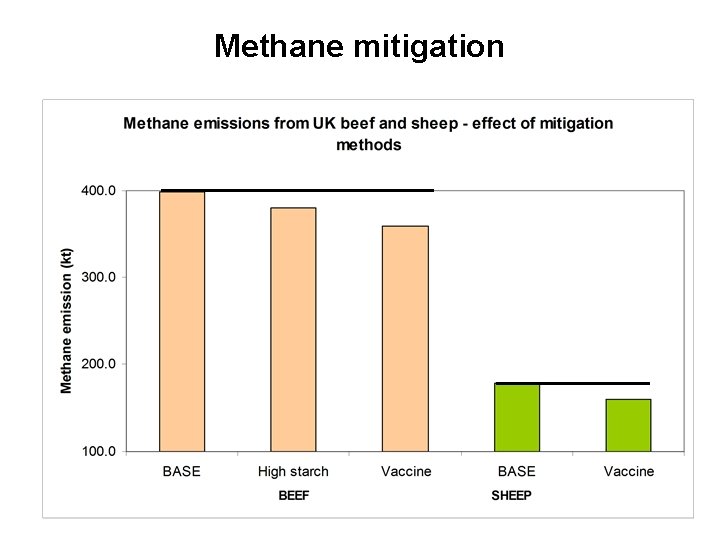
Methane mitigation MILD INTERVENTIONS Involving changes in livestock systems Involving changes in livestock feeding MODERATE INTERVENTIONS Involving dietary additives SEVERE INTERVENTIONS Involving reducing the numbers of ruminants
Scaling – CH 4
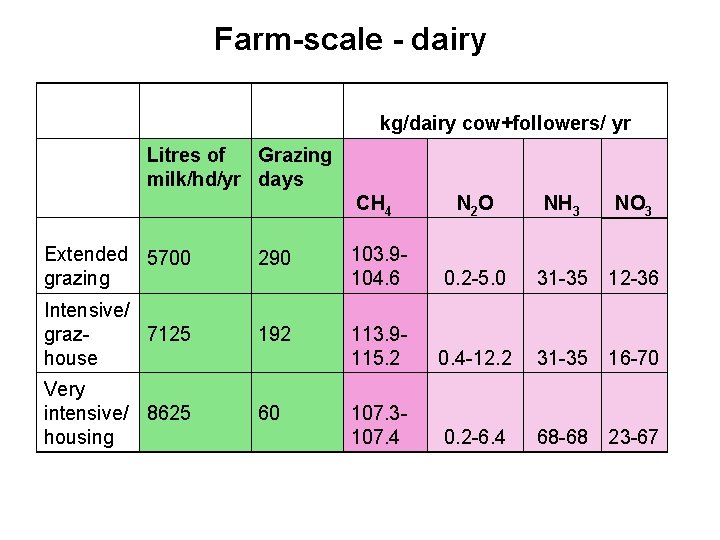
Farm-scale - dairy kg/dairy cow+followers/ yr Litres of Grazing milk/hd/yr days CH 4 N 2 O NH 3 NO 3 Extended 5700 grazing 290 103. 9104. 6 0. 2 -5. 0 31 -35 12 -36 Intensive/ graz 7125 house 192 113. 9115. 2 0. 4 -12. 2 31 -35 16 -70 Very intensive/ 8625 housing 60 107. 3107. 4 0. 2 -6. 4 68 -68 23 -67
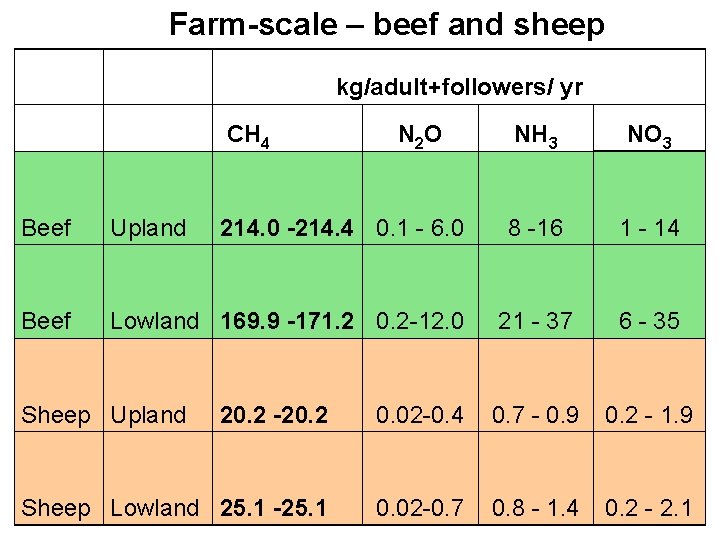
Farm-scale – beef and sheep kg/adult+followers/ yr CH 4 N 2 O Beef Upland Beef Lowland 169. 9 -171. 2 0. 2 -12. 0 Sheep Upland 214. 0 -214. 4 0. 1 - 6. 0 NH 3 NO 3 8 -16 1 - 14 21 - 37 6 - 35 20. 2 -20. 2 0. 02 -0. 4 0. 7 - 0. 9 0. 2 - 1. 9 Sheep Lowland 25. 1 -25. 1 0. 02 -0. 7 0. 8 - 1. 4 0. 2 - 2. 1
Methane mitigation
Methane mitigation
Where next? SMARTER Inventories • Activity data and scientific data ‘match’ • Forecasting • Measurement techniques • Scaling • Linking intensity with emissions • Linking inventories (pollution swapping) • Harmonisation of SMARTER inventories (models)
Acknowledgments • Defra funding • IGER colleagues Laura Cardenas, David Scholefield • Collaborators ADAS, CEH, Universities of Reading and Aberystwyth