Anderson Ranch Wesley Grubbs Creating Art from Data

Anderson Ranch: Wesley Grubbs’ Creating Art from Data Treemap Art Project: Aesthetics in Information Visualization Ben Shneiderman ben@cs. umd. edu @benbendc Founding Director (1983 -2000), Human-Computer Interaction Lab Professor, Department of Computer Science Member, Institute for Advanced Computer Studies

Interdisciplinary research community - Computer Science & Info Studies - Psych, Socio, Educ, Jour & MITH www. cs. umd. edu/hcil vimeo. com/72440805

Design Issues • • • Input devices & strategies • Keyboards, pointing devices, voice • Direct manipulation • Menus, forms, commands Output devices & formats • Screens, windows, color, sound • Text, tables, graphics • Instructions, messages, help Collaboration & Social Media Help, tutorials, training • Visualization Search www. awl. com/DTUI Sixth Edition: 2016

Information Visualization & Visual Analytics • Visual bands • Human percle • Trend, clus. . • Color, size, . . • Three challe • Meaningful vi • Interaction: w • Process mo 1999

Information Visualization & Visual Analytics • Visual bandwidth is enormous • Human perceptual skills are remarkable • Trend, cluster, gap, outlier. . . • Color, size, shape, proximity. . . • Three challenges • Meaningful visual displays of massive da • Interaction: widgets & window coordinati • Process models for discovery 1999 2004

Information Visualization & Visual Analytics • Visual bandwidth is enormous • Human perceptual skills are remarkable • Trend, cluster, gap, outlier. . . • Color, size, shape, proximity. . . • Three challenges • Meaningful visual displays of massive data • Interaction: widgets & window coordination • Process models for discovery 1999 2004 2010

Spotfire: Retinol’s role in embryos & vision

Spotfire: DC natality data

http: //registration. spotfire. com/eval/default_edu. asp

Information Visualization: Cultural Meme

Information Visualization: Mantra • • • Overview, zoom & filter, details-on-demand Overview, zoom & filter, details-on-demand Overview, zoom & filter, details-on-demand

Sci. Viz. • • • 1 -D Linear 2 -D Map 3 -D World Document Lens, See. Soft, Info Mural Info. Viz Information Visualization: Data Types • • • Multi-Var Temporal Tree Network Text Spotfire, Tableau, Qliktech, Visual Insight GIS, Arc. View, Page. Maker, Medical imagery CAD, Medical, Molecules, Architecture Life. Lines, Time. Searcher, Palantir, Data. Montage Cone/Cam/Hyperbolic, Space. Tree, Treemap Pajek, UCINet, Node. XL, Gephi, Tom Sawyer Tag. Clouds, Wordle, Many. Eyes, Ngram Viewer infosthetics. com visualcomplexity. com eagereyes. org flowingdata. com perceptualedge. com datakind. org visual. ly Visualizing. org infovis. org

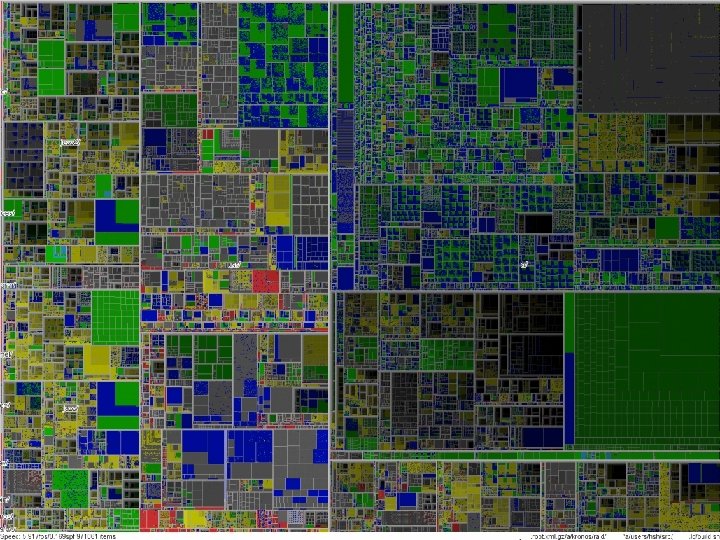
Treemap: Gene Ontology + Space filling + Space limited + Color coding + Size coding - Requires learning (Shneiderman, ACM Trans. on Graphics, 1992 & 2003) www. cs. umd. edu/hcil/treemap/

Treemap: Smartmoney Market. Map www. smartmoney. com/marketmap

Market falls steeply Feb 27, 2007, with one exception

Market mixed, February 8, 2008 Energy & Technology up, Financial & Health Care down

Market rises, September 1, 2010, Gold contrarians

Fin. Viz: Mixed day, July 30, 2015 https: //finviz. com/map. ashx

Fin. Viz: Bad day, August 21, 2015

Fin. Viz: Better day, August 25, 2015

Fin. Viz: Good day, August 26, 2015

")
Treemap: Newsmap. jp (Marcos Weskamp)
 Group by Admissions/MF, size by")
Treemap: WHC Emergency Room (6304 patients in Jan 2006) Group by Admissions/MF, size by service time, color by age
 (only those service time >12")
Treemap: WHC Emergency Room (6304 patients in Jan 2006) (only those service time >12 hours) Group by Admissions/MF, size by service time, color by age

Treemap: Nutritional Analysis www. hivegroup. com

Treemap: Spotfire Bond Portfolio Analysis www. spotfire. com

Treemap: NY Times – Car&Truck Sales www. cs. umd. edu/hcil/treemap/
: NY Times - Inflation www. nytimes. com/interactive/2008/05/03/business/20080403_SPENDING_GRAPHIC. html")
Treemap (Voronoi): NY Times - Inflation www. nytimes. com/interactive/2008/05/03/business/20080403_SPENDING_GRAPHIC. html

Book of Trees: Manuel Lima

Treemap Art Project Treemapart. wordpress. com

Treemap Art Project Treemapart. wordpress. com
, • Color")
Treemap Art Project: User Experience Aesthetics • Layout (slice-and-dice, squarified, ordered, strip), • Color palette (muted, bold, sequential, divergent, rainbow) • Aspect ratio (square, golden ratio, wide, tall) • Prominence of borders (regions, hierarchy & boundary) Engagement • Choice of data • Degree of explanation • Context Treemapart. wordpress. com
, • Color")
Treemap Art Project: User Experience Aesthetics • Layout (slice-and-dice, squarified, ordered, strip), • Color palette (muted, bold, sequential, divergent, rainbow) • Aspect ratio (square, golden ratio, wide, tall) • Prominence of borders (regions, hierarchy & boundary) Engagement • Choice of data • Degree of explanation • Context treemapart. wordpress. com www. cpnas. org/exhibitions/archive/every-algorithm-has-art-in. html
, • Color palette (muted,")
Treemap Art Project Aesthetics • Layout (slice-and-dice, squarified, ordered, strip), • Color palette (muted, bold, sequential, divergent, rainbow) • Aspect ratio (square, golden ratio, wide, tall) • Prominence of borders (regions, hierarchy & boundary) Engagement • Choice of data • Degree of explanation Treemapart. wordpress. com

Treemap Art Project Treemapart. wordpress. com

Treemap Art Project Treemapart. wordpress. com

Data Art Philosophies • Tufte: No Chartjunk, High data-to-ink ratio • Few: Clean simple clear • Holmes: Engaging infographics • Wattenberg & Viegas: Graceful content • Ericson, Cox, Bostock: Visual journalism • Shneiderman: Algorithms & interactions • Cairo, Yau, Lima, … Grubbs

www. cs. umd. edu/hcil @benbendc
, • Color palette (muted,")
Treemap Art Project Aesthetics • Layout (slice-and-dice, squarified, ordered, strip), • Color palette (muted, bold, sequential, divergent, rainbow) • Aspect ratio (square, golden ratio, wide, tall) • Prominence of borders (regions, hierarchy & boundary) Engagement • Choice of data • Degree of explanation Treemapart. wordpress. com
- Slides: 41