Analytics on A Shoestring Google Analytics Lib Guides

Analytics on A Shoestring Google Analytics & Lib. Guides Sammy Chapman Purdue University Northwest

What analytics can tell you. Usability testing and analytics go good together. Analytics by themselves will tell you only what is happening on your website - NOT WHY it's happening. Analytics can tell you WHO is using your website Analytics can help you identify WHAT problems areas there might be on your website Analytics can help you see WHERE visitors are clicking through your site

Setting up a Google Analytics account First, you need a Google Analytics account. If you have a Google account that you use for other services like Gmail, Google Drive, Google Calendar, Google+, or You. Tube, then you should set up your Google Analytics account using that same Google account. Or you will need to create a new Google account.

Adding the Google Tracking code to Lib. Guides You need to have administrative access to Lib. Guides. A Google Analytics account Login to the Lib. Guides administrative page and copy the Google tracking code from your Google Analytics account to the Lib. Guides administrative page

Google Analytics Homepage

Google Admin Tab

Setting up your Google account

Your tracking code Tracking Code

Lib. Guides Sign In

Setting up Google Analytics on Lib. Guides

Setting up Google Analytics on Lib. Guides

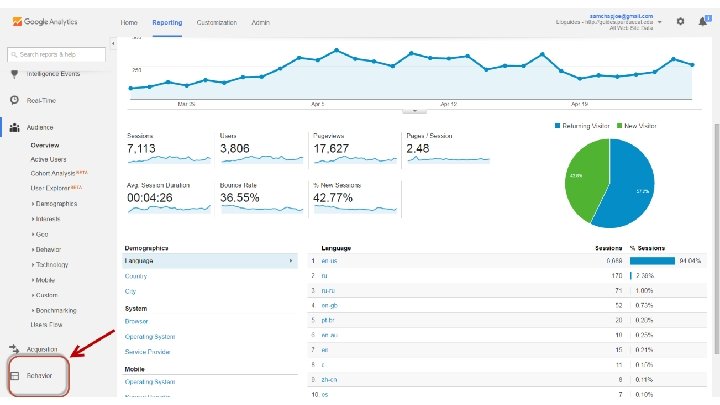
Google Analytics Home

Analytics Overview We will be clicking on the links on left to see different data.

How analytics can help you with UX. pointing to pages that might have problems such as a high bounce rate showing you the user’s path on your website where you might need to do further usability testing how are people interacting with your website such as average time on page measure the results of design changes (e. g. A/B Testing)

Analytics Dimensions & Metrics 1. Audience Information 1. Acquisition 1. Metrics such as Bounce Rate, Exit Rate, and Average Time On Page to identify problem areas 1. User Behavior The user’s path through website such as landing page

Audience information from analytics The first dimension we will look at is audience information. Under audience information you can find: Demographics - Age and Gender Geo - Language and Location Technology - Browser & OS Mobile - Devices or Desktop

Demographics Links allow us to view different data

How do users find your site- Acquisition Direct link- type in URL, links in bookmarks/favorites, links in emails, links in documents Organic search- searching Google, Bing, Yahoo clicking on unpaid listing Referral - link from another website Paid search- visitors land on page from Ad. Words, or other paid search ad Social - number of users who land on website from social media sites like Facebook, Linked. In, Twitter.

How users are coming to your site.

Search Queries for Lib. Guides

Identifying problem areas Bounce rate Exit rate Average time on page Behavior flow

Bounce rate is the percentage of users that visit just that one page and do not click on any other internal website link What is the intended journey of the website visitor? Why are visitors “bouncing” off this page? - Content on the page was not what the user expected - Is there something on the page that is driving a person away? - Clicking on a link that takes them to another site such as a database or article.
 Closes the browser (window/tab)")
Bounce rate - Sessions Clicks the back button (most common) Closes the browser (window/tab) Types a new URL Does nothing and the session times out after 30 minutes Clicked an external link

Bounce Rate

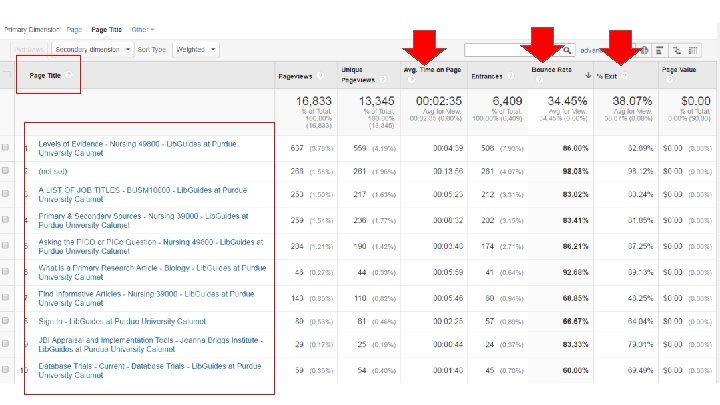
Highest Weighted Bounce Page

Exit rate - Pageviews Exit Rate is the percentage of users that leave the site from that page no matter how many other pages they have viewed. A high Exit Rate may show that the page is causing the user to leave your site part-way through their intended journey If the high Exit Rate is the intended final page in the journey, then this is not a problem. ASK YOURSELF- should user leave the site from this page

Exit Rate

Average Time on Page The average amount of time users spend viewing a page. How does the page compare with the site average? A high average time on a page could mean the content is very dense or confusing to the visitor. A very low average time on a page could mean the content is uninteresting or unappealing When considering average time on page look at related metrics such bounce rate & exit rate which are also important

Average time on page

Average time on page & Bounce rate A page with both a high bounce rate and long average time on page might be a good thing. For example a blog might have both a high time on page and high bounce rate.

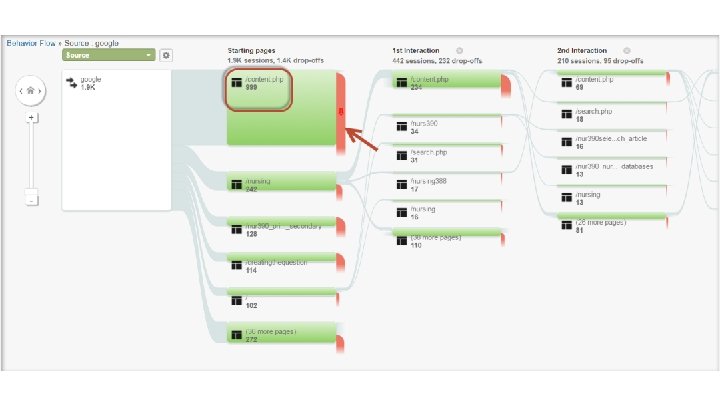
User Behavior in Google Analytics Finding Drop-Off points on your website The behavior flow reports in Google Analytics attempt to show users navigate through your website These behavior reports can help identify areas for further usability tests

Home Page The red lines represent users exiting the site.

Changing the dimensions in behavior flow

Looking at source instead of landing page

Click on Group Details to see list

Navigation Summary

The Takeaway Google Analytics can be the starting point for finding: WHO is visiting your website WHAT are some potential trouble areas of your website WHERE are the user’s paths on the Website A starting point for the UX research process

Resources for further information 1. Google Analytics Help Center https: //support. google. com/analytics/#topic=3544906 1. Statistics in Lib. Guides & Lib. Guides CMS (v 1) http: //help. springshare. com/lgstats/moreoptions 1. An Analytics-First Approach to UX, Part 1 - http: //www. uxbooth. com/articles/ananalytics-first-approach-to-ux-part-1/ 2. An Analytics-First Approach to UX, Part 2 - http: //www. uxbooth. com/articles/ananalytics-first-approach-to-ux-part-2/ 3. Designing with Analyticshttp: //www. uxmatters. com/mt/archives/2015/06/designing-with-analytics. php

Resources for further information 6. Quick and Dirty UX: 3 things Google Analytics can tell you about your users http: //www. smallbox. com/blog/quick-and-dirty-ux-3 -things-google-analyticscan-tell-you-about-your-users 7. Discovering Digital Library User Behavior with Google Analytics http: /journal. code 4 lib. org/articles/6942
- Slides: 42