
Analysis of nonstationary climatic extreme events MARTA NOGAJ
- Slides: 34
Analysis of non-stationary climatic extreme events MARTA NOGAJ Didier Dacunha-Castelle (U Orsay) Farida Malek (U Orsay) Sylvie Parey (R&D EDF) Pascal Yiou (LSCE) Marta Nogaj (marta. nogaj@cea. fr) Laboratoire des Sciences du Climat et de l’Environnement
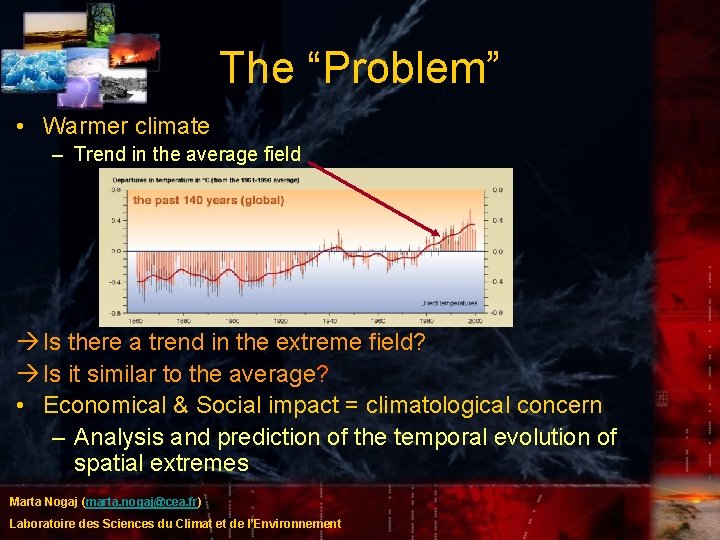
The “Problem” • Warmer climate – Trend in the average field Is there a trend in the extreme field? Is it similar to the average? • Economical & Social impact = climatological concern – Analysis and prediction of the temporal evolution of spatial extremes Marta Nogaj (marta. nogaj@cea. fr) Laboratoire des Sciences du Climat et de l’Environnement
The Menu • Our extremes • Introduction of non-stationarity – GPD/Poisson model – Descriptive analysis – “Varying threshold” • Method Description • Method Analysis – Problems of lack of asymptotic convergence – Empirical results – Statistical considerations about CPLMs • Application – Climatological maps • Return Levels – Prediction Marta Nogaj (marta. nogaj@cea. fr) Laboratoire des Sciences du Climat et de l’Environnement
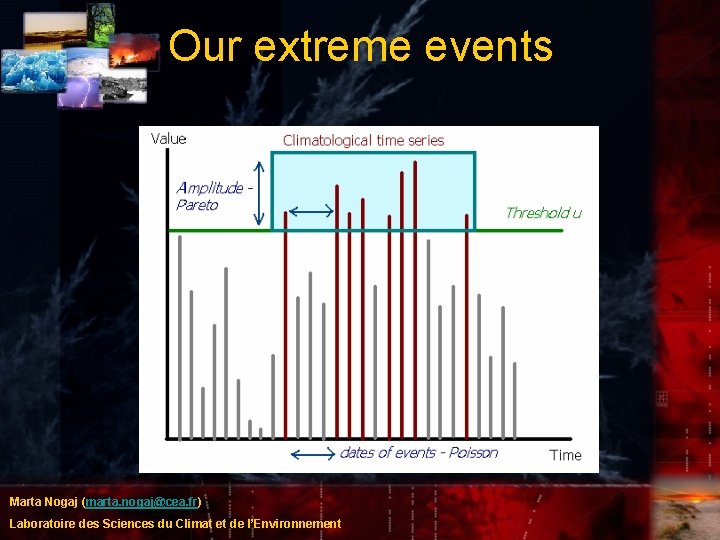
Our extreme events Marta Nogaj (marta. nogaj@cea. fr) Laboratoire des Sciences du Climat et de l’Environnement
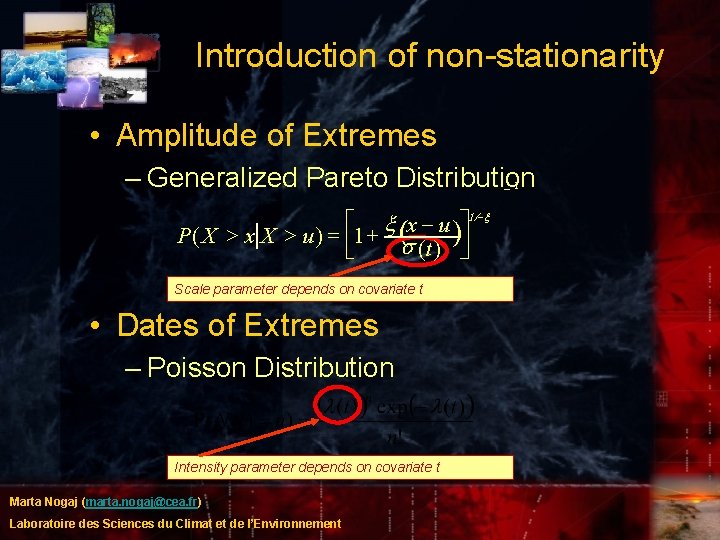
Introduction of non-stationarity • Amplitude of Extremes – Generalized Pareto Distribution 1 1/-x é ù x x u )ú P ( X > x X > u ) = ê 1 + (s t ( ) ë û Scale parameter depends on covariate t • Dates of Extremes – Poisson Distribution Intensity parameter depends on covariate t Marta Nogaj (marta. nogaj@cea. fr) Laboratoire des Sciences du Climat et de l’Environnement
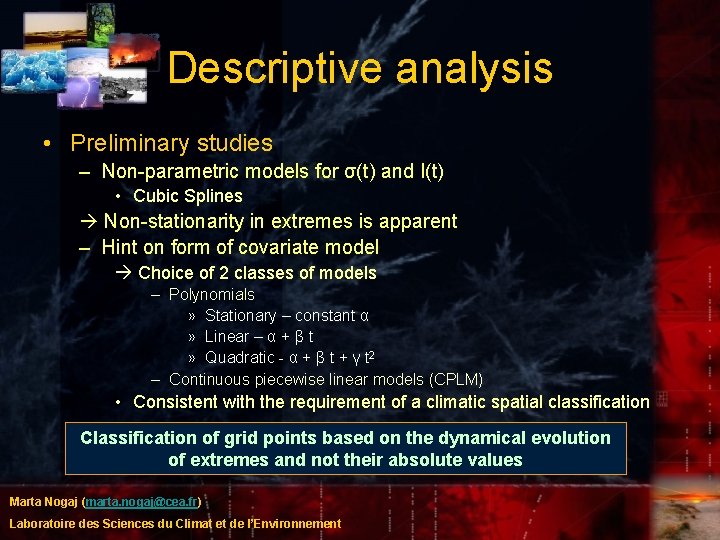
Descriptive analysis • Preliminary studies – Non-parametric models for σ(t) and I(t) • Cubic Splines Non-stationarity in extremes is apparent – Hint on form of covariate model Choice of 2 classes of models – Polynomials » Stationary – constant α » Linear – α + β t » Quadratic - α + β t + γ t 2 – Continuous piecewise linear models (CPLM) • Consistent with the requirement of a climatic spatial classification Classification of grid points based on the dynamical evolution • x of extremes and not their absolute values Marta Nogaj (marta. nogaj@cea. fr) Laboratoire des Sciences du Climat et de l’Environnement
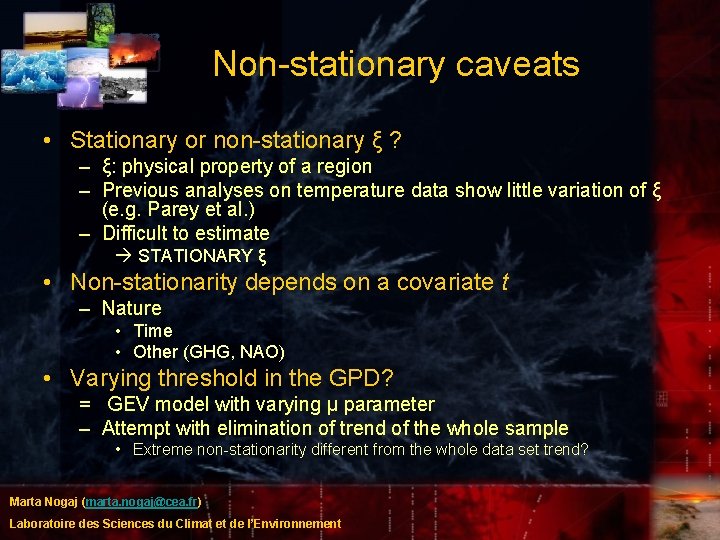
Non-stationary caveats • Stationary or non-stationary ξ ? – ξ: physical property of a region – Previous analyses on temperature data show little variation of ξ (e. g. Parey et al. ) – Difficult to estimate STATIONARY ξ • Non-stationarity depends on a covariate t – Nature • Time • Other (GHG, NAO) • Varying threshold in the GPD? = GEV model with varying μ parameter – Attempt with elimination of trend of the whole sample • Extreme non-stationarity different from the whole data set trend? Marta Nogaj (marta. nogaj@cea. fr) Laboratoire des Sciences du Climat et de l’Environnement
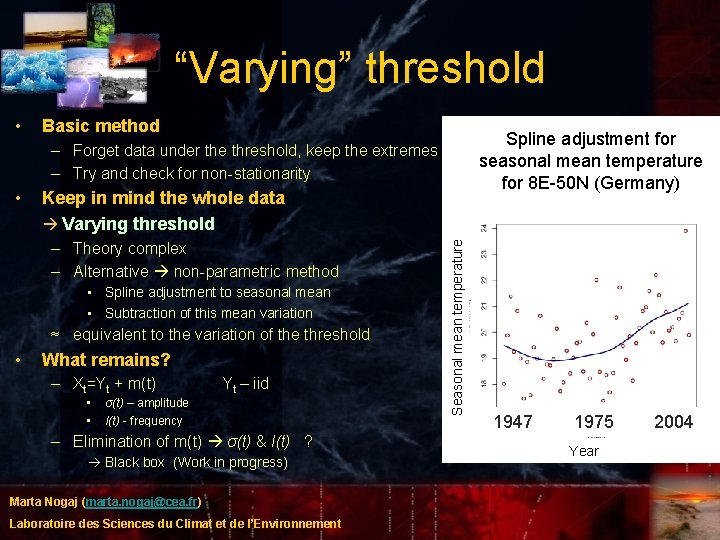
“Varying” threshold • Basic method Spline adjustment for seasonal mean temperature for 8 E-50 N (Germany) – Forget data under the threshold, keep the extremes – Try and check for non-stationarity Keep in mind the whole data Varying threshold – Theory complex – Alternative non-parametric method • Spline adjustment to seasonal mean • Subtraction of this mean variation ≈ equivalent to the variation of the threshold • What remains? – Xt=Yt + m(t) Yt – iid • • σ(t) – amplitude I(t) - frequency – Elimination of m(t) σ(t) & I(t) ? Black box (Work in progress) Marta Nogaj (marta. nogaj@cea. fr) Laboratoire des Sciences du Climat et de l’Environnement Seasonal mean temperature • 1947 1975 2004 Year
Method description for non-stationary GPD/Poisson • Parameter estimation – Maximum likelihood • Model choice for σ(t) & I(t) – Likelihood ratio test or an AIC • Best degree choice - polynomial • Best number of nodes – piecewise linear • Checking the adequacy of the models (polynomials) – Change of clock for the Poisson / Renormalization for GP – Classical tests • Uncertainty estimation – Confidence Intervals Marta Nogaj (marta. nogaj@cea. fr) Laboratoire des Sciences du Climat et de l’Environnement
Asymptotic properties • No obvious extension of the stationary EVT – Classical asymptotic theory does not always work – E. g. Malek & Nogaj 2005 • Linear Poisson Intensity – Convergence speeds to normal law differ for the 2 parameters • Quadratic Poisson Intensity – Non convergent (non trivial) estimator for the constant term – The highest degree is predominant when t ∞ – Confidence Intervals • Usage, as often proposed, of the observed information matrix is “perhaps” incorrect – Empirical information matrices might not converge – Solution • Analysis through simulations Marta Nogaj (marta. nogaj@cea. fr) Laboratoire des Sciences du Climat et de l’Environnement
Bypassing the lack of asymptotics • Analysis of previous procedure through simulation • GPD – Simulation of data from a GPD distribution with polynomial σ(t) • Poisson – Simulation of data from a Poisson distribution with polynomial I(t) using change of clock • Estimation from simulation repetitions – order (stationary/linear/quadratic) – parameters of models • Confidence Interval computation • Correction check Marta Nogaj (marta. nogaj@cea. fr) Laboratoire des Sciences du Climat et de l’Environnement
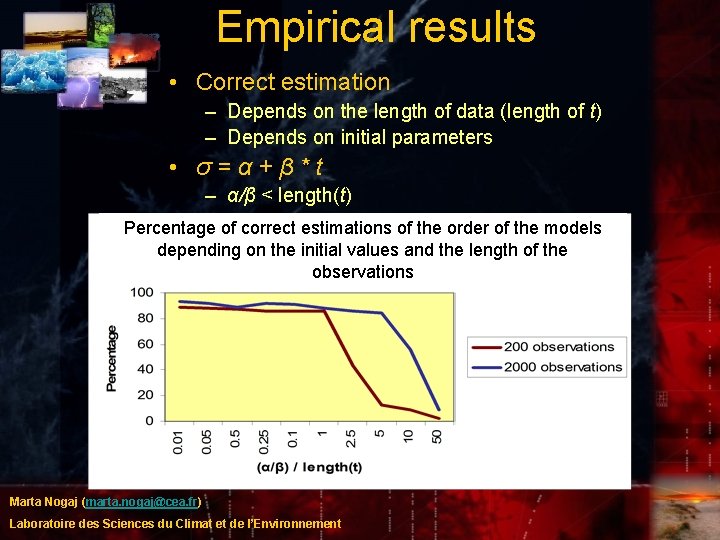
Empirical results • Correct estimation – Depends on the length of data (length of t) – Depends on initial parameters • σ=α+β*t – α/β < length(t) Percentage of correct estimations of the order of the models depending on the initial values and the length of the observations Marta Nogaj (marta. nogaj@cea. fr) Laboratoire des Sciences du Climat et de l’Environnement
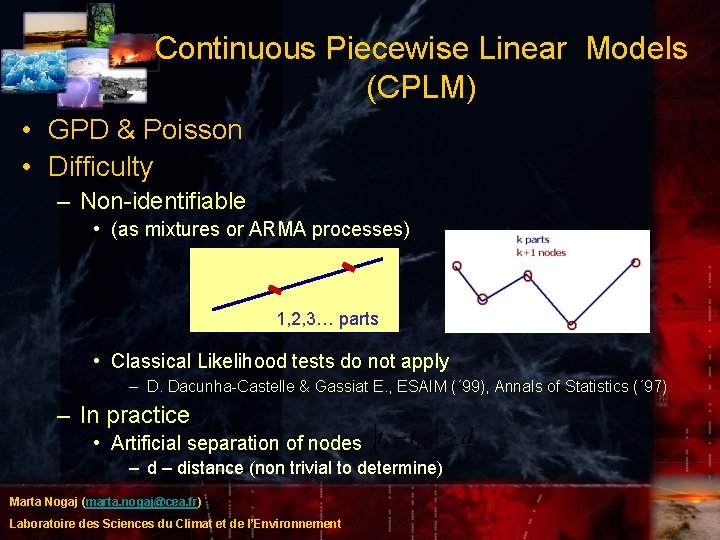
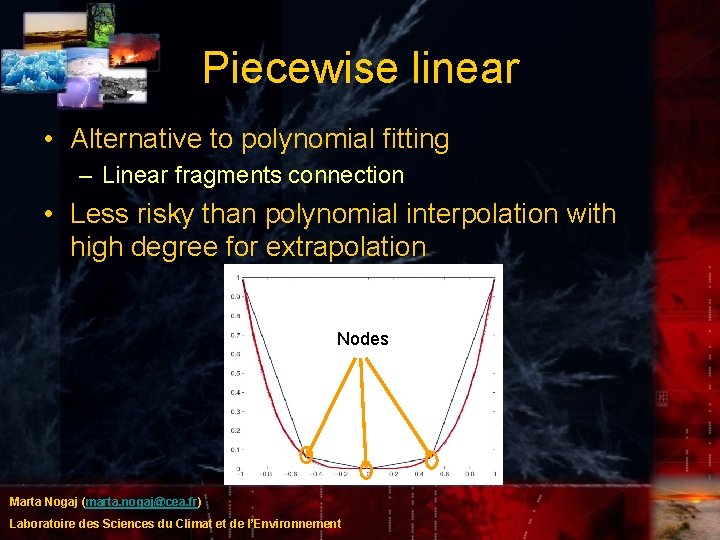
Continuous Piecewise Linear Models (CPLM) • GPD & Poisson • Difficulty – Non-identifiable • (as mixtures or ARMA processes) 1, 2, 3… parts • Classical Likelihood tests do not apply – D. Dacunha-Castelle & Gassiat E. , ESAIM (´ 99), Annals of Statistics (´ 97) – In practice • Artificial separation of nodes – distance (non trivial to determine) Marta Nogaj (marta. nogaj@cea. fr) Laboratoire des Sciences du Climat et de l’Environnement
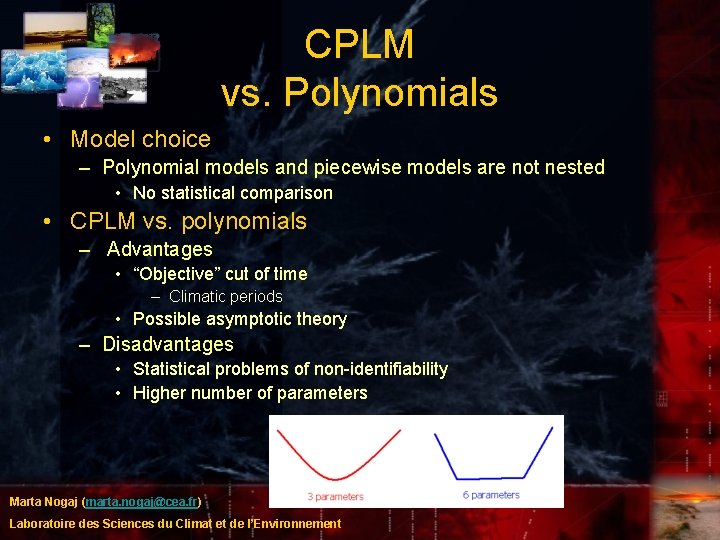
CPLM vs. Polynomials • Model choice – Polynomial models and piecewise models are not nested • No statistical comparison • CPLM vs. polynomials – Advantages • “Objective” cut of time – Climatic periods • Possible asymptotic theory – Disadvantages • Statistical problems of non-identifiability • Higher number of parameters Marta Nogaj (marta. nogaj@cea. fr) Laboratoire des Sciences du Climat et de l’Environnement
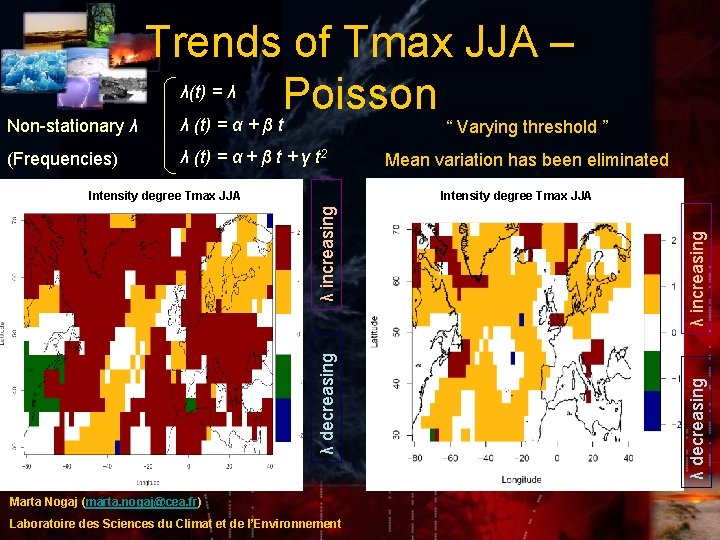
Application • Data – NCEP Reanalyses – Daily extreme data • 1947 -2004 – Temperature MAX/MIN – Summer (JJA)/ Winter (DJF) – North-Atlantic • Lat: 30 N to 70 N • Lon: 80 W to 40 E – Covariate • Time Marta Nogaj (marta. nogaj@cea. fr) Laboratoire des Sciences du Climat et de l’Environnement
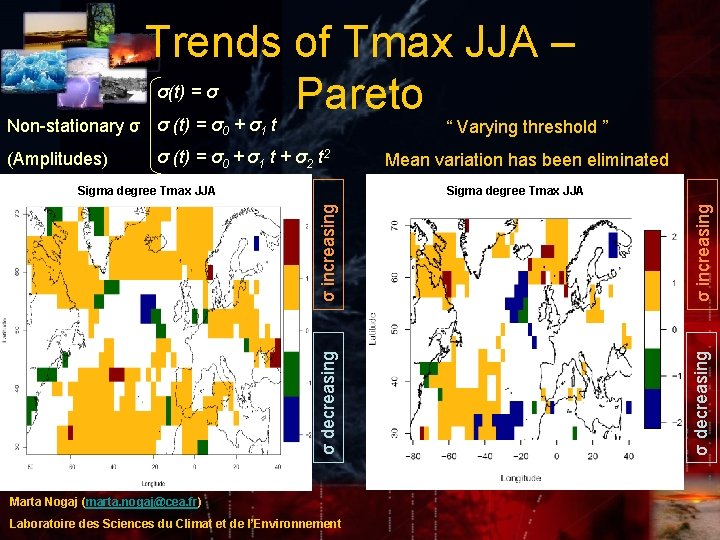
Non-stationary σ (Amplitudes) Trends of Tmax JJA – σ(t) = σ Pareto σ (t) = σ + σ t 0 “ Varying threshold ” 1 σ (t) = σ0 + σ1 t + σ2 t 2 σ increasing σ decreasing Sigma degree Tmax JJA Mean variation has been eliminated Marta Nogaj (marta. nogaj@cea. fr) Laboratoire des Sciences du Climat et de l’Environnement
λ (t) = α + β t + γ t 2 Intensity degree Tmax JJA λ decreasing λ increasing Intensity degree Tmax JJA Mean variation has been eliminated Marta Nogaj (marta. nogaj@cea. fr) Laboratoire des Sciences du Climat et de l’Environnement λ increasing (Frequencies) “ Varying threshold ” λ decreasing Non-stationary λ Trends of Tmax JJA – λ(t) = λ Poisson λ (t) = α + β t
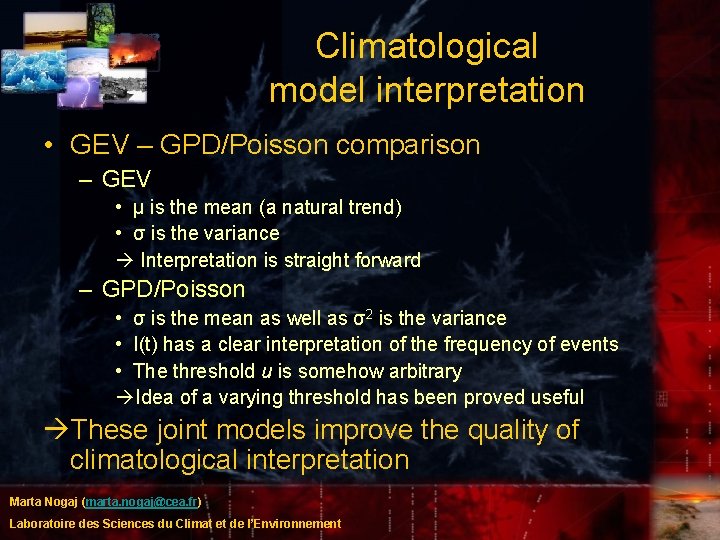
Climatological model interpretation • GEV – GPD/Poisson comparison – GEV • μ is the mean (a natural trend) • σ is the variance Interpretation is straight forward – GPD/Poisson • σ is the mean as well as σ2 is the variance • I(t) has a clear interpretation of the frequency of events • The threshold u is somehow arbitrary Idea of a varying threshold has been proved useful These joint models improve the quality of climatological interpretation Marta Nogaj (marta. nogaj@cea. fr) Laboratoire des Sciences du Climat et de l’Environnement
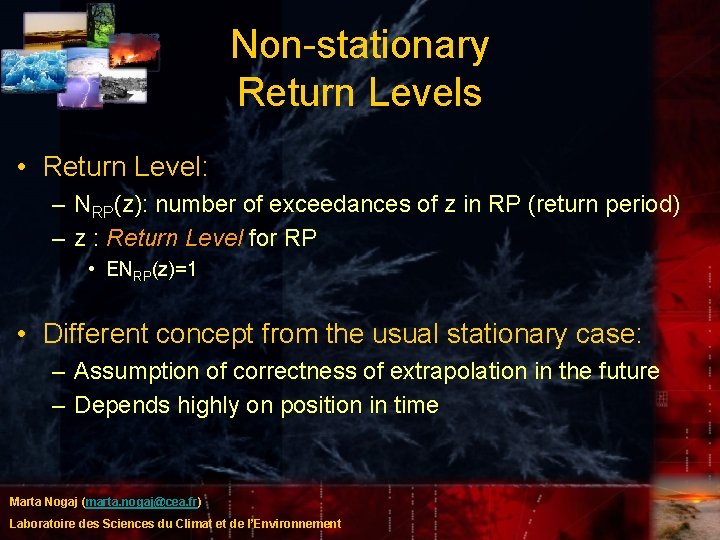
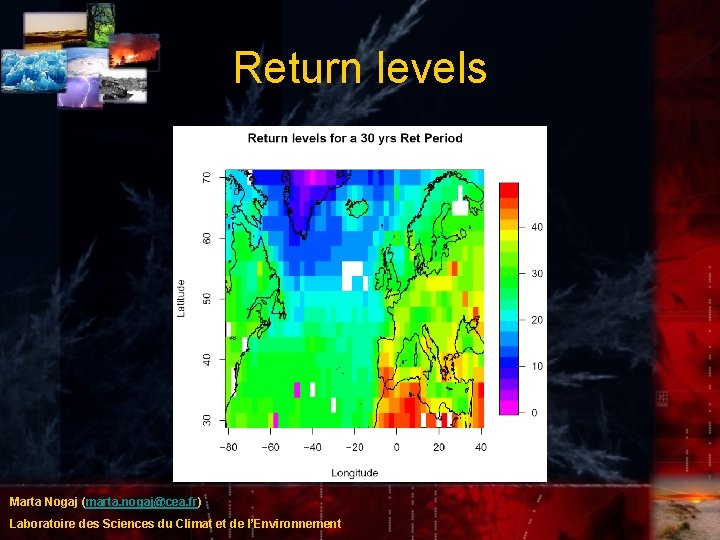
Non-stationary Return Levels • Return Level: – NRP(z): number of exceedances of z in RP (return period) – z : Return Level for RP • ENRP(z)=1 • Different concept from the usual stationary case: – Assumption of correctness of extrapolation in the future – Depends highly on position in time Marta Nogaj (marta. nogaj@cea. fr) Laboratoire des Sciences du Climat et de l’Environnement
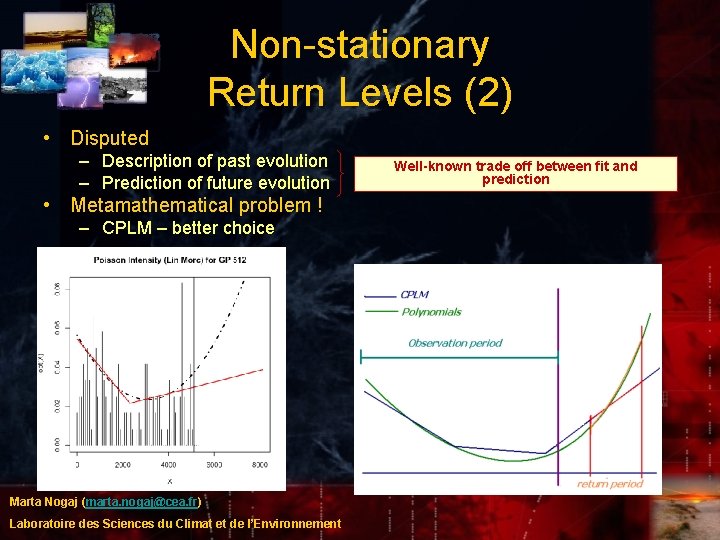
Non-stationary Return Levels (2) • Disputed – Description of past evolution – Prediction of future evolution • Metamathematical problem ! – CPLM – better choice Marta Nogaj (marta. nogaj@cea. fr) Laboratoire des Sciences du Climat et de l’Environnement Well-known trade off between fit and prediction
Final Quizz • Climatological question – Are extreme events varying? – Is the variation of extreme events similar to the variation of the average and the variance? • Statistical question – Can we estimate extreme values variability? – Can we adapt theory to a non-stationary context? • Statistical answer – Possible trend detection in extreme events – Connected statistical problems have been identified & analyzed BE CAREFUL! • Climatological answer – Detected regions of the dynamical variation of extreme events • Amplitude / Occurrence – “Varying threshold” method used to “separate” extreme variability from the average field – Different covariates allowed us to investigate the cause of the trend in extremes • GHG – comparable with monotonic trend (time) • NAO – no major effect on extreme climate Marta Nogaj (marta. nogaj@cea. fr) Laboratoire des Sciences du Climat et de l’Environnement
But is it “final” ? • Climatological perspectives – Other covariates: • THC, weather regimes, land use percentage, solar constant – Analyses of model simulations • IPSL, other time periods – Other physical domains (E 2 C 2 program) • Geophysics, Hydrology • Statistical perspectives – Introduction of a “spatial” context – Analysis of “clusters” • Length of extremes + droughts Marta Nogaj (marta. nogaj@cea. fr) Laboratoire des Sciences du Climat et de l’Environnement
Thank You! R project: http: //www. r-project. com CLIMSTAT: http: //www. ipsl. jussieu. fr/CLIMSTAT/ Nogaj et al. , “Intensity and frequency of Temperature Extremes over the North Atlantic Region”, GRL (submitted 2005) Malek F. and Nogaj M. , “Asymptotique des Poissons non-stationnaires”, Canadian Statistical Journal (submitted 2005) D. Dacunha-Castelle and E. Gassiat , ”Testing the order of a model using locally conic parameterization: population mixtures and stationary ARMA processes“ Annals of Stat. , 27, 4, 1178 -1209, 1999. D. Dacunha-Castelle and E. Gassiat, “Testing in locally conic models and application to mixture models” ESAIM P et S, 1, 1997. Parey S. et al. , “Trends in extreme high temperatures in France: statistical approach and results”, Climate Change (submitted 2005 ) Naveau P. et al. Statistical Analysis of Climate Extremes. ``Comptes rendus Geosciences de l'Academie des Sciences". (2005, in press) Coles S. (2001) An Introduction to Statistical Modeling of Extreme Values, Springer Verlag Davison A and Smith R. (1990) Models for exceedances over high thresholds. Journal of the Royal Statistical Society, 52, 393 -442. Marta Nogaj (marta. nogaj@cea. fr) Laboratoire des Sciences du Climat et de l’Environnement
Marta Nogaj (marta. nogaj@cea. fr) Laboratoire des Sciences du Climat et de l’Environnement
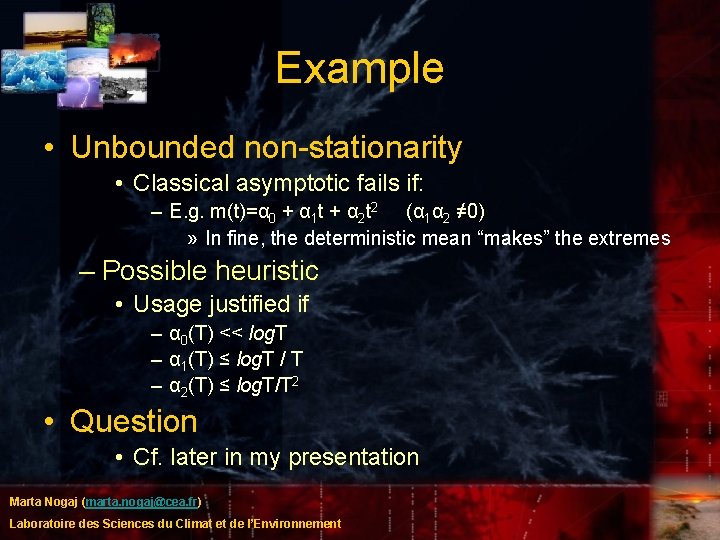
Example • Unbounded non-stationarity • Classical asymptotic fails if: – E. g. m(t)=α 0 + α 1 t + α 2 t 2 (α 1α 2 ≠ 0) » In fine, the deterministic mean “makes” the extremes – Possible heuristic • Usage justified if – α 0(T) << log. T – α 1(T) ≤ log. T / T – α 2(T) ≤ log. T/T 2 • Question • Cf. later in my presentation Marta Nogaj (marta. nogaj@cea. fr) Laboratoire des Sciences du Climat et de l’Environnement
General method validation - GPD Marta Nogaj (marta. nogaj@cea. fr) Laboratoire des Sciences du Climat et de l’Environnement
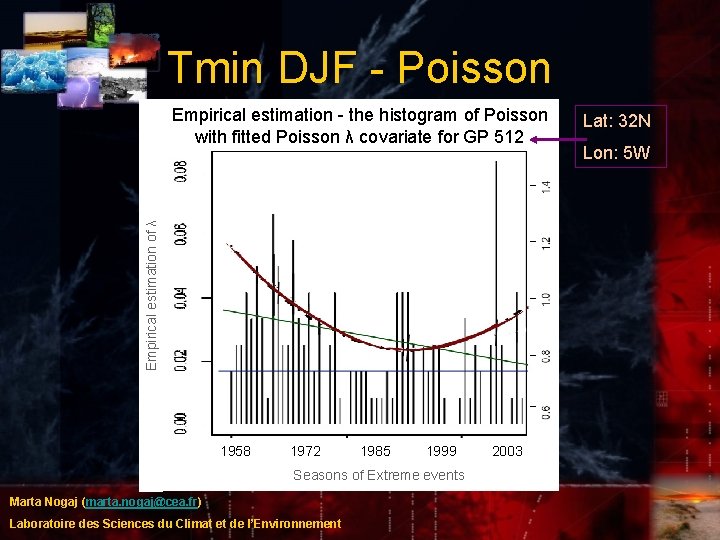
Tmin DJF - Poisson Empirical estimation of λ Empirical estimation - the histogram of Poisson with fitted Poisson λ covariate for GP 512 1958 1972 1985 1999 2003 Seasons of Extreme events Marta Nogaj (marta. nogaj@cea. fr) Laboratoire des Sciences du Climat et de l’Environnement Lat: 32 N Lon: 5 W
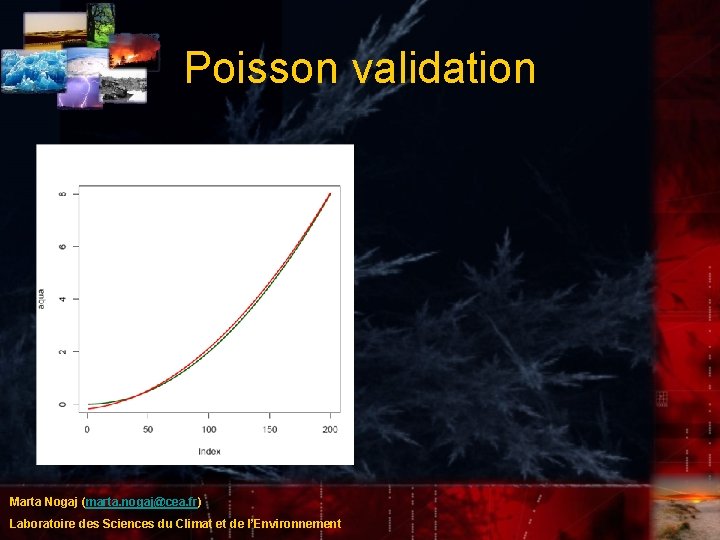
Poisson validation Marta Nogaj (marta. nogaj@cea. fr) Laboratoire des Sciences du Climat et de l’Environnement
GPD validation linear Marta Nogaj (marta. nogaj@cea. fr) Laboratoire des Sciences du Climat et de l’Environnement
GPD validation linear Marta Nogaj (marta. nogaj@cea. fr) Laboratoire des Sciences du Climat et de l’Environnement
Return levels Marta Nogaj (marta. nogaj@cea. fr) Laboratoire des Sciences du Climat et de l’Environnement
Piecewise linear • Alternative to polynomial fitting – Linear fragments connection • Less risky than polynomial interpolation with high degree for extrapolation Nodes Marta Nogaj (marta. nogaj@cea. fr) Laboratoire des Sciences du Climat et de l’Environnement
General method validation - GPD Marta Nogaj (marta. nogaj@cea. fr) Laboratoire des Sciences du Climat et de l’Environnement
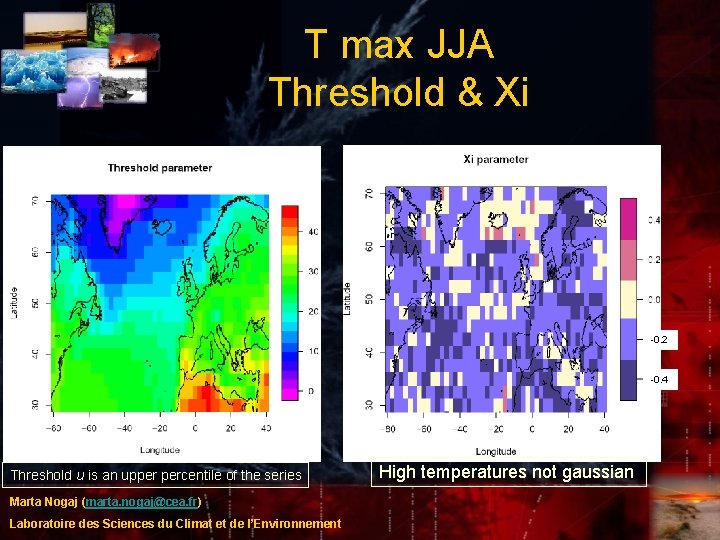
T max JJA Threshold & Xi -0. 2 -0. 4 Threshold u is an upper percentile of the series Marta Nogaj (marta. nogaj@cea. fr) Laboratoire des Sciences du Climat et de l’Environnement High temperatures not gaussian