Analysis of MLB Stadiums Across North America By

Analysis of MLB Stadiums Across North America By: Daniel Sanders and Caroline Sevila


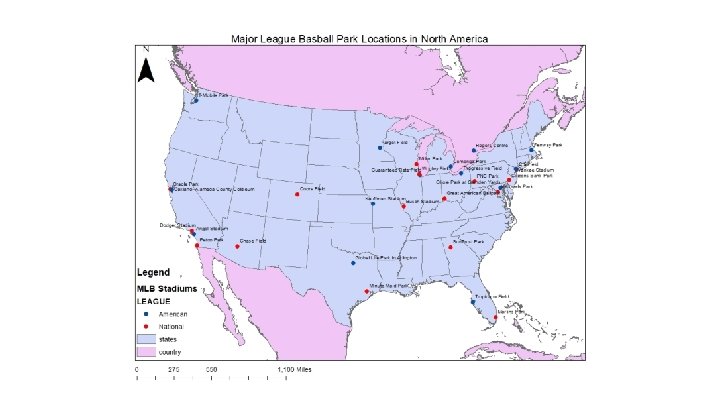
Major League Baseball Park Locations in North America This map shows the locations of all 30 Major League Baseball parks in North America. This includes the twenty-nine teams located in the United States and the one team located in Canada. The parks that are shown in red represent the National League teams and the parks that are shown in blue represent the American League teams.

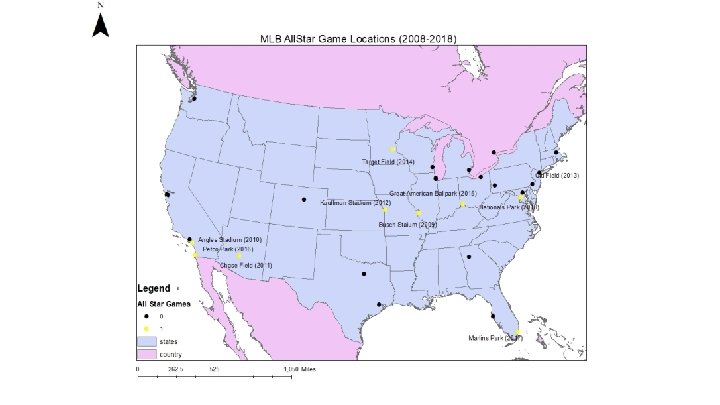
 In the MLB every season there is")
MLB All Star Game Locations (2008 -2018) In the MLB every season there is an All Star weekend and it's held at a different stadium every year. This map shows all the stadiums that the All Star weekend was held for the past 10 years. The black points on the map display stadiums that a All Star weekend wasn’t held in the past 10 years, and the yellow points display where the All Star weekend was help and its respected year.
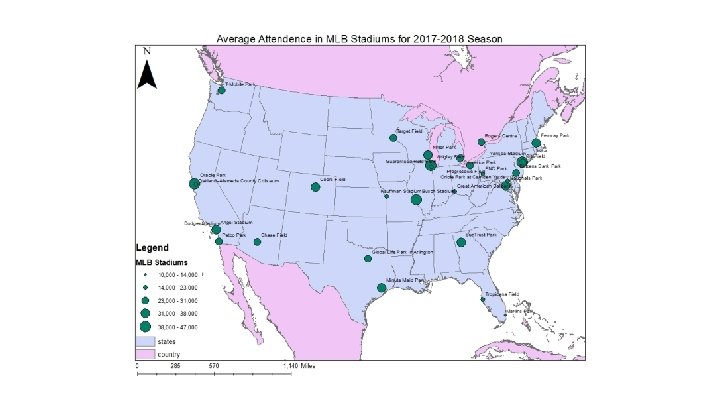
 This map represents the average attendance per")
Average Attendance For MLB Stadiums (2017 -2018) This map represents the average attendance per stadium during the 2017 -2018 MLB season. The larger points represent the stadiums with a higher average attendance and the stadiums with a smaller point represent the stadiums with a lower average attendance. The attendance averages range from 10, 000 people per game to 47, 000 people per game.

Conclusion Baseball is the national pastime for the United States of America. It is clear that people across North America love baseball. These maps analyze the locations of each park by showing the league each team belongs to, the All Star game locations from the past ten years and the average attendance for each stadium.

Analysis of MLB Stadiums Across North America By: Daniel Sanders and Caroline Sevila

Major League Baseball Park Locations in North America This map shows the locations of all 30 Major League Baseball parks in North America. This includes the twenty-nine teams located in the United States and the one team located in Canada. The parks that are shown in red represent the National League teams and the parks that are shown in blue represent the American League teams.
 In the MLB every season there is")
MLB All Star Game Locations (2008 -2018) In the MLB every season there is an All Star weekend and it's held at a different stadium every year. This map shows all the stadiums that the All Star weekend was held for the past 10 years. The black points on the map display stadiums that a All Star weekend wasn’t held in the past 10 years, and the yellow points display where the All Star weekend was help and its respected year.

 This map represents the average attendance per")
Average Attendance For MLB Stadiums (2017 -2018) This map represents the average attendance per stadium during the 2017 -2018 MLB season. The larger points represent the stadiums with a higher average attendance and the stadiums with a smaller point represent the stadiums with a lower average attendance. The attendance averages range from 10, 000 people per game to 47, 000 people per game.

Conclusion Baseball is the national pastime for the United States of America. It is clear that people across North America love baseball. These maps analyze the locations of each park by showing the league each team belongs to, the All Star game locations from the past ten years and the average attendance for each stadium.
- Slides: 16