
Analysis of Loan Quality and Losses for Direct









- Slides: 25
Analysis of Loan Quality and Losses for Direct Auto-Marine and Direct Real Estate Loans Prepared for Hibernia National Bank Management. May 2 nd, 2000. Presented by: • • Soad Abuhawas Fabiana Cardetti Susan Russell Scott Sorrell
Contents: Identification of Loan Originations and Loan Prepayments Static Pool Analysis with illustrations Revenue and Charge-off Activity by Tier for each month Summary
Direct Auto-Marine Loans
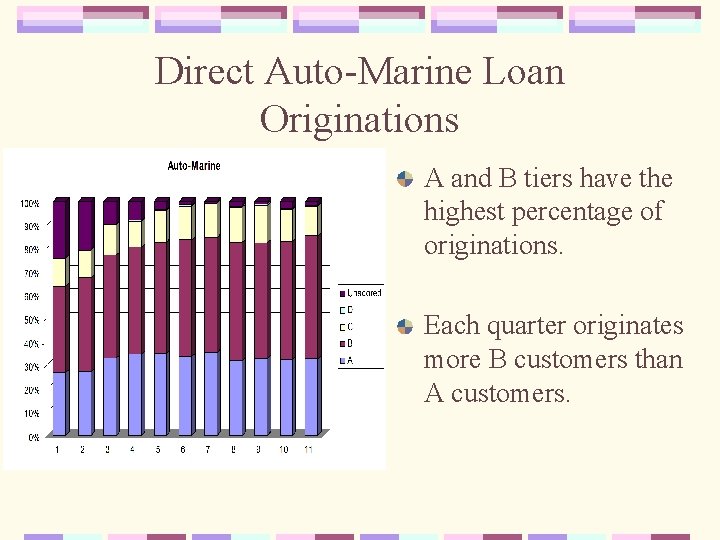
Direct Auto-Marine Loan Originations A and B tiers have the highest percentage of originations. Each quarter originates more B customers than A customers.
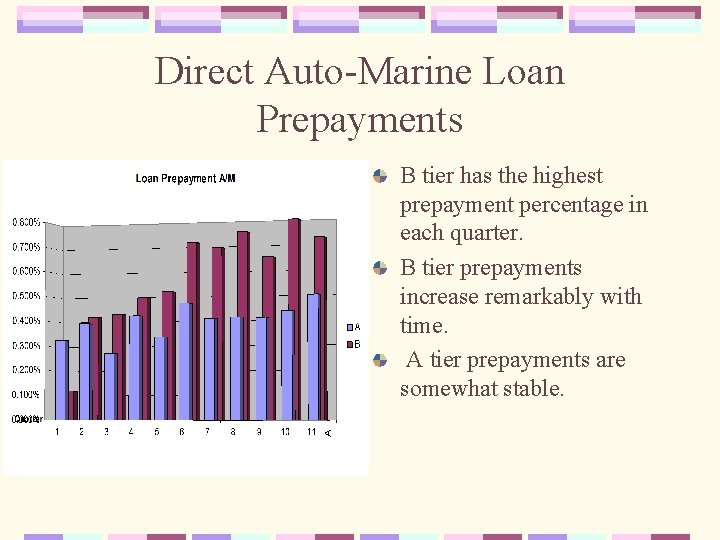
Direct Auto-Marine Loan Prepayments B tier has the highest prepayment percentage in each quarter. B tier prepayments increase remarkably with time. A tier prepayments are somewhat stable.
Static Pool Analysis of Auto-Marine Loans
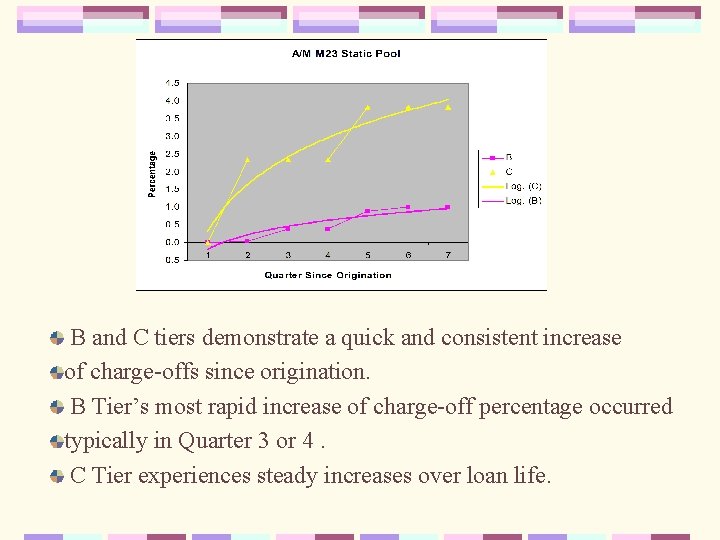
B and C tiers demonstrate a quick and consistent increase of charge-offs since origination. B Tier’s most rapid increase of charge-off percentage occurred typically in Quarter 3 or 4. C Tier experiences steady increases over loan life.
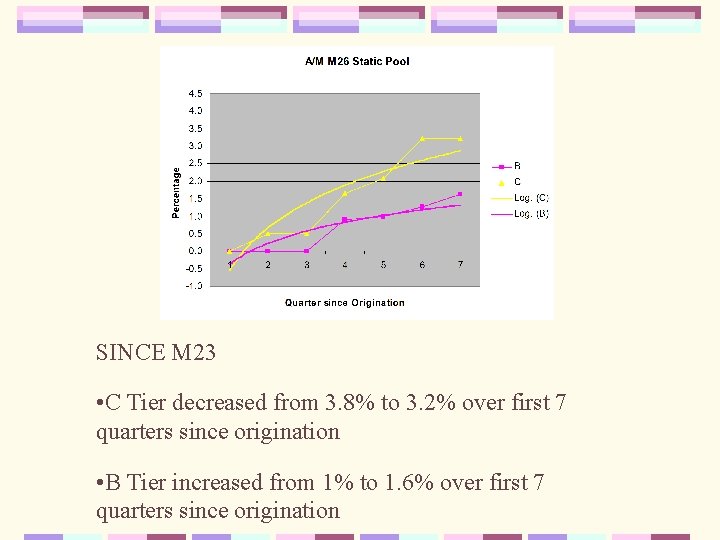
SINCE M 23 • C Tier decreased from 3. 8% to 3. 2% over first 7 quarters since origination • B Tier increased from 1% to 1. 6% over first 7 quarters since origination
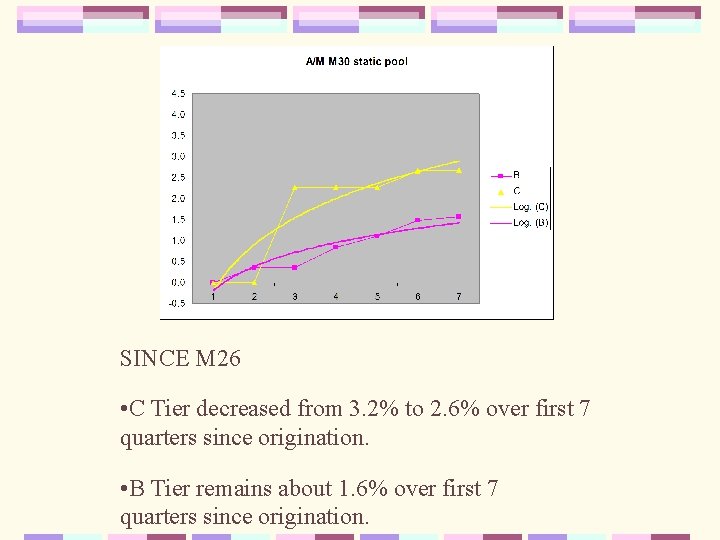
SINCE M 26 • C Tier decreased from 3. 2% to 2. 6% over first 7 quarters since origination. • B Tier remains about 1. 6% over first 7 quarters since origination.
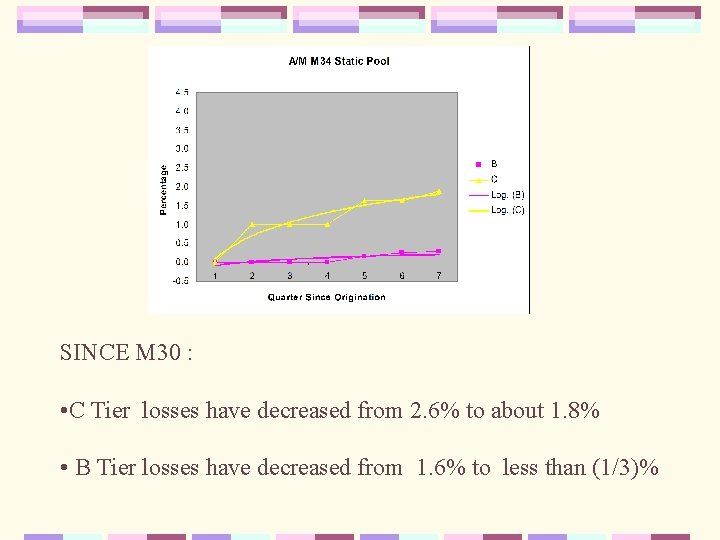
SINCE M 30 : • C Tier losses have decreased from 2. 6% to about 1. 8% • B Tier losses have decreased from 1. 6% to less than (1/3)%
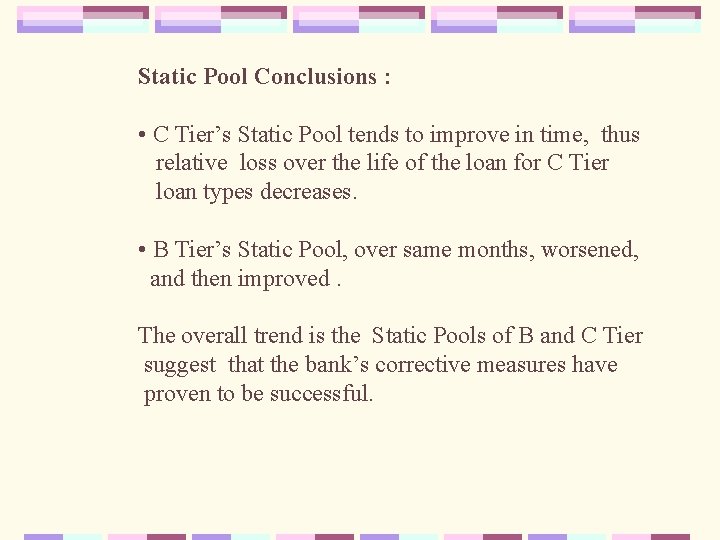
Static Pool Conclusions : • C Tier’s Static Pool tends to improve in time, thus relative loss over the life of the loan for C Tier loan types decreases. • B Tier’s Static Pool, over same months, worsened, and then improved. The overall trend is the Static Pools of B and C Tier suggest that the bank’s corrective measures have proven to be successful.
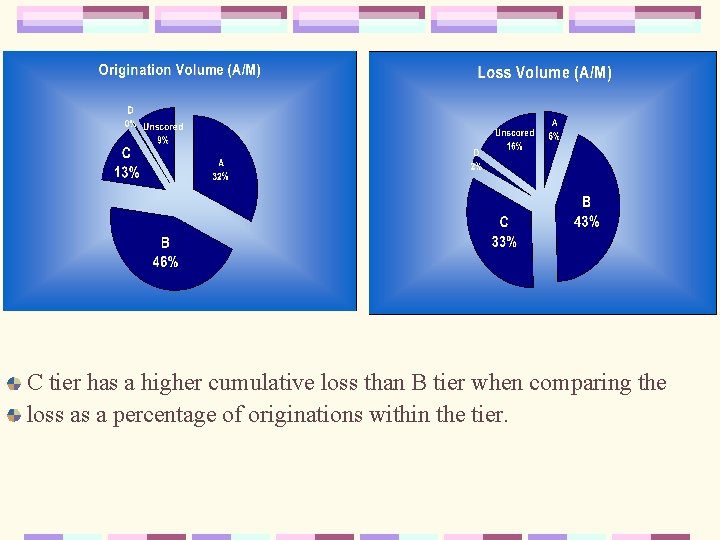
C tier has a higher cumulative loss than B tier when comparing the loss as a percentage of originations within the tier.
Analysis of Bank’s Revenue from Direct Auto-Marine Loans
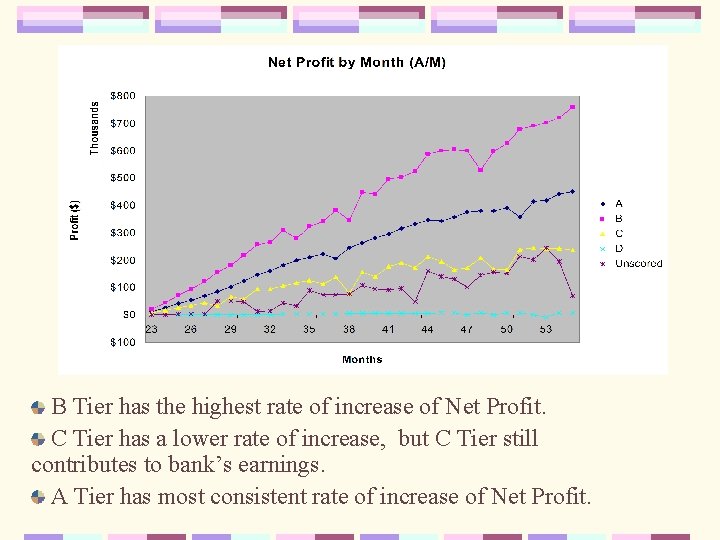
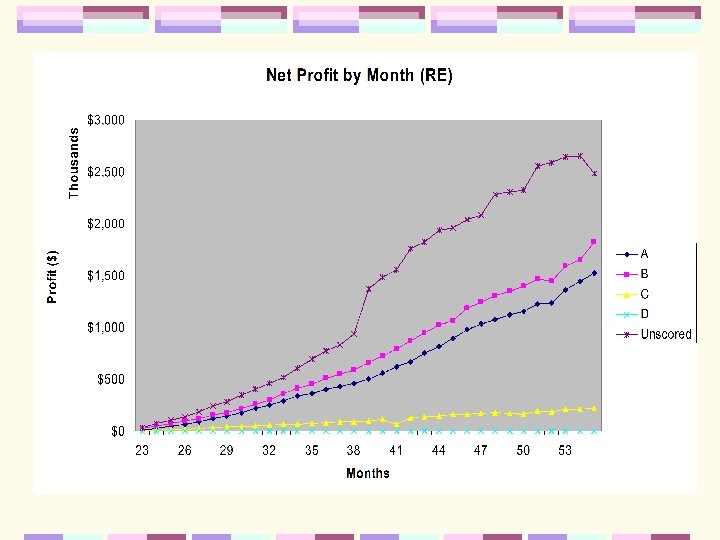
B Tier has the highest rate of increase of Net Profit. C Tier has a lower rate of increase, but C Tier still contributes to bank’s earnings. A Tier has most consistent rate of increase of Net Profit.
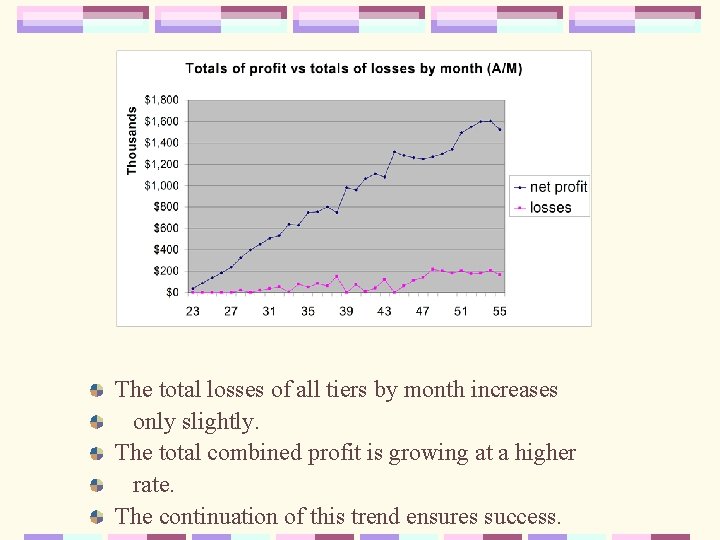
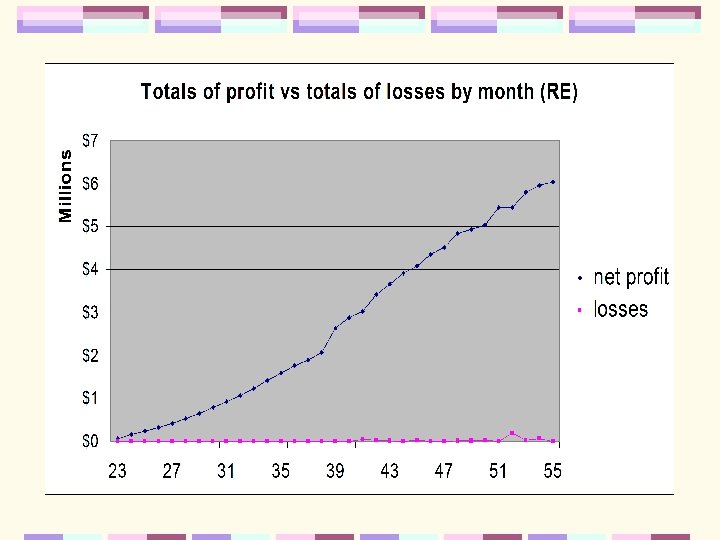
The total losses of all tiers by month increases only slightly. The total combined profit is growing at a higher rate. The continuation of this trend ensures success.
Direct Real Estate Loans
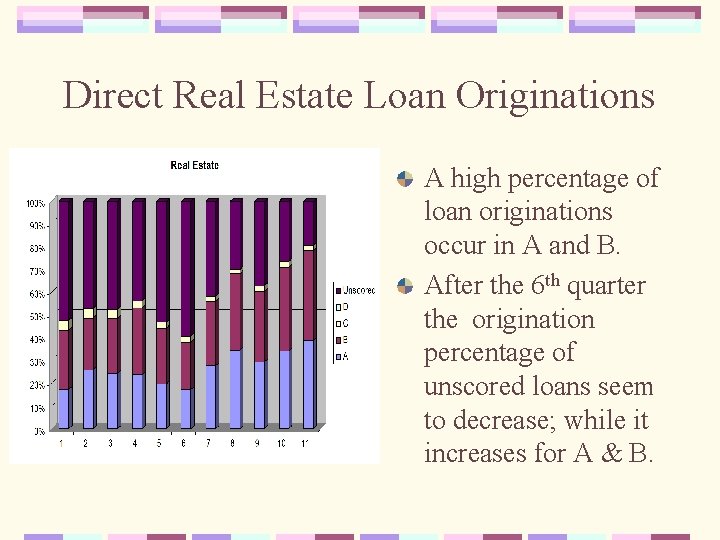
Direct Real Estate Loan Originations A high percentage of loan originations occur in A and B. After the 6 th quarter the origination percentage of unscored loans seem to decrease; while it increases for A & B.
Direct Real Estate Loan Prepayments A & B tiers has the highest prepayment percentage. The growth of both tiers volume seem to be almost the same in most quarters. The volume of both tiers increases from quarter to quarter.
Static Pool Analysis of Real Estate Loans
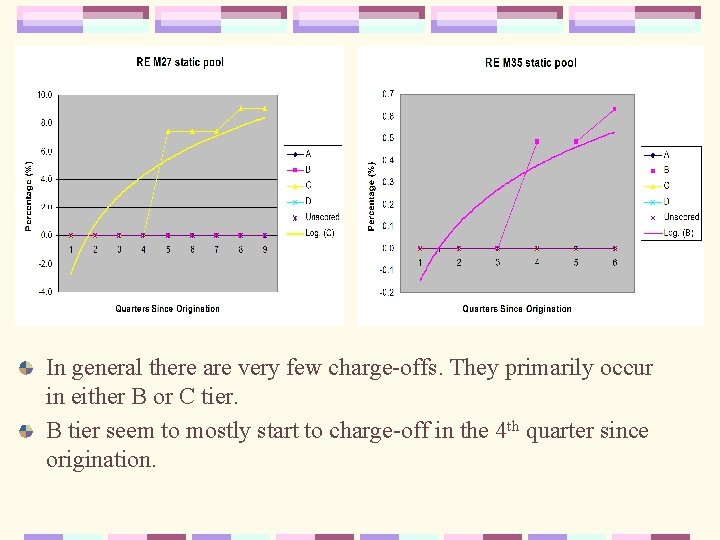
In general there are very few charge-offs. They primarily occur in either B or C tier. B tier seem to mostly start to charge-off in the 4 th quarter since origination.
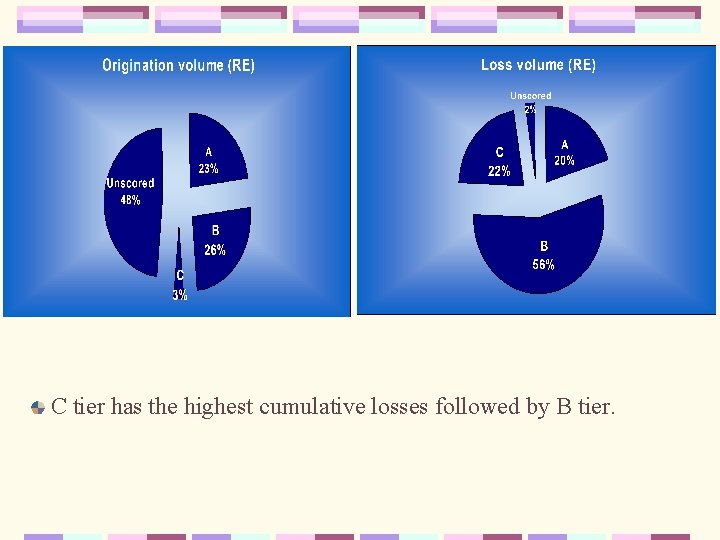
C tier has the highest cumulative losses followed by B tier.
Analysis of Bank’s Revenue from Direct Real Estate Loans
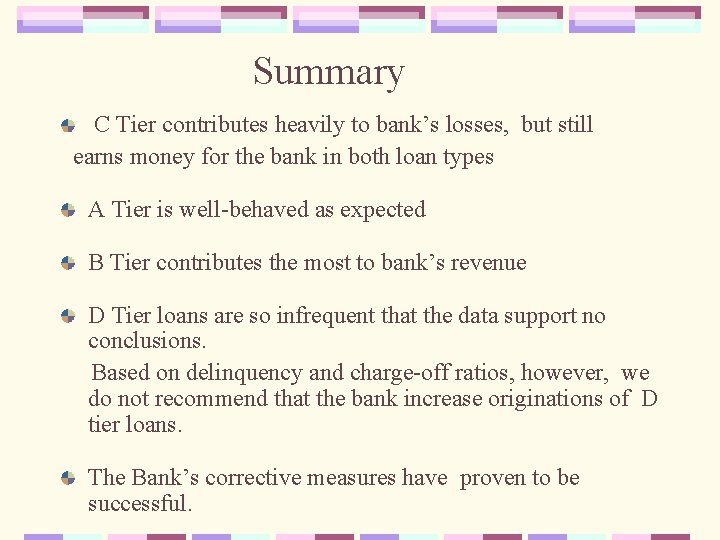
Summary C Tier contributes heavily to bank’s losses, but still earns money for the bank in both loan types A Tier is well-behaved as expected B Tier contributes the most to bank’s revenue D Tier loans are so infrequent that the data support no conclusions. Based on delinquency and charge-off ratios, however, we do not recommend that the bank increase originations of D tier loans. The Bank’s corrective measures have proven to be successful.