Analysis of coal production severance tax revenues and
- Slides: 18
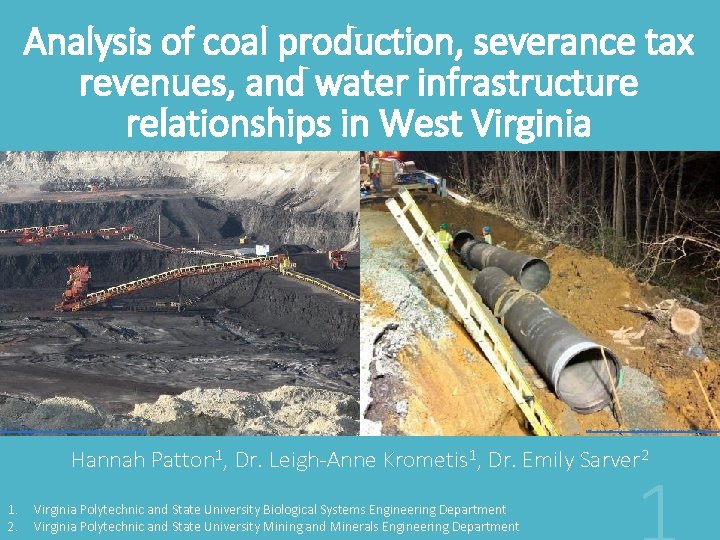
Analysis of coal production, severance tax revenues, and water infrastructure relationships in West Virginia https: //www. wyomingpublicmedia. org/post/inside-energy-western-coal-country-wyomings-industry-runs-deep#stream/0 https: //wtop. com/prince-georges-county/2019/04/boil-water-advisory-issued-for-southern-prince-georges-co/ Hannah Patton 1, Dr. Leigh-Anne Krometis 1, Dr. Emily Sarver 2 1. 2. Virginia Polytechnic and State University Biological Systems Engineering Department Virginia Polytechnic and State University Mining and Minerals Engineering Department
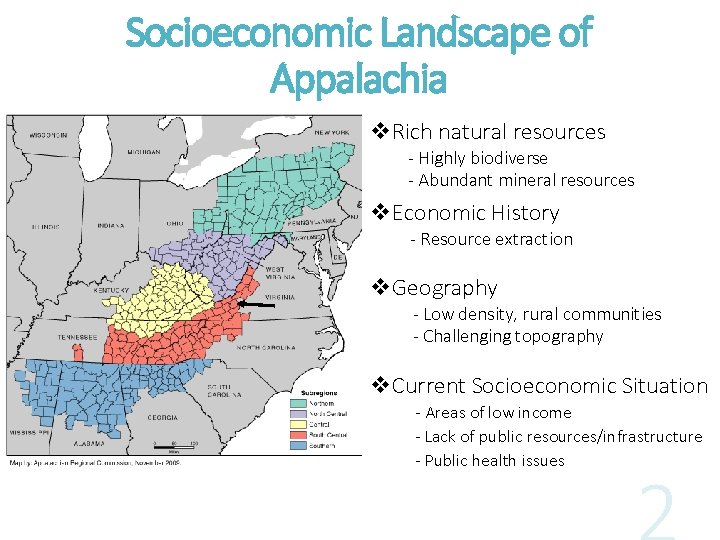
Socioeconomic Landscape of Appalachia v. Rich natural resources - Highly biodiverse - Abundant mineral resources v. Economic History - Resource extraction v. Geography - Low density, rural communities - Challenging topography v. Current Socioeconomic Situation - Areas of low income - Lack of public resources/infrastructure - Public health issues
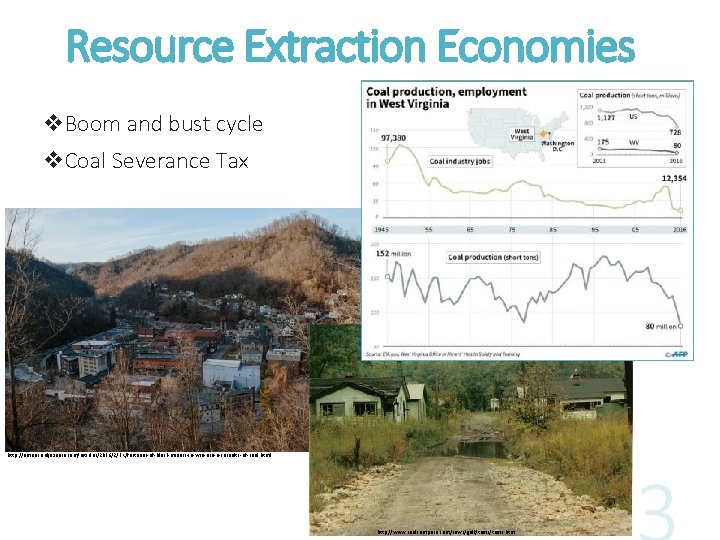
Resource Extraction Economies v. Boom and bust cycle v. Coal Severance Tax http: //america. aljazeera. com/articles/2016/2/14/fortunes-of-black-miners-in-wva-are-a-casualty-of-coal. html http: //www. coalcampusa. com/sowv/gulf/tams. htm
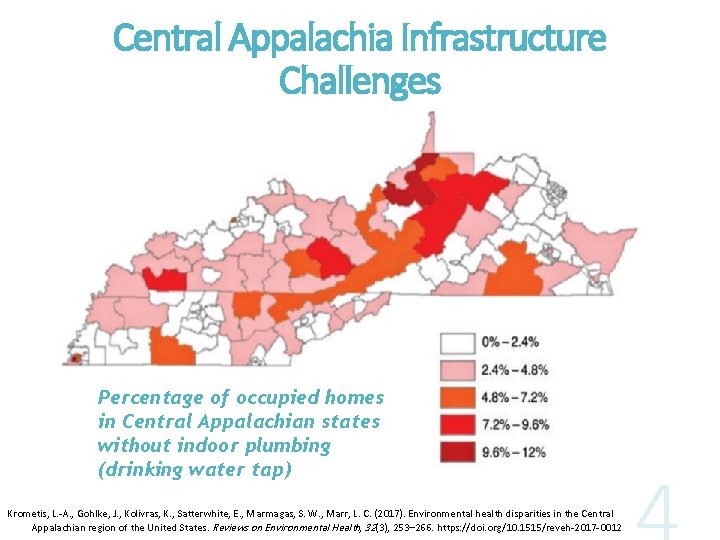
Central Appalachia Infrastructure Challenges Percentage of occupied homes in Central Appalachian states without indoor plumbing (drinking water tap) Krometis, L. -A. , Gohlke, J. , Kolivras, K. , Satterwhite, E. , Marmagas, S. W. , Marr, L. C. (2017). Environmental health disparities in the Central Appalachian region of the United States. Reviews on Environmental Health, 32(3), 253– 266. https: //doi. org/10. 1515/reveh-2017 -0012
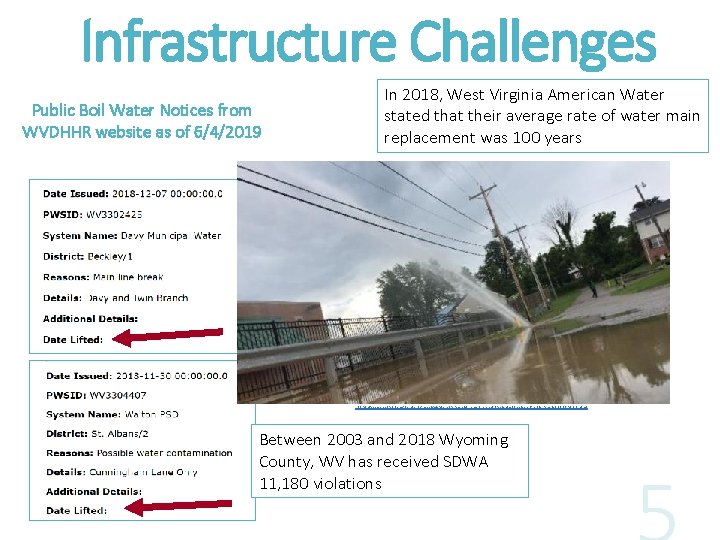
Infrastructure Challenges Public Boil Water Notices from WVDHHR website as of 6/4/2019 In 2018, West Virginia American Water stated that their average rate of water main replacement was 100 years https: //www. wsaz. com/content/news/Water-spraying-from-ground-causing-issues-in-Cross-Lanes-427310113. html Between 2003 and 2018 Wyoming County, WV has received SDWA 11, 180 violations
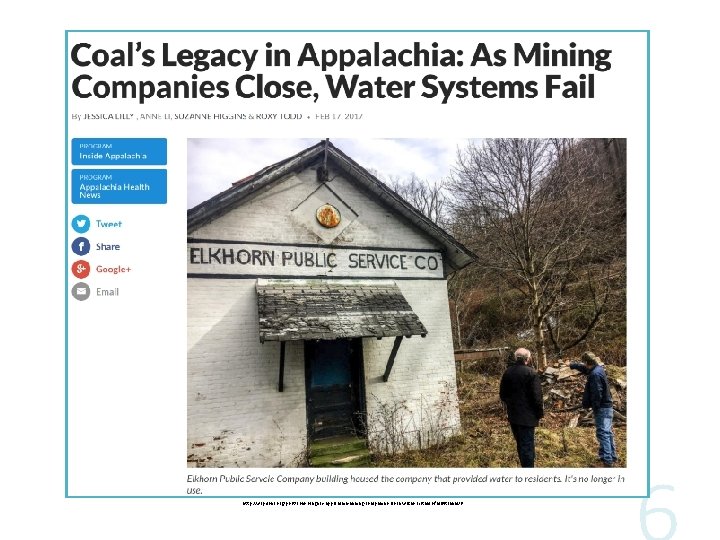
http: //wvpublic. org/post/coal-s-legacy-appalachia-mining-companies-close-water-systems-fail#stream/0
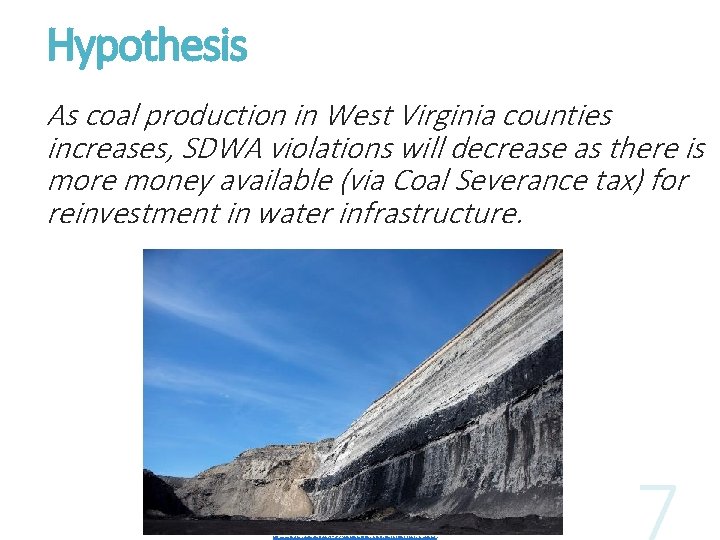
Hypothesis As coal production in West Virginia counties increases, SDWA violations will decrease as there is more money available (via Coal Severance tax) for reinvestment in water infrastructure. https: //www. brookings. edu/blog/the-avenue/2017/01/25/automation-guarantees-a-bleak-outlook-for-trumps-promises-to-coal-miners/
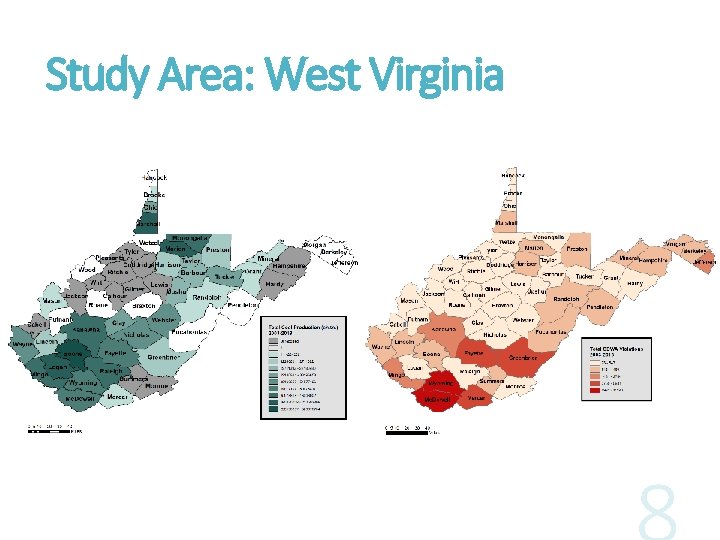
Study Area: West Virginia
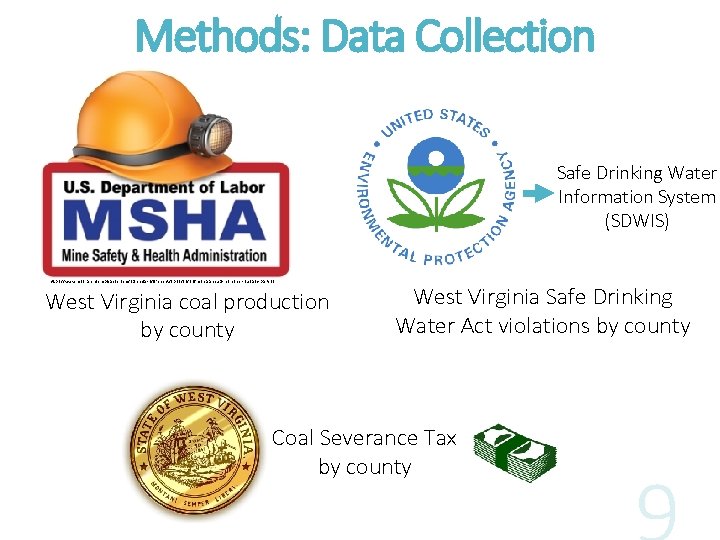
Methods: Data Collection Safe Drinking Water Information System (SDWIS) https: //www. mccrarencompliance. com/calendar-2/#!event/2018/11/16/msha-annual-refresher-surface-part-48 West Virginia coal production by county West Virginia Safe Drinking Water Act violations by county Coal Severance Tax by county
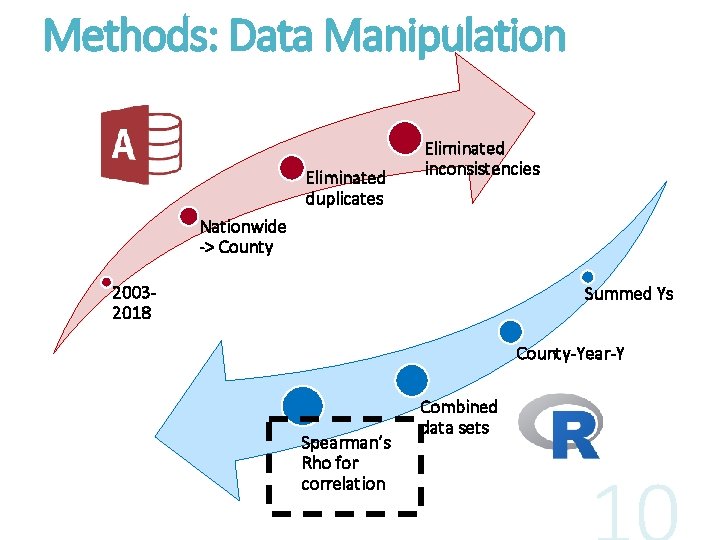
Methods: Data Manipulation Eliminated duplicates Eliminated inconsistencies Nationwide -> County 20032018 Summed Ys County-Year-Y Spearman’s Rho for correlation Combined data sets
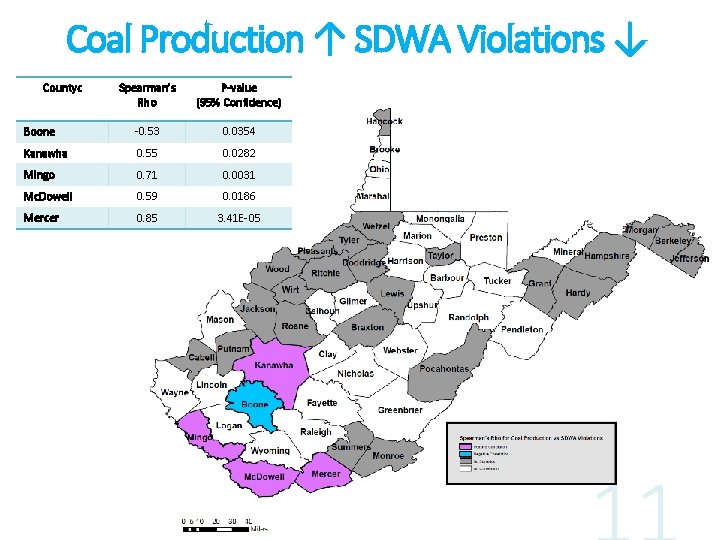
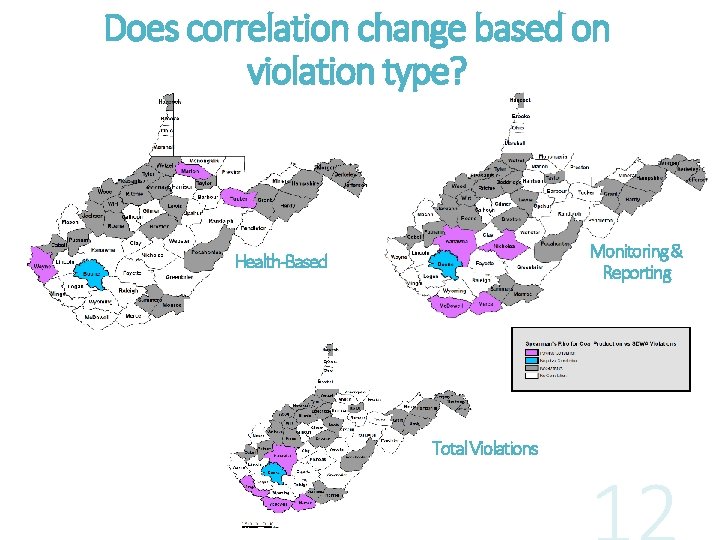
Coal Production ↑ SDWA Violations ↓ Countyc Spearman’s Rho P-value (95% Confidence) Boone -0. 53 0. 0354 Kanawha 0. 55 0. 0282 Mingo 0. 71 0. 0031 Mc. Dowell 0. 59 0. 0186 Mercer 0. 85 3. 41 E-05
Does correlation change based on violation type? Monitoring & Reporting Health-Based Total Violations
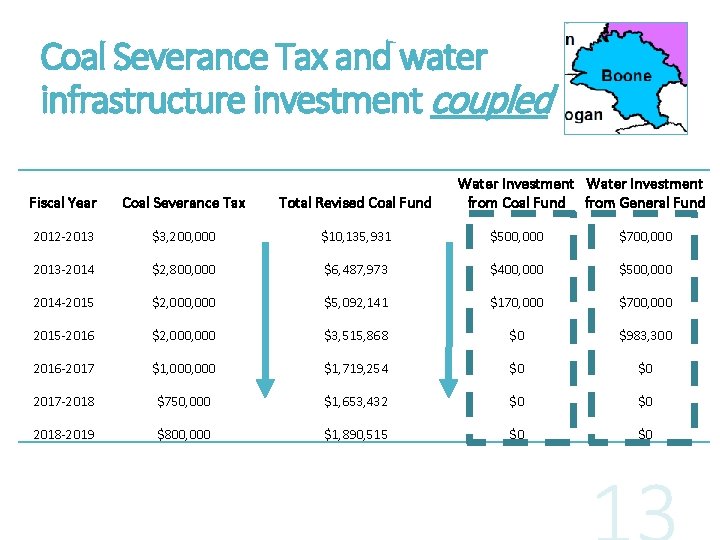
Coal Severance Tax and water infrastructure investment coupled Water Investment from Coal Fund from General Fund Fiscal Year Coal Severance Tax Total Revised Coal Fund 2012 -2013 $3, 200, 000 $10, 135, 931 $500, 000 $700, 000 2013 -2014 $2, 800, 000 $6, 487, 973 $400, 000 $500, 000 2014 -2015 $2, 000 $5, 092, 141 $170, 000 $700, 000 2015 -2016 $2, 000 $3, 515, 868 $0 $983, 300 2016 -2017 $1, 000 $1, 719, 254 $0 $0 2017 -2018 $750, 000 $1, 653, 432 $0 $0 2018 -2019 $800, 000 $1, 890, 515 $0 $0
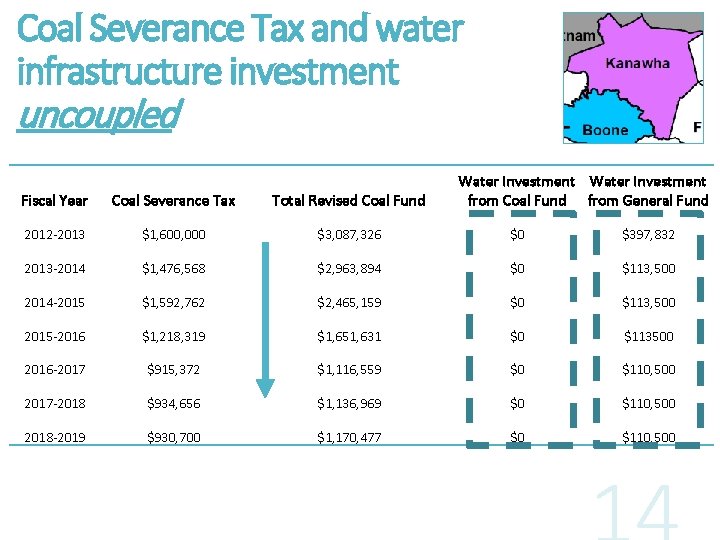
Coal Severance Tax and water infrastructure investment uncoupled Water Investment from Coal Fund from General Fund Fiscal Year Coal Severance Tax Total Revised Coal Fund 2012 -2013 $1, 600, 000 $3, 087, 326 $0 $397, 832 2013 -2014 $1, 476, 568 $2, 963, 894 $0 $113, 500 2014 -2015 $1, 592, 762 $2, 465, 159 $0 $113, 500 2015 -2016 $1, 218, 319 $1, 651, 631 $0 $113500 2016 -2017 $915, 372 $1, 116, 559 $0 $110, 500 2017 -2018 $934, 656 $1, 136, 969 $0 $110, 500 2018 -2019 $930, 700 $1, 170, 477 $0 $110, 500
How can we reclaim communities? v. Coal Severance Tax v. Sustainable mineral resource extraction v. Corporate social responsibility v. Citizen science/community engagement v. How do other community issues fit in?
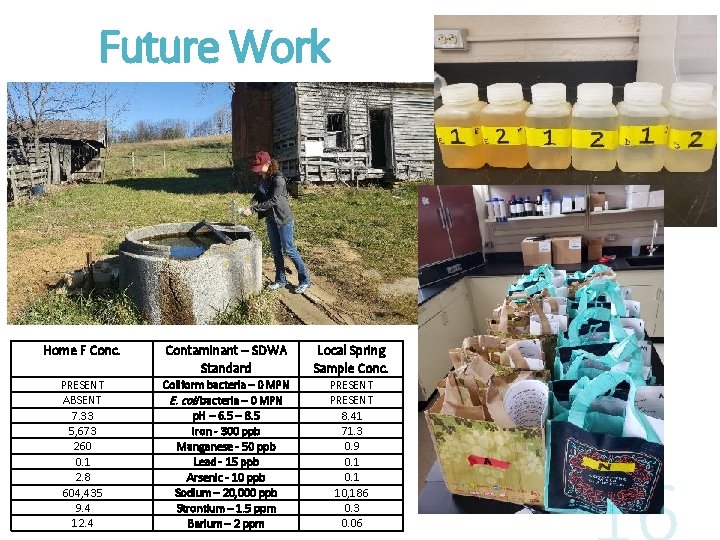
Future Work Home F Conc. Contaminant – SDWA Standard Local Spring Sample Conc. PRESENT ABSENT 7. 33 5, 673 260 0. 1 2. 8 604, 435 9. 4 12. 4 Coliform bacteria – 0 MPN E. coli bacteria – 0 MPN p. H – 6. 5 – 8. 5 Iron - 300 ppb Manganese - 50 ppb Lead - 15 ppb Arsenic - 10 ppb Sodium – 20, 000 ppb Strontium – 1. 5 ppm Barium – 2 ppm PRESENT 8. 41 71. 3 0. 9 0. 1 10, 186 0. 3 0. 06
Advisors: Dr. Leigh-Anne Krometis & Dr. Emily Sarver THANK YOU! Committee Member: Dr. Cully Hession Research Group Members: Lauren Wind, Cristina Marcillo, Ethan Smith, Grant Mc. Millan This work has been supported by the Virginia Tech Institute for Critical Technology and Applied Science (ICTAS) Center for Science and Engineering of the Exposome (SEE) since 2017
Questions? Hannah Patton Virginia Polytechnic and State University Biological Systems Engineering Department Hpatton@vt. edu 240 -812 -2976