Analysis and modelling of atmospheric air pollutants in


 Formaldehyde")


- Slides: 8
Analysis and modelling of atmospheric air pollutants in northern India Prabir Patra and Masayuki Takigawa JAMSTEC, Yokohama
Steps to quantify the emissions of PM 2. 5 from straw-burning • Analyse long-term observations from Delhi and neighbouring states in the northern India (Slide #3) • Link air pollution intensity with the possible cause of emission increase due to anthropogenic activities (Slide #4) • Link biomass burning emissions and with regional air pollution (Slide#5), and the new satellite observations are likely to useful information (Slide#6) • The observation of fire detection by satellites has been inherited from MODIS to VIIRS, the resolution likely been improved (Slide #7 & Slide#8) • Large uncertainties in model simulations are expected based on the existing emission data • Propose to conduct long-term model simulations using WRF-Chem, WRF-CMAQ & JMA-MSM
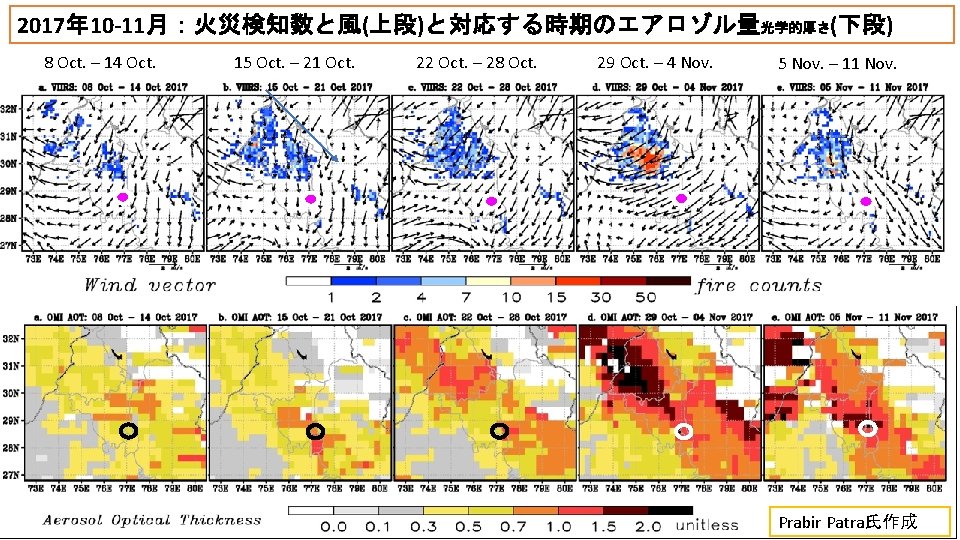
About degrading visibility around the Delhi airport 2 -year mean data 5 -year mean data
Recipes of Delhi pollution – what is lacking is proper quantification of their contributions Diwali 藁焼きのことはStubble Burning (切り株焼き)とよぶ Anthropogenic emissions
New satellites for additional information: TROPOMI (also by Univ. Tokyo, Tohoku Univ. ) Formaldehyde as measured by S 5 PTropomi: The map contains four months of observations up to April 2018. Isabelle De Smedt from the Royal Belgian Institute for Space Aeronomy (BIRA-IASB) said: "The formaldehyde column is composed of different sorts of volatile organic compounds, and the source can be from vegetation - so, from natural origin - but also from fires and pollution” "It depends on the region but 50 -80% of the signal is from some biogenic origin. But above that you have pollution and fire. And the fire can be from coal burning, wildfires or agricultural fires and wood in the home for cooking and heating. https: //www. bbc. com/news/science-environment-44550091 When volatile organic compounds are brought together with nitrogen dioxide (NO₂, from fossil fuel burning) and sunlight, reactions will produce ground-level ozone.
Suomi NPP/VIRS fire counts and back trajectories – individual days of Oct-Nov 2016 Red-Blue colour bar for fire counts Brown-Purple colour bar for trajectory height
Terra/MODIS fire counts and back trajectories – individual days of Oct-Nov 2016 Red-Blue colour bar for fire counts Brown-Purple colour bar for trajectory height