An Update on Bias and Item Missing Data

An Update on Bias and Item Missing Data in NIBRS American Society of Criminology 2018 Annual Meeting Comparative Analysis of Multi-Source Data November 14, 2018 Atlanta, GA Eman Abdu, Doug Salane and Peter Shenkin Center for Cybercrime Studies Mathematics & Computer Science Dept. John Jay College of Criminal Justice City University of New York

Acknowledgements Many students have contributed: Boris Bonderenko, Raul Cabrera and Henry Gallo Inter-university Consortium for Political and Social Research(ICPSR) and National Archive of Criminal Justice Data (NACJD) FBI, Criminal Justice Information Services Division, UCR/NIBRS Groups Supporting grants from NSF, NASA and NIJ
 Examine NIBRS data")
Goals Provide back ground on FBI’s National Incident-Based Reporting System (NIBRS) Examine NIBRS data issues: nonresponse bias and extent of item missing data Briefly discuss ongoing work
 – data on arrest, offense,")
NIBRS Data Structure • Group A offenses (53 crimes) – data on arrest, offense, offender, victim, property – data on incident (administrative) – 58 data elements in 6 main segments • Group B offenses (11 crimes) – social crimes (victimless) – e. g. , bad checks, disorderly conduct, driving under influence – only recorded if there is an arrest • New Codes 2015: Identity theft (26 F), Computer hacking (26 G)

NIBRS Data Structure • NIBRS Group A offenses – data in 6 major files or segments (administrative segment – incident) • An incident can have multiple segments: victims, offenders, offenses, arrestees, property records • Tied together by Agency Identifier (ORI) and incident number • 13 Segment files 6 group A, 1 group B, 3 Window Files, 3 Batch Files (now one)

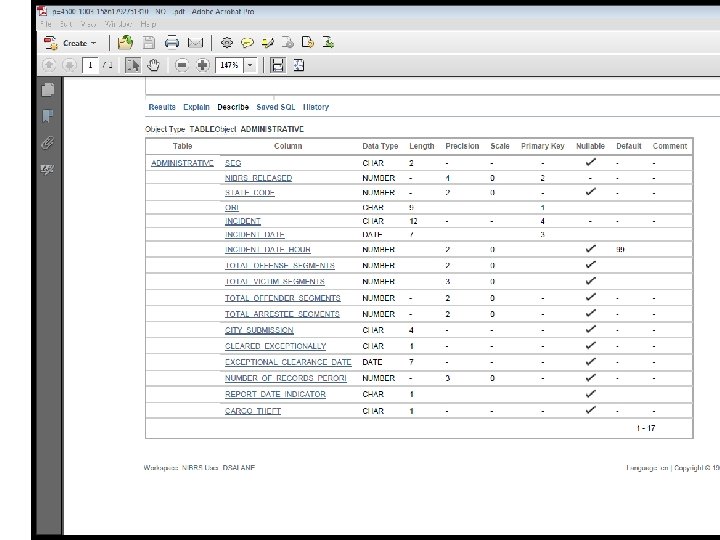
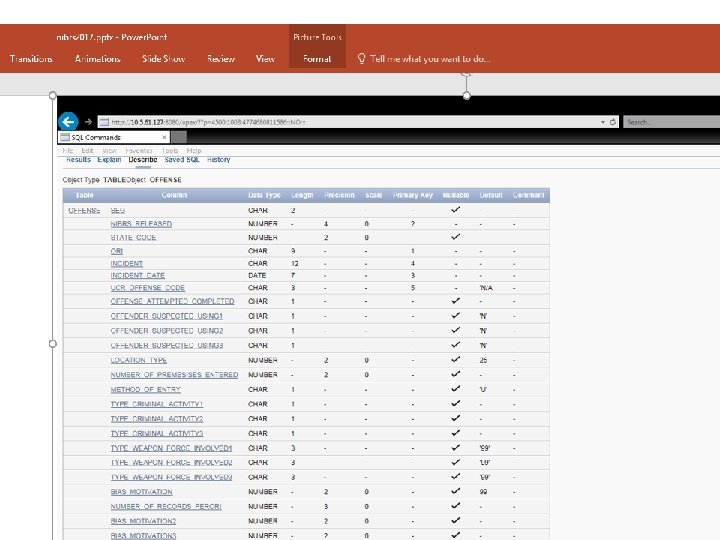
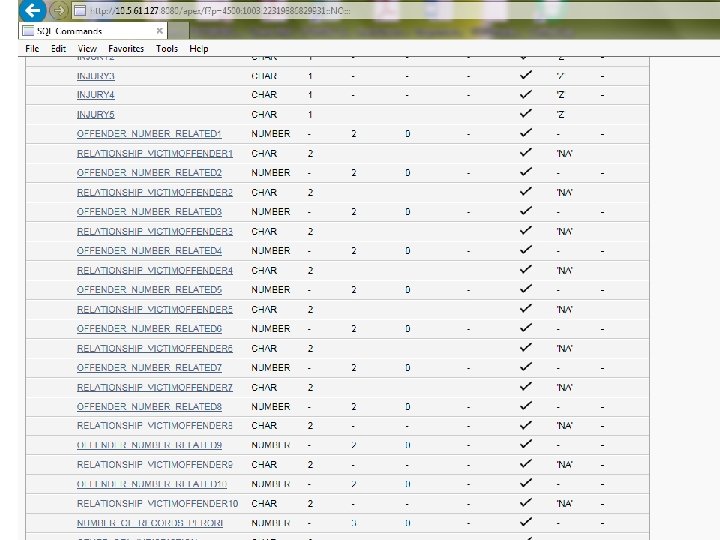
NIBRS Relational Database • 59 Tables – 13 Segments + Codebook • Enforces referential integrity – important when uploading new data • Provides SQL query capability and processing capabilities (indices, partitioning, etc. ) • Extract required data and relationships • Viewing and reporting tools

Sizes of NIBRS Segments John Jay NIBRS Relational Database Segment Type Record Counts Columns (fields, variables) (in millions, first 7 rows) ’ 95 -‘ 05 ’ 95 -‘ 08 1. Administrative 2. Offense 3. Property 4. Victim 5. Offender 6. Arrestee 7. Group B Arrest ‘ 95 -’ 16 29. 1 31. 9 33. 3 31. 7 32. 9 8. 0 9. 9 44. 1 48. 4 50. 7 48. 2 50. 0 12. 4 14. 6 85. 1 94. 1 100. 4 94. 0 96. 9 25. 7 28. 1 17 26 25 55 12 21 19 8. Window Exceptional Clearance 9. Window Recovered Property 11, 502 16, 611 41, 896 27 7, 086 11, 074 20, 145 35 10. Window Arrestee 156, 791 179, 559 247, 652 32

Records per Segment in NIBRS Administrative 0 ffense 0 ffender Victim Property Arrestee Group B Arrest 2015 2010 2005 2000 1995 5, 364, 174 5, 054, 699 5, 060, 854 4, 614, 054 2, 841, 523 837, 014 6, 063, 523 5, 669, 429 5, 610, 977 5, 079, 639 3, 098, 037 906, 509 6, 105, 830 5, 765, 370 5, 845, 297 5, 235, 653 3, 205, 276 937, 035 6, 034, 725 5, 677, 586 5, 636, 428 5, 067, 759 3, 075, 362 889, 743 6, 622, 171 6, 182, 510 6, 011, 620 5, 338, 234 3, 214, 981 951, 574 1, 757, 338 1, 671, 621 1, 606, 460 1, 334, 625 769, 630 227, 090 1, 644, 551 1, 591, 015 1, 753, 973 1, 457, 435 1, 006, 424 318, 524 6284 5662 4862 3365 1255 2016 6574 LEAs Reporting

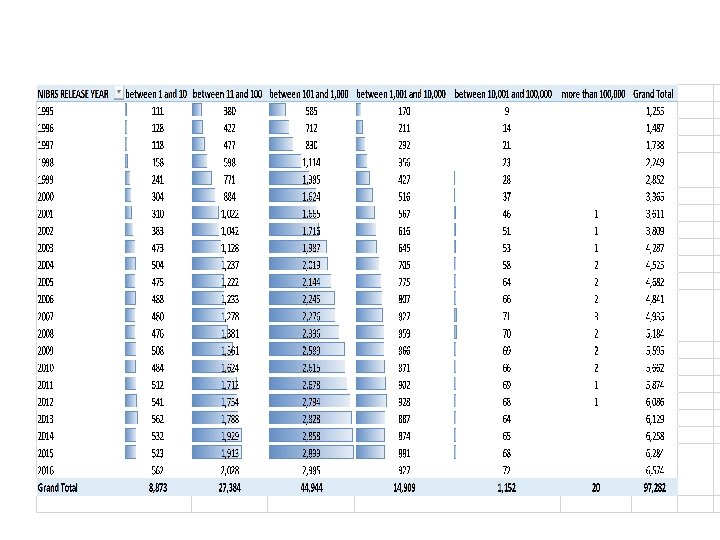
LEAs Reporting at Least One Incident Year Number 1995 1255 1996 1487 1997 % Increase Year Number % Increase 2006 4841 3. 4 18. 5 2007 4935 2. 0 1738 16. 9 2008 5184 5. 0 1998 2249 29. 4 2009 5595 8. 0 1999 2852 26. 8 2010 5662 1. 2 2000 3365 18. 0 2011 5874 3. 7 2001 3611 7. 3 2012 6086 3. 6 2002 3809 5. 5 2013 6129 . 7 2003 4287 12. 5 2014 6258 2. 1 2004 4525 5. 6 2015 6284 . 4 2005 4682 3. 5 2016 6574 4. 6%

 CODE DESCRIPTION • B Buying/Receiving • C")
Code Tables in NIBRS (Type Criminal Activity) CODE DESCRIPTION • B Buying/Receiving • C Cultivating/Manufacturing/Publishing • D Distributing/Selling • E Exploiting Children • J Juvenile Gang Involvement • G Other Gang • N None/Unknown Gang Involvement • O Operating/Promoting/Assisting • P Possessing/Concealing • T Transporting/Transmitting/Importing • U Using/Consuming • I Intentional Abuse and Torture
 CODE DESCRIPTION VO Victim was Offender")
Code Tables in NIBRS (Victim Offender Relationship ) CODE DESCRIPTION VO Victim was Offender NA Not applicable AQ Victim was Acquaintance SE Victim was Spouse FR Victim was Friend CS Victim Common-Law Spouse NE Victim was Neighbor PA Victim was Parent BE Victim was Babysittee (the baby) SB Victim was Sibling BG Victim was Boyfriend/Girlfriend CH Victim was Child CF Victim was Child of Boyfriend / Girlfriend GP Victim was Grandparent HR Homosexual Relationship GC Victim was Grandchild XS Victim was Ex-Spouse IL Victim was In-Law EE Victim was Employee SP Victim was Stepparent ER Victim was Employer SC Victim was Stepchild OK Victim was Otherwise Known SS Victim was Stepsibling RU Relationship Unknown OF Victim other family member ST Victim was Stranger
 • • • • • 11 Anti-White 12")
Code Tables in NIBRS (Bias Motivation) • • • • • 11 Anti-White 12 Anti-Black or African American 13 Anti-American Indian or Alaska Native 14 Anti-Asian 15 Multi-Racial Group 21 Anti-Jewish 22 Anti-Catholic 23 Anti-Protestant 24 Anti-Islamic (Moslem) 25 Other Religion 26 Multi-Religious Group 27 Atheism/Agnosticism 31 Anti-Arab 32 Anti-Hispanic or Latino 33 Anti-Not Hispanic or Latino 41 Anti-Male Homosexual (Gay) • 42 Anti-Female Homosexual (Lesbian) 43 Anti-Lesbian, Gay, Bisexual, or Transgender, Mixed Group (LGBT) • 43 Anti-Lesbian, Gay, Bisexual, or Transgender, Mixed Group (LGBT) • 44 Anti-Heterosexual • 45 Anti-Bisexual • 51 Anti-Physical Disability • 52 Anti-Mental Disability • 88 None • 99 Unknown • 28 Anti-Mormon • 82 Anti-Other Christian • 84 Anti-Hindu • 85 Anti-Sikh • 61 Anti-Male • 62 Anti-Female • 71 Anti-Transgender • 72 Anti-Gender Non-Conforming • 16 Anti-Native Hawaiian or Other Pacific Islander
 • new criminal activity types • additional offense")
Code Tables in NIBRS (recent additions) • new criminal activity types • additional offense codes • additional bias motivations
")
Entity Relationship (6 main segments)

Victim/Offender Join ORI Code Incident Number Offender Sequence No. Offender Age Victim Sequence No. Victim Age Incident Date 1 CO 0030400 CI 0 BRFRH-2 N 1 23 1 33 09 -Nov-00 2 DE 0020300 LT 01 KETVV 0 N 0 00 1 39 16 -DEC-02 3 DE 0020600 LI 01 KVBRTU N 1 11 1 09 06 -OCT-02 4 DE 0020600 LI 01 KVBRTU N 1 11 2 08 06 -OCT-02 5 DE 0020600 LI 01 KVBRTU N 2 10 1 09 06 -OCT-02 6 DE 0020600 LI 01 KVBRTU N 2 10 2 08 06 -OCT-02 7 DE 0020600 LI 01 KVBRTU N 3 10 1 09 06 -OCT-02 8 DE 0020600 LI 01 KVBRTU N 3 10 2 08 06 -OCT-02 9 DE 0020600 LI 01 KVBRTU N 4 12 1 09 06 -OCT-02 10 DE 0020600 LI 01 KVBRTU N 4 12 2 08 06 -OCT-02 11 IA 0820200 7 Z 1 C 7 REMQ-F 1 40 1 41 24 -JAN-02
 Total Incidents 5, 364, 174 Segment One Three")
NIBRS Incidents with Multiple Segments (2016) Total Incidents 5, 364, 174 Segment One Three Two Four Arrestee 1, 332, 988 24. 8% 152, 016 2. 8% 25, 059 0. 5% 6, 625 0. 1% 4, 817, 278 89. 8% 421, 552 7. 0% 84, 469 1. 6% 26, 667 0. 5% 4, 741, 430 88. 4% 555, 849 10. 4% 58, 623 1. 1% 7, 066 0. 13% 4, 861, 626 90. 6% 409205 7. 6% 62, 109 1. 2% 17, 128 0. 31% Offender Offense Victim
 Total Incidents 85, 036, 846 Segment One")
NIBRS Incidents with Multiple Segments (1995 -2016) Total Incidents 85, 036, 846 Segment One Three Two Four Arrestee 18, 662, 221 21. 9% 2, 359, 346 2. 8% 448, 139 0. 5% 130, 160 0. 2% 76, 532, 549 90. 0% 6, 372, 484 7. 5% 1, 404, 860 1. 7% 463, 149 0. 5% 76, 825, 142 90. 3% 7, 483, 662 8. 8% 655, 275 0. 8% 63, 149 0. 1% 78, 242, 354 92. 0% 5, 577, 745 6. 6% 808, 858 1. 0% 222, 715 0. 3% Offender Offense Victim

Study of selected offenses where offender used a computer • Illustrates use of spreadsheet pivot tables to select desired data • Requires data from the offender and offense segments • Provides age and gender breakdown of the offenders • Examine selected offenses where offender used a computer

 Aggregated by Offense,")
Spreadsheet Pivot Tables Offender Counts (Offender suspected of using a computer) Aggregated by Offense, Age and Gender Offense Description Age Group Gender Embezzlement Wire Fraud 11 – 20 20 – 30 31 – 40 41 – 50 51 – 60 F M F M F M Year Grand 2004 2005 Total 2000 2001 2002 2003 11 4 17 11 9 8 5 3 7 5 18 13 9 9 7 8 2 4 5 6 19 14 18 12 7 4 4 8 8 22 14 20 7 6 4 1 8 6 20 12 13 12 8 4 1 2 14 7 29 23 31 13 21 10 4 3 53 36 125 87 100 61 54 33 12 10 3 9 6 12 3 8 5 2 1 2 3 9 3 18 2 11 3 2 4 13 6 22 8 12 3 8 1 1 2 13 14 27 9 13 3 4 2 12 16 22 8 21 6 5 4 6 15 65 46 108 30 69 21 25 11 14 1 1 9 1 7 4 1 4 2
 Aggregated by Offense,")
Spreadsheet Pivot Tables Offender Counts (Offender suspected of using a computer) Aggregated by Offense, Age and Gender Offense Description Age Group Gender Embezzlement Impersonation Year 2010 2011 2012 2013 Grand 2014 2015 Total 11 – 20 – 30 31 – 40 41 – 50 51 – 60 F M F M F M 17 10 42 31 31 29 24 8 12 4 15 13 47 45 40 23 25 16 8 10 8 12 47 35 36 26 29 12 11 3 22 25 82 67 60 24 28 21 13 12 35 27 58 64 72 35 32 16 8 8 41 23 83 75 53 38 35 26 18 9 138 110 359 317 292 175 173 99 70 46 11 – 20 – 30 31 – 40 41 – 50 51 – 60 F M F M F M 24 23 58 110 60 52 33 31 13 19 17 25 73 78 57 57 44 41 12 19 23 46 99 109 61 84 51 54 14 31 45 119 110 112 110 111 61 53 29 38 30 56 121 129 100 112 55 81 23 32 39 47 123 153 128 129 61 76 26 43 178 316 584 691 516 545 305 336 117 182

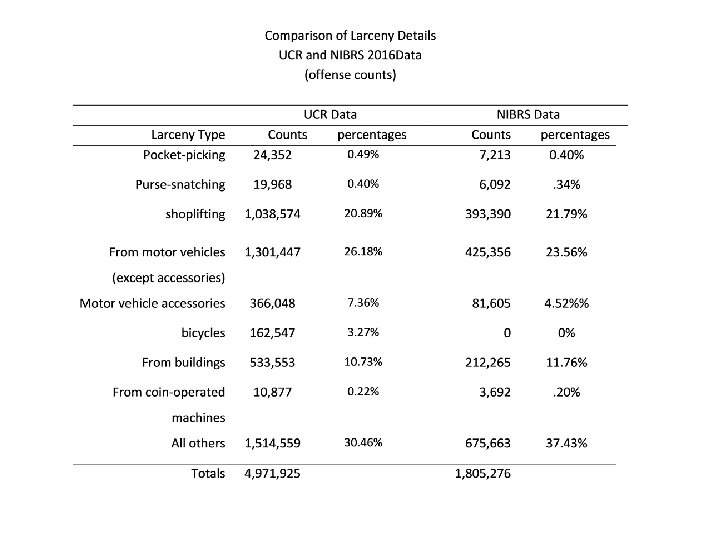
BIAS due to Non Response • Compare UCR and NIBRS reporting • Examine Breakdown of Violent and Property Crimes in NIBRS and UCR • Examine Larceny in NIBRS and UCR
 NIBRS UCR • 16, 643 LEAs submitted data to UCR")
NIBRS and UCR (SRS) NIBRS UCR • 16, 643 LEAs submitted data to UCR (18, 481 total ) • 34 states certified, 16 report all crime in NIBRS, 18 combination NIBRS/SRS • Includes major • Covers about 31% of US municipalities, 85 LEAs population (101 million ) covering Group I cities, 83 • 29% of crime - 21 LEAs in 2015. Group I cities, 18 in 2015 • 6849 LEAs (37. 1%) participated in 2016, 6648 in 2015 • Mainly summary data but with some incident data
 Aggravated Assault")
Breakdown of Violent Crimes UCR Data and NIBRS Crime Type (NIBRS codes) Aggravated Assault (13 A) Murder/Non negligent Manslaughter (09 A) Rape (legacy definition 11 A) Robbery (120) UCR (2014) NIBRS (2014) UCR (2015) NIBRS (2015) UCR (2016) NIBRS (2016) 63. 61% 62. 29% 63. 8% 62. 44% 64. 33% 62. 82% 1. 28% 1. 30% 1. 44% 1. 38% 1. 49% 7. 21% 10. 91% 7. 50% 11. 29% 7. 67% 11. 50% 27. 30% 24. 83% 26. 61% 24. 19% 27. 96% 25. 51%
 Crime 2013 2014 2015 10.")
Increase in Violent Crimes UCR and NIBRS (2013 -2016) Crime 2013 2014 2015 10. 16% 17, 250 17. 83% 4, 638 9. 90% 12. 49% 7. 31% 95, 730 6. 15% 32, 279 8. 60% 35, 687 10. 56% -4. 47% 327, 374 0. 48% 332, 198 1. 47% 69, 512 -5. 24% 70, 923 2. 03% 75, 048 -- 741, 291 2. 37% 764, 449 3. 12% 803, 007 5. 04% -- 169, 728 2. 62% 178, 511 5. 17% 194, 913 9. 19% murder UCR NIBRS 14, 196 3, 445 --- 14, 249 3, 499 . 37% 1. 57% 15, 696 4, 123 rape UCR NIBRS 79, 770 28, 855 --- 84, 041 29, 723 5. 35% 3. 01% 90, 185 UCR 341, 031 -- 325, 802 NIBRS 73, 354 -- UCR 724, 149 NIBRS 165, 395 robbery Aggravated assault 2016 5. 82%
 1995 – 2016")
NIBRS Breakdown of Violent Crime (1995 – 2016) 1995 – 2016
 Crime Type Burglary Larceny 2014")
Breakdown of Property Crimes UCR and NIBRS (2014 -2016) Crime Type Burglary Larceny 2014 UCR NIBRS 2015 1, 532, 127 21. 12% 1, 395, 913 486, 554 20. 24% 461, 674 UCR 5, 111, 544 70. 45% 5, 014, 269 NIBRS 1, 736, 384 72. 24% 1, 724, 328 611, 610 8. 43% 637, 965 180, 822 7. 52% 189, 072 UCR Motor Vehicle NIBRS Theft 2016 19. 81% 1, 354, 920 19. 44% 467, 135 71. 14% 4, 971, 925 72. 60% 9. 05% 7. 96% 19. 28% 18. 69% 1, 805, 276 70. 75% 72. 23% 700, 143 9. 97% 226, 878 9. 08%
 Crime Type NIBRS (counts) NIBRS %")
Breakdown of Property Crimes NIBRS (1995 - 2016) Crime Type NIBRS (counts) NIBRS % Burglary 8, 719, 649 21. 11% Larceny 29, 158, 160 70. 61% Motor Vehicle Theft 3, 419, 075 8. 28%
 80. 00% 70. 00% 60. 00% 50.")
Breakdown of Property Crime NIBRS (1995 -2016) 80. 00% 70. 00% 60. 00% 50. 00% Larceny 40. 00% Burglary 30. 00% Motor Vehicle 20. 00% 10. 00% 1 2 3 4 5 6 7 8 9 10 11 12 13 14 15 16 17 18 19 20 21 1995(1) – 2016(22)
 Crime Type UCR NIBRS")
Changes in Property Crimes NIBRS /UCR Trends (2014 to 2015) Crime Type UCR NIBRS Burglary -8. 91% -5. 11% Larceny -1. 9% -0. 69% Motor Vehicle Theft 4. 31% 4. 56%

Item Missing Data • NIBRS has 53 data elements most of which are mandatory • Data elements such as demographics of victim and offenders, relationships victim/offender and others are of interest to researchers and policy makers • Compare rates of missing data in NIBRS and other sources such as SHR • Examine item missing data in murders
 1995 1996 1997 1998 1999 2000 2001")
NIBRS Unknown Murder Victim Information (1995 -2016) 1995 1996 1997 1998 1999 2000 2001 2002 2003 2004 2005 2006 2007 2008 2009 2010 2011 2012 2013 2014 2015 2016 victims 458 643 749 975 1230 1695 1958 2053 2132 2358 3320 3404 3420 3252 3457 3430 3544 3689 3551 3596 4234 4768 Unknown age 6 13 18 39 34 82 85 95 65 104 122 111 97 97 79 46 47 52 57 49 58 51 1. 31% 2. 02% 2. 40% 4. 00% 2. 7% 4. 84% 4. 34% 4. 63% 3. 05% 4. 41% 3. 67% 3. 26% 2. 84% 2. 98% 2. 29% 1. 34% 1. 33% 1. 41% 1. 61% 1. 36% 1. 37% 1. 10% Unknown race 6 7 10 21 27 52 49 53 52 58 76 66 62 93 54 49 77 62 57 73 71 91 1. 31% 1. 09% 1. 34% 2. 15% 2. 20% 3. 07% 2. 50% 2. 58% 2. 44% 2. 46% 2. 29% 1. 94% 1. 81% 2. 86% 1. 56% 1. 43% 2. 17% 1. 68% 1. 61% 2. 03% 1. 68% 1. 91% Unknown gender 0 3 0 7 6 17 15 15 7 21 13 25 16 28 8 9 13 11 14 23 14 22 0. 00% 0. 47% 0. 00% 0. 72% 0. 49% 1. 00% 0. 77% 0. 73% 0. 33% 0. 89% 0. 39% 0. 73% 0. 47% 0. 86% 0. 23% 0. 26% 0. 37% 0. 30% 0. 39% 0. 64% 0. 33% 0. 46%
 Victims 1995 1996 1997 1998 1999 2000")
NIBRS Unknown Offender Information 1 (1995 -2016) Victims 1995 1996 1997 1998 1999 2000 2001 2002 2003 2004 2005 2006 2007 2008 2009 2010 2011 2012 2013 458 643 749 975 1230 1695 1958 2053 2132 2358 3320 3404 3420 3252 3457 3430 3544 3689 3551 Offender missing 4. 37% 7. 93% 10. 41% 7. 08% 9. 02% 9. 44% 11. 90% 10. 23% 11. 30% 10. 69% 11. 20% 11. 72% 12. 54% 13. 47% 12. 09% 13. 29% 12. 39% 13. 53% 12. 56% 2014 2015 2016 3596 4234 4768 11. 43% 13. 51% 13. 74% unknown demographics 7. 64% 7. 62% 9. 35% 9. 85% 9. 27% 15. 16% 11. 64% 12. 96% 12. 24% 15. 18% 19. 94% 18. 51% 15. 26% 14. 94% 15. 33% 14. 46% 15. 77% 15. 83% 14. 81% 14. 35% 14. 65% 14. 53% unknown age unknown race 6. 99% 5. 68% 7. 00% 6. 69% 8. 14% 7. 21% 8. 82% 6. 77% 7. 97% 7. 64% 14. 40% 10. 86% 10. 73% 8. 27% 11. 69% 8. 91% 10. 79% 9. 29% 13. 02% 11. 28% 17. 95% 14. 46% 16. 69% 12. 66% 13. 57% 9. 30% 12. 67% 10. 61% 13. 51% 9. 98% 13. 27% 9. 04% 14. 11% 10. 38% 14. 10% 10. 11% 13. 38% 9. 63% 12. 26% 14. 27% 15. 44% 10. 65% 11. 45% 12. 69% unknown gender 4. 80% 5. 29% 6. 28% 5. 23% 5. 93% 9. 79% 7. 46% 7. 60% 7. 88% 9. 16% 12. 02% 11. 05% 7. 63% 8. 30% 7. 84% 7. 49% 8. 94% 8. 65% 8. 39% 8. 79% 9. 54% 10. 23%

Ongoing Work • Time series studies to examine NIBRS missing data, victim-offender relationships, circumstances, location and weapon used • Extract data for specific studies and make it available in Excel Pivot Tables or Data Cubes • Examine effects of police reporting practices on the data, e. g. , inaccurate incident times • Prepare for additional NIBRS reporting. DOJ, OJP, BJS and FBI program to create a nationally representative crime sample and NIBRS compliant operational systems increasing NIBRS reporting. (Mainly an IT effort) • Make the relational database publicly available through use of the Oracle Data Pump utility

Thank You Eman Abdu Doug Salane and Peter Shenkin dsalane@jjay. cuny. edu 212 237 -8836 Center for Cybercrime Studies Math & CS Dept. John Jay College of Criminal Justice
- Slides: 45