An Overview of the North American Regional Reanalysis

 ● ● Create hi-resolution reanalysis for the")
 ● 32 km")

 vs 32 km (NARR) resolution topography")


")


 higher horizontal orography: 32 km vs")
 ● plots: obs locations,")
 U. of")


- Slides: 34
An Overview of the North American Regional Reanalysis W. Ebisuzaki, F. Mesinger, G. Di. Mego, E. Kalnay, K. Mitchell, M. Ek, R. Grumbine, D. Jovic, P. Shafran, and J. Woolen http: //wwwt. emc. ncep. noaa. gov/mmb/rreanl/index. html
Motivation for North American Regional Reanalysis (NARR) ● ● Create hi-resolution reanalysis for the North American domain Address some of the weakness of the N/N Reanalysis, i. e. , near surface temperature, winds Hydrology in the North American domain Make a more useful reanalysis (for people who want point values and live on the surface Expectations ● more applied meteorological applications ● more uncertain about how non-meteorologists will use the data
High Lights of NARR ● ETA model and assimilation system (EDAS) ● 32 km resolution over the North and Central America ● R-2 horizontal boundary conditions ● new land surface model (NOAH) ● precipitation assimilation ● 8 x daily analyses from October 1978 onwards ● 5 TB for basic set of analyses and fluxes ● Oct 1978 -Nov 2002 done
NARR domain
180 km (~ CDAS) vs 32 km (NARR) resolution topography
ETA / NOAH LAND-SURFACE MODEL UPGRADES: 24 Jul 01 - assimilation of hourly precipitation -- hourly 4 -km radar/gage analysis (Stage IV) - cold season processes(Koren et al 1999) -- patchy snow cover -- frozen soil (new state variable) -- snow density (new state variable) - bare soil evaporation refinements -- parameterize upper sfc crust cap on evap - soil heat flux -- new soil thermal conductivity (Peters-Lidard et al 1998) -- under snowpack (Lunardini, 1981) -- vegetation reduction of thermal cond. (Peters-Lidard et al 1997) - surface characterization -- maximum snow albedo database (Robinson & Kukla 1985) -- dynamic thermal roughness length refinements - vegetation -- deeper rooting depth in forests -- canopy resistance refinements NOAH LSM tested in various land-model intercomparison projects, e. g. , GSWP, PILPS 2 a, 2 c, 2 d, 2 e, Rhone, and (near-future) DMIP.
January 1997 Precipitation Results
Precipitation ● Several sources of precipitation – – CONUS data with PRISM (Mountain Mapper) to improve orographic effects Canada Mexico CMAP (combination of satellite and gauge data) over oceans; CMAP is blocked: ● ● ● Near central areas of hurricanes (7. 5 by 7. 5 deg) Observed precipitation > 100 mm/day A 15 -degree 'blending belt' between 27. 5 and 42. 5 N, with no CMAP north of 42. 5 N
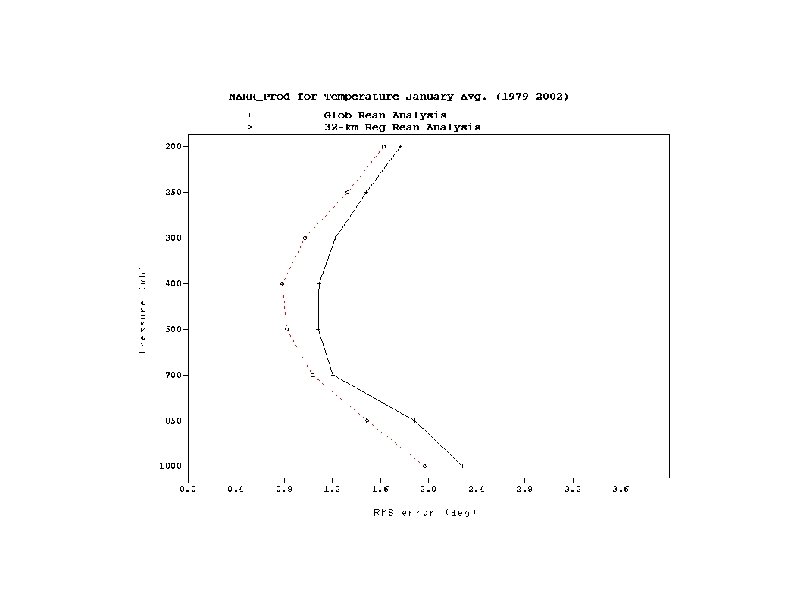
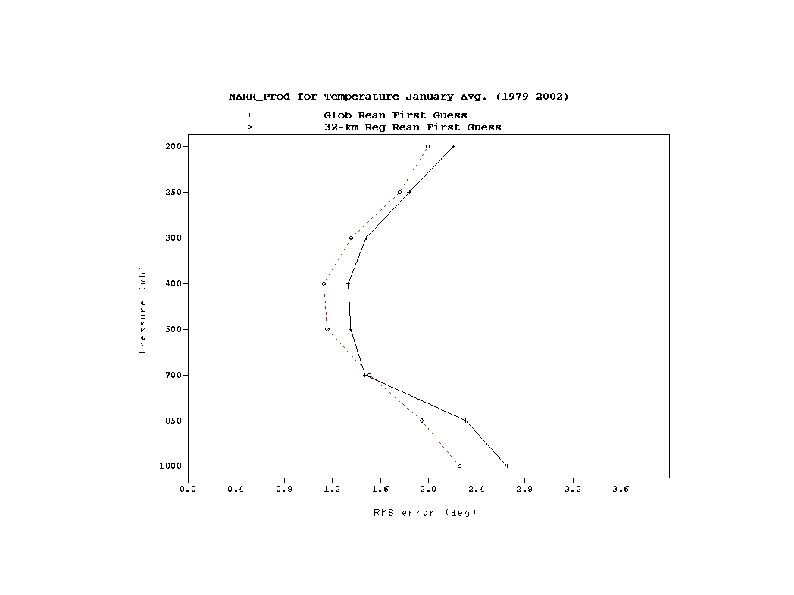
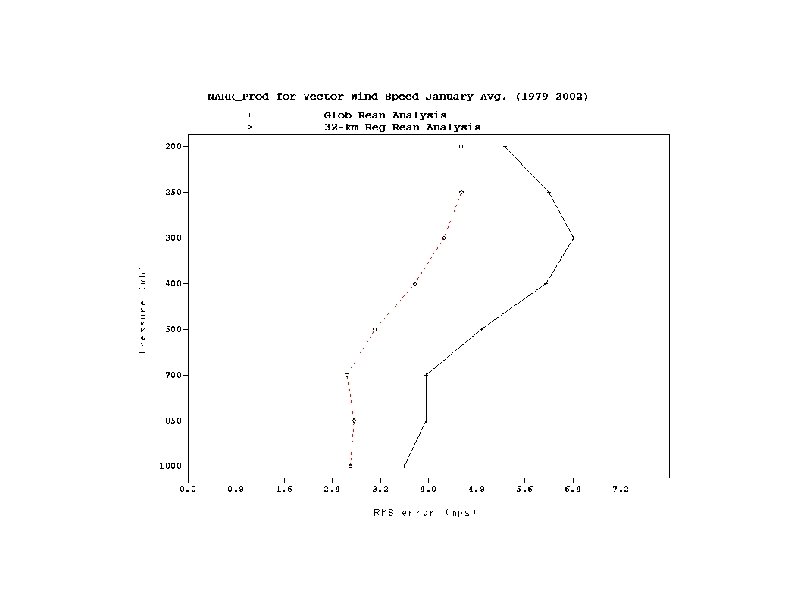
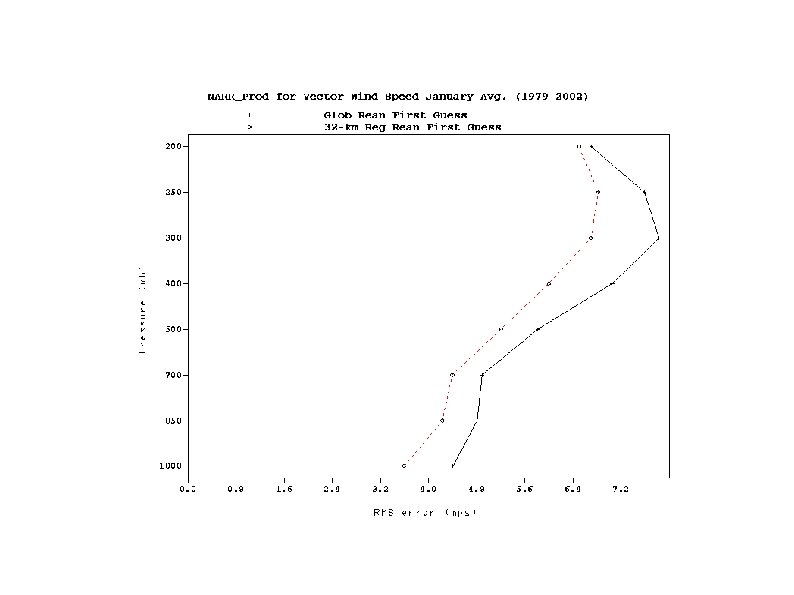
Comparison of N/N Reanalysis and NARR model ● Global ● N. Am. Sector ● Spectral ● Grid point ● ~250 km resolution ● 32 km resolution ● 28 sigma levels ● 45 pressure levels ● Land sfc (Pan and Marht, 1987) ● NOAH model (2002) ● One soil type (sandy loam) ● Realistic soil types ● Two soil levels ● 4 soil layers ● Simplistic snow depth, fn(T) ● Snow depth, modeled/observed ● 6 hour analyses time steps ● 3 hour analyses time steps
Comparison of N/N Reanalysis and NARR input observations ● Sondes, aircraft, profilers ● TOVS temperature retrievals ● Direct assimilation of radiances ● Satellite winds ● Land sfc: prs, q, winds ● Ocean sfc: prs, q, t, winds ● Precipitation ● Snow cover: old is low res ● USAF snow depth (hi res) ● Reynold's SST + lakes ● Sea ice from R. Grumbine + lakes
Comparison of N/N Reanalysis and NARR dates ● Software: ~1994 ● Software: ~2002 ● Analyses: 1948 -present ● Analyses: Oct 1978 -Nov 2002 ● Nov 2002+ in development
Operational ETA vs NARR ● 12 km ● 32 km ● 60 levels ● 45 levels ● Evolving physics ● Frozen physics ● Precip assim for CONSUS ● Better precip obs ● Lakes: SST, ice-real time ● Better lake obs
Operational ETA vs NARR User Output: RR is more friendly ● RR: 1 grib table vs 3 grib tables for OPN (some software cannot handle multiple tables) ● RR: Winds are N/S vs grid-relative winds in OPN (some software cannot handle grid-relative winds) ● RR: new variables: moisture fluxes, etc ● RR: redundant variables removed: ex dew pt, rel q, specific q ● RR: added new BL levels, removed others ● RR: BUFR files have QC and increments ● RR: many monitoring plots
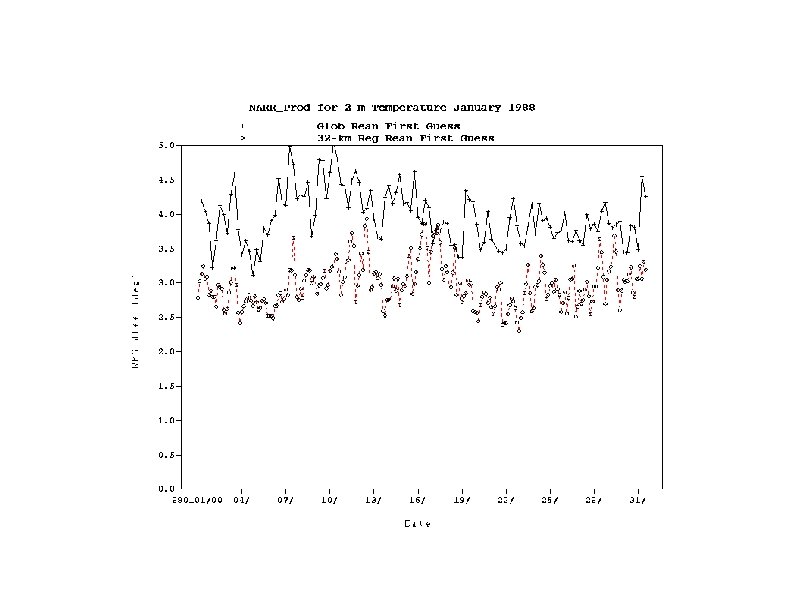
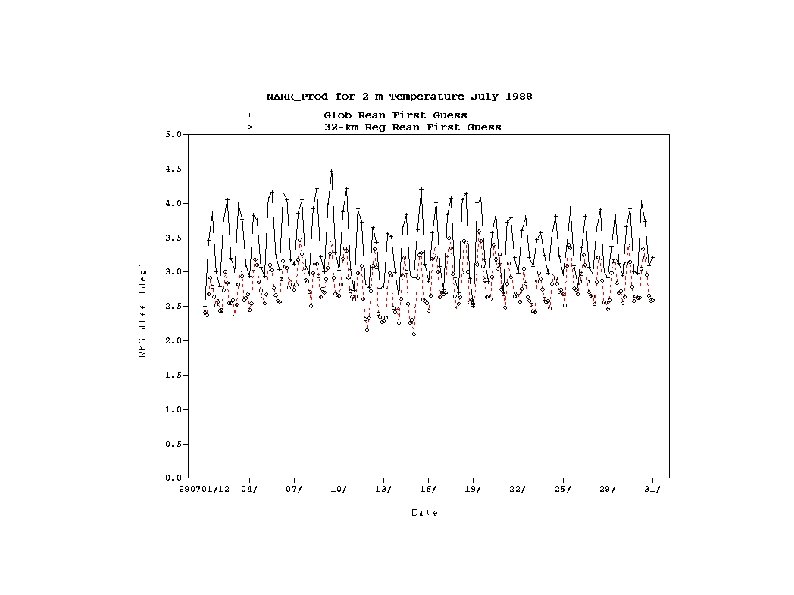
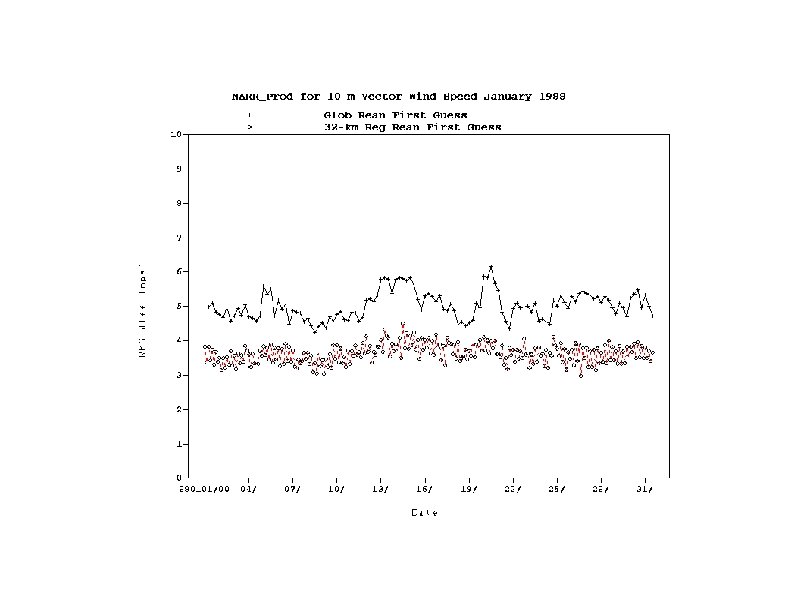
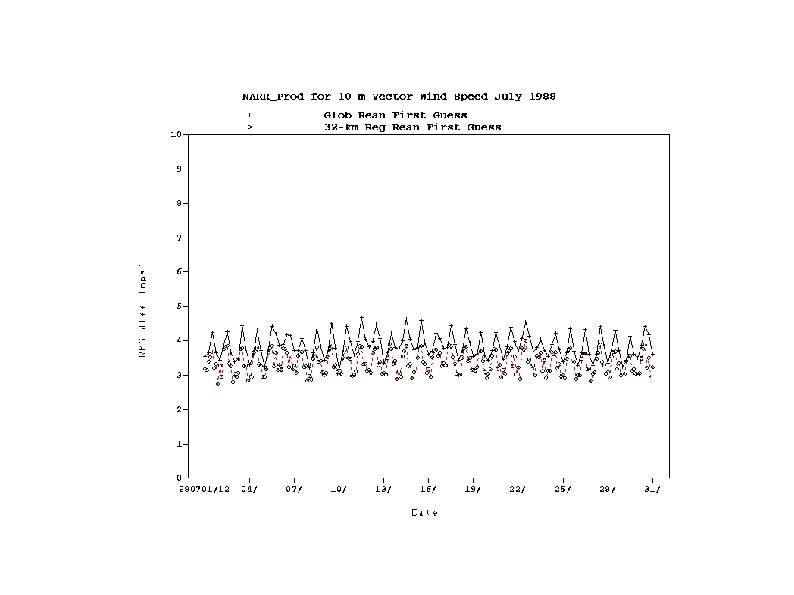
Why NARR should have better surface values 1) higher horizontal orography: 32 km vs ~250 km need to resolve orography 2) better land surface model to get 2 m temp and q. . need better sfc fluxes 3) assimilated precipitation better model precipitation. . clouds, radiative flux better soil moisture. . latent and sensible heat flux 4) gridded snow depth is similar to NARR resolution a problem with NCEP's global reanalyses 5) assimilate more near surface data (winds, q) 6) 3 hour assim cycle, better resolve diurnal cycle
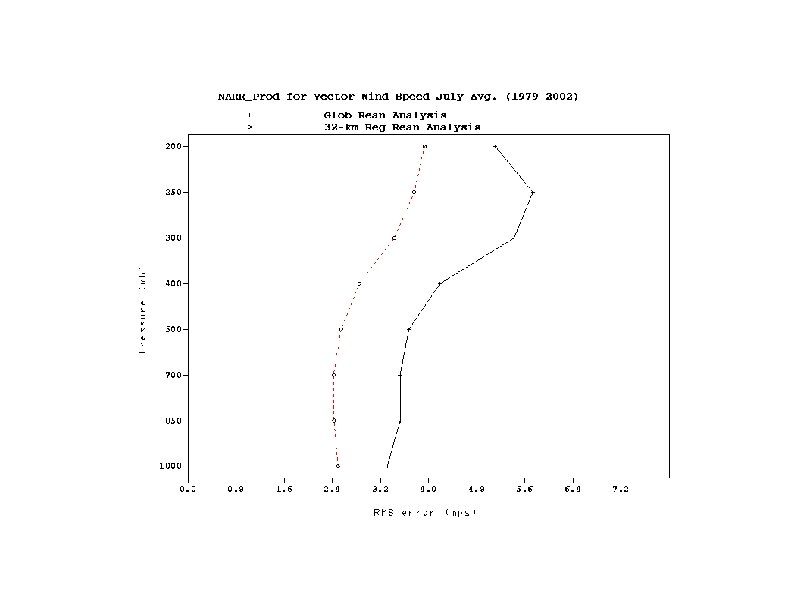
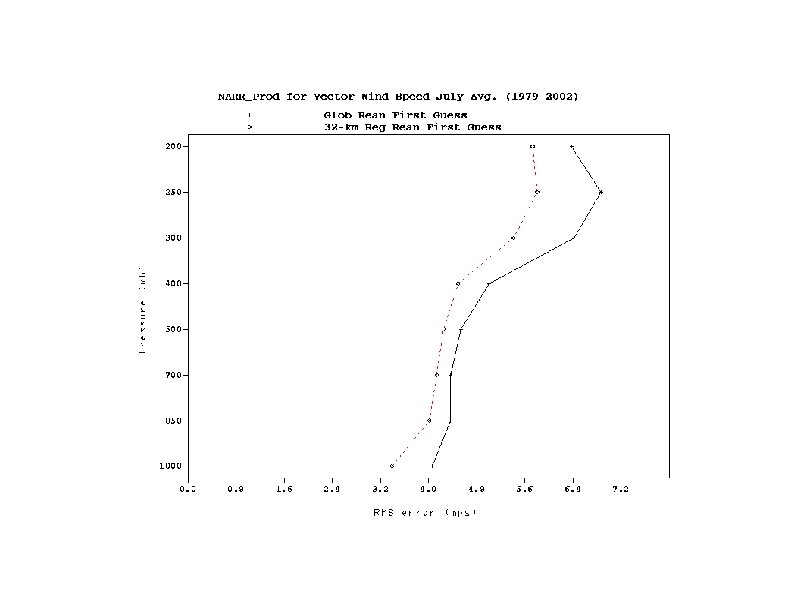
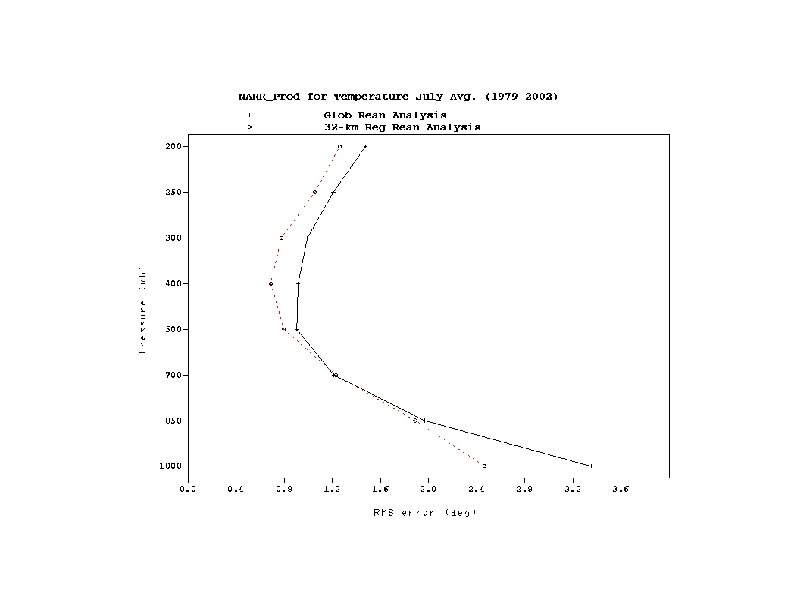
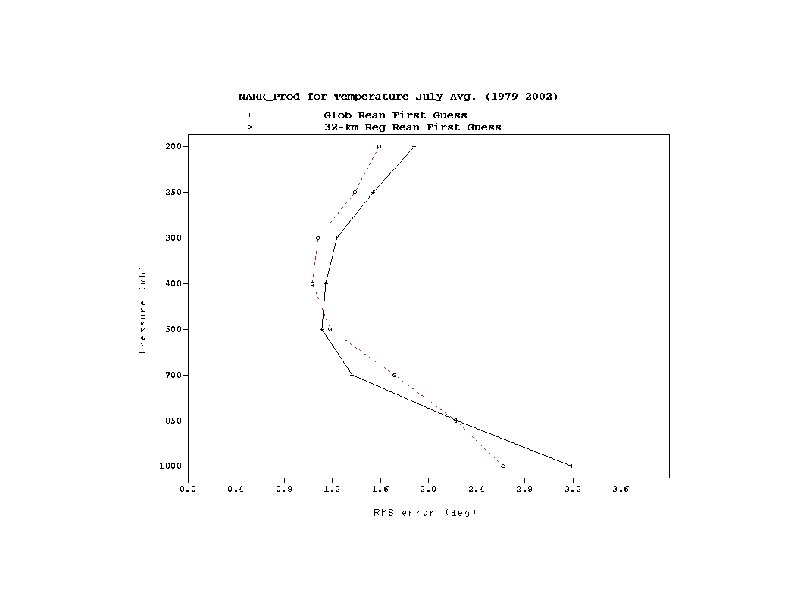
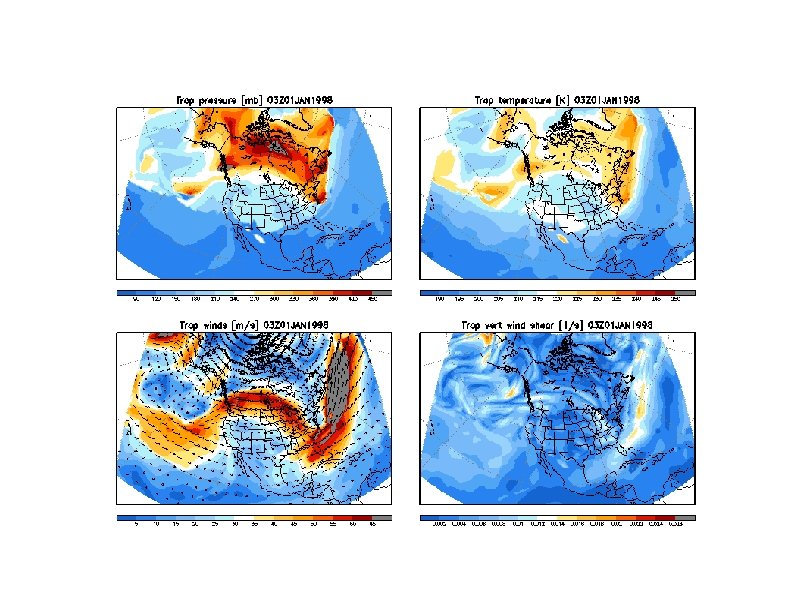
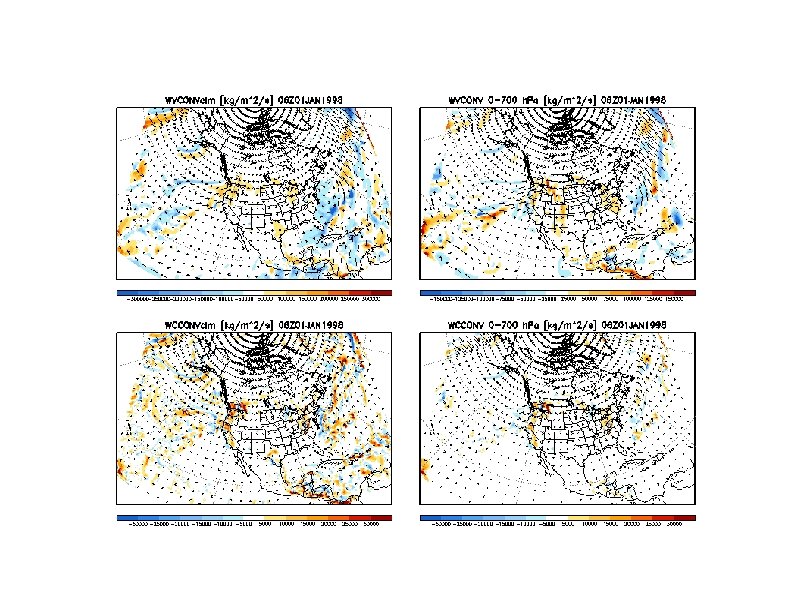
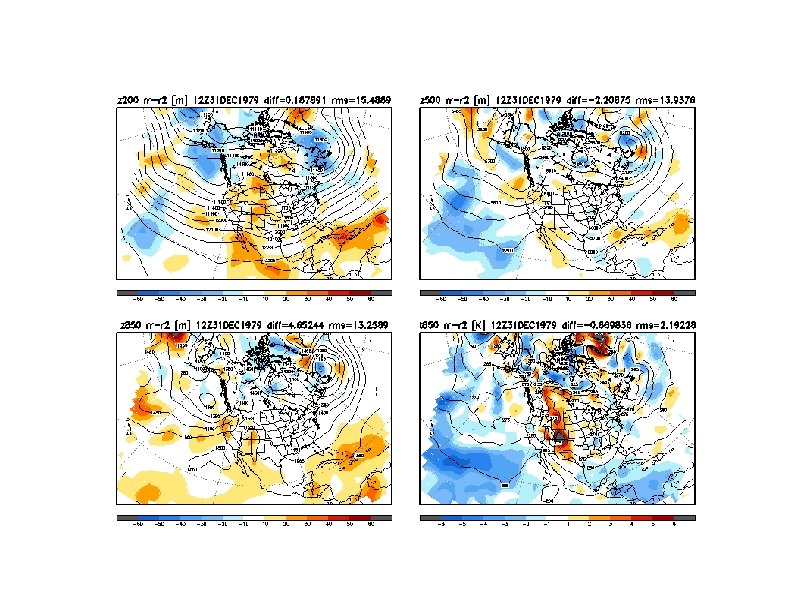
Principal Output Datasets ● Observations with QC marks, increments (BUFR) ● plots: obs locations, fit to sondes, fit to sfc obs, ● fit to global reanalysis, various NARR fields ● binary restart files (to rerun model, high resolution), very big, small usage ● GRIB analyses and first guess on model grid big, no interpolation errors ● ● GRIB analyses and first guess on Lambert conformal 32 -km grid, big, easier to use, interpolation error Merged: GRIB analyses and averaged/accumulated flux/precip and some 1 st guess fields for water budgets, Lambert Conformal grid (AWIP 221), 5 TB for 8 x daily for entire period. This will be work-horse data set.
Data Distribution ● ● NCAR SDSC (San Diego Super Computing Center, UCSD) U. of Maryland NCDC-NOMADS (NOAA Operational Model Archive Distribution System)
NOMADS ● ● Partnership of many organizations including core collaborators: CDC, COLA, FSL, GFDL, LLNL, NCAR, NCDC, NCEP, PMEL, UNIDATA On-line access to the merged RR data set (analyses + fluxes+some first guess) – NCDC: 7 TB on-line storage, web servers, x-TB tape storage – NCEP: ¾ TB on-line, web servers, software upgrades Software: – on-line plotting package – on-line slice-and-dice of GRIB files – Gr. ADS-DODS Status: – plotting package will be enhanced by NCEP – downloading of GRIB files will be enhanced by NCEP – Gr. ADS-DODS needs enhancements – NOMADS-NCDC has experience running software
I can't download the 5 TB merged data set! Download what you want: Select: 1) variables 2) levels 3) times 4) domain 5) resolution: 32 km, 64 km, 96 km Downloading can be scripted
Summary Oct 4, 2003 Finished Oct 1978 to mid-Nov 2002 no more inland lake data no 2003 Canadian precip currently planning the real-time NARR will use different datasets as some precip/lake data are not available in real time currently planning subsets and archive Dec 2003 internet-2 will be available at NCDC and distribution to archive sites can start Until NARR appears at archive sites, you can look at 1 year of merged data at NCEP. http: //wwwt. emc. ncep. noaa. gov/mmb/rreanl/index. html