An Overview of Labor Market Science is built

An Overview of Labor Market Science is built up with facts, as a house is with stones. But a collection of facts is no more a science than a heap of stones is a house. -Jules Henri Poincar’e- l Labor Force: All those over 15 years of age who are either employed, actively seeking work, or awaiting recall from a layoff. (The age may vary in different countries. For example, it is 16 years of age for the U. S. ) l Labor Force Participation Rate: The ratio of the labor force to those of age over 15.
. l Unemployment")
l Unemployment: Those in the labor force who are not employed(for pay). l Unemployment Rate: The ratio of those unemployed to those in the labor force. This is the most widely cited measure of labor market condition.

l Wage Rate: The price of labor per working hour. Wage rate × Units of time worked = Earnings + Fringe benefit = Compensation + Unearned income (interest, dividends, transfer payments etc. ) = Income
 Population (Age 15 and over) New Entrants Reentrants")
Employed Labor Force (Employed plus Unemployed) Population (Age 15 and over) New Entrants Reentrants Dropouts Retirements Not in Labor Force Layoffs Quits New Hire Recalls Unemployed (Not employed, but looking for work or awaiting recall)

§ Demand for Labor Product demand Wages, amount of K Choice of technologies Determines number of workers employed Wages Wage Changes: (1) Scale Effect (2) Substitution Effect A demand curve for labor tells us how the desired level of employment varies with changes in the price of labor when the other factors affecting demand are held constant. D # of workers

§ Supply of Labor Market Supply: The supply of labor to a particular market is positively related to the wage rate prevailing in that market holding other wages constant. Wages S 2 S S 1 # of workers

Wages Supply to Firms: The supply to a firm would be a horizontal line since each firm is a price taker in the competitive labor market. W* # of workers

§ Determination of the Wages Supply W 2 W 1:demand exceeds supply W* W 2:supply exceeds demand W*:Market-Clearing Wage W 1 Demand # of workers

Wage rates are determined by the market and announced to individual firm. Wages Supply W* SA W* Market Demand DA # of workers A Typical Firm
 勞動 力 (千人 ) 就業")
重要人力指標 項目別 總計 男性 年 度 經濟 成長 率(%) 勞動 力 (千人 ) 就業 者 (千人 ) 失業 者 (千人 ) 勞動 力參 與率 (% ) 勞動力 (千人) 就業者 (千人) 70 6. 16 6764 6672 92 57. 82 4503 71 3. 55 6959 6811 149 57. 93 72 8. 45 7266 7070 197 73 10. 60 7491 7308 74 4. 95 7651 75 11. 64 76 女性 失業者 (千人) 勞動 力參 與率 (% ) 勞動 力 (千人 ) 4448 55 76. 78 4605 4509 96 59. 26 4687 4561 183 59. 72 4778 7428 222 59. 49 7945 7733 212 12. 74 8183 8022 77 7. 84 8247 78 8. 23 79 80 就業者 (千人) 失業 者 (千人 ) 勞動力 參與率 (%) 2261 2224 37 38. 76 76. 47 2354 2301 53 39. 30 126 76. 36 2580 2509 71 42. 12 4661 116 76. 11 2713 2647 67 43. 30 4860 4719 141 75. 47 2790 2709 81 43. 46 60. 37 4957 4821 136 75. 15 2988 2912 75 45. 51 161 60. 93 5065 4966 100 75. 24 3118 3057 61 46. 54 8107 139 60. 21 5130 5043 87 74. 83 3116 3064 52 45. 56 8390 8258 132 60. 12 5231 5149 82 74. 84 3159 3110 49 45. 35 5. 39 8423 8283 140 59. 24 5263 5175 88 73. 96 3160 3108 52 44. 50 7. 55 8569 8439 130 59. 11 5355 5274 80 73. 80 3214 3165 49 44. 39
 項目別 總計 男性 年 度 經濟 成長 率(%) 勞動 力 (千人) 就業 者")
重要人力指標(續) 項目別 總計 男性 年 度 經濟 成長 率(%) 勞動 力 (千人) 就業 者 (千人 ) 失業 者 (千 人) 勞動力 參 與率 (%) 勞動力 (千人) 81 7. 49 8765 8632 132 59. 34 82 7. 01 8874 8745 128 83 7. 11 9081 8939 84 6. 42 9210 85 6. 10 86 女性 就業者 (千人) 失業 者 (千人 ) 勞動力 參 與率 (%) 3304 3252 52 44. 83 72. 67 3377 3323 54 44. 89 84 72. 44 3485 3428 58 45. 40 5558 101 72. 03 3551 3487 64 45. 34 5662 5508 154 71. 13 3648 3560 88 45. 76 58. 33 5731 5562 169 71. 09 3701 3613 88 45. 64 257 58. 04 5780 5610 169 70. 58 3767 3679 88 45. 60 9385 283 57. 93 5812 5624 188 69. 93 3856 3761 95 46. 03 9784 9491 293 57. 68 5867 5670 197 69. 42 3917 3821 95 46. 02 -2. 22 9832 9383 450 57. 23 5855 5553 302 68. 47 3977 3830 148 46. 1 91 3. 94 9969 9454 515 57. 34 5896 5547 348 68. 22 4074 3907 167 46. 59 92 3. 33 10076 9573 503 57. 34 5904 5579 326 67. 69 4172 3994 177 47. 14 93 5. 71 10240 9786 454 57. 66 5968 5680 288 67. 78 4272 4106 166 47. 71 就業者 (千人) 失業 者(千 人) 勞動 力參 與率(%) 勞動 力(千 人) 5460 5380 81 73. 78 58. 82 5497 5422 75 142 58. 96 5595 5511 9045 165 58. 71 5659 9310 9068 242 58. 44 6. 37 9432 9176 256 87 4. 33 9546 9289 88 5. 32 9668 89 5. 78 90


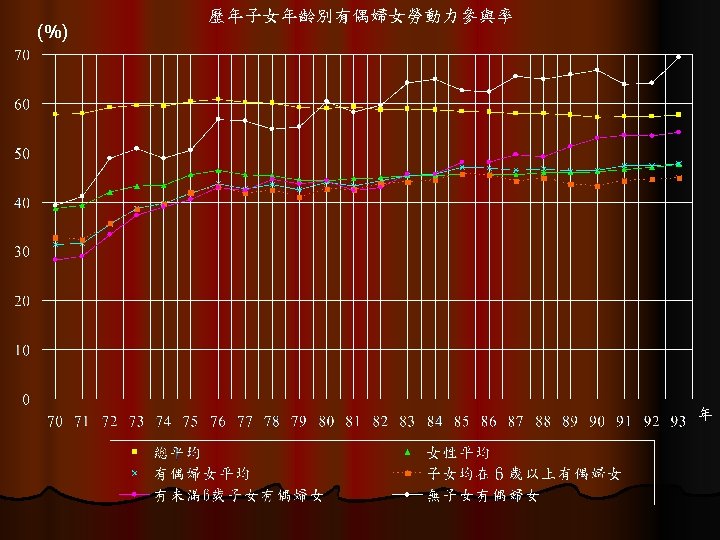
歷年五月台灣地區有偶婦女勞動參與率 項目 總平均 女性 平均 有偶婦女 平均 子女均在6歲 以上有偶婦女 有未滿 6歲子 女有偶婦女 尚無子女 有偶婦女 70 57. 82 38. 76 31. 42 32. 75 28. 26 39. 30 71 57. 93 39. 30 31. 51 32. 29 28. 99 41. 12 72 59. 26 42. 12 35. 53 35. 70 33. 40 48. 89 73 59. 72 43. 30 38. 74 38. 55 37. 34 50. 88 74 59. 49 43. 46 39. 84 39. 63 39. 07 48. 95 75 60. 37 45. 51 41. 82 41. 85 40. 55 50. 62 76 60. 93 46. 54 43. 74 43. 18 42. 95 56. 75 77 60. 21 45. 56 42. 66 41. 82 42. 29 56. 55 78 60. 12 45. 35 43. 65 42. 35 44. 64 54. 79 79 59. 24 44. 50 42. 49 41. 04 43. 69 55. 21 80 59. 11 44. 39 44. 00 42. 66 44. 36 60. 50 年
 項目 總平均 女性 平均 有偶婦女 平均 子女均在6歲 以上有偶婦女 有未滿 6歲子 女有偶婦女 尚無子女 有偶婦女")
歷年五月台灣地區有偶婦女勞動參與率(續) 項目 總平均 女性 平均 有偶婦女 平均 子女均在6歲 以上有偶婦女 有未滿 6歲子 女有偶婦女 尚無子女 有偶婦女 81 59. 34 44. 83 43. 23 42. 49 42. 30 58. 24 82 58. 82 44. 89 44. 39 43. 78 42. 99 59. 71 83 58. 96 45. 40 45. 41 44. 03 45. 73 64. 16 84 58. 71 45. 34 45. 75 44. 45 45. 75 65. 01 85 58. 44 45. 76 47. 11 45. 70 48. 15 62. 66 86 58. 33 45. 64 46. 98 45. 48 48. 16 62. 42 87 58. 04 45. 60 46. 50 44. 20 49. 60 65. 58 88 57. 93 46. 03 46. 82 44. 87 49. 24 64. 99 89 57. 68 46. 02 46. 34 43. 54 51. 39 65. 97 90 57. 23 46. 1 46. 48 43. 23 52. 99 66. 76 91 57. 34 46. 59 47. 30 44. 39 53. 57 63. 94 92 57. 34 47. 14 47. 34 44. 69 53. 46 64. 30 93 57. 66 47. 71 47. 84 44. 92 54. 15 69. 37 年
- Slides: 16