An Overview of Capillary Electrophoresis Electrophoresis The movement

 particles/fragments through a medium. Cations migrate toward the negatively")


 Fill with Polymer Solution Argon Ion Laser 50 m x 47")


 Capillary or Gel Lane Principles of Sample Separation and")


 absorbs incident light (excitation) and in response")


 can be injected into the")


- Slides: 56
An Overview of Capillary Electrophoresis
Electrophoresis The movement of (charged) particles/fragments through a medium. Cations migrate toward the negatively charged electrode (cathode) and anions are attracted toward the positively charged electrode (anode). Affected by: • Size • Shape/Conformation of Fragment • p. H • Matrix/Medium • Temperature
Capillary Electrophoresis • Operation of a CE system involves application of a high voltage (typically 10 -30 k. V) across a narrow bore (25 -100µm) capillary. • The capillary is filled with a viscous polymer solution which serves as the sieving medium. • The ends of the capillary are dipped into reservoirs filled with the electrolyte.
Capillary Electrophoresis • Electrodes made of an inert material such as platinum are also inserted into the electrolyte reservoirs to complete the electrical circuit. • A small volume of sample is injected into one end of the capillary. • The capillary passes through a detector, usually a UV absorbance detector, at the opposite end of the capillary.
Capillary Electrophoresis • Application of a voltage causes movement of sample ions towards their appropriate electrode usually passing through the detector. • The plot of detector response with time is generated which is termed an electropherogram.
Capillaries • The capillaries used are normally fused silica capillaries covered with an external polyimide protective coating to give them increased mechanical strength – bare fused silica is extremely fragile. • A small portion of this coating is removed to form a window for detection purposes. The window is aligned in the optical center of the detector.
Capillaries • The inner surface of the capillary can be chemically modified by covalently binding (coating) different substances onto the capillary wall. • These coatings are used for a variety of purposes such as to reduce sample adsorption or to change the ionic charge on the capillary wall.
Capillary Gel Electrophoresis: The forensic capillaries typically used in CE from ABI are 47 cm x 50 um - Uncoated. 36 cm from the cathode to the detector With Performance Optimized Polymer 4% (POP 4) composed of: 4%DMA homopolymer 8 M urea 5% 2 -pyrrolidinon 100 m. M N-Tris-(hydroxymethyl)methyl-3 aminopropane-sulfonic acid (TAPS) at p. H 8. 0
DNA Separation Mechanism - DNADNA DNA- DNA • Size based separation due to interaction of DNA molecules with entangled polymer strands • Polymers are not cross-linked (as in slab gels) • “Gel” is not attached to the capillary wall • Pumpable -- can be replaced after each run • Polymer length and concentration determine the separation characteristics +
Capillary Electrophoresis (CE) Fill with Polymer Solution Argon Ion Laser 50 m x 47 cm - Burn capillary window + DNA Separation occurs in Inlet (cathode) 15 k. V ~30 minutes. . . Data Acquisition Outlet (anode)
How does CE work? • Samples amplified, denatured • Electrokinetic injection – gets sample into capillary • Electrophoresis - size separation of DNA • Detection – Excitation of dyes and collection of emission wavelengths • Software analysis
Multiple Instrumentation Options for Different Sample Throughput 310 1 cap 3100 -Avant 4 cap 3100 16 cap
ABI PRISM® 310 Genetic Analyzer Syringe Pump Heat Plate Capillary Autosampler Detection Window
Electrokinetic Injection
Electrokinetic Injection • The capillary and electrode are placed into the sample solution vial and a voltage is applied. If the sample is ionized and the appropriate voltage polarity is used then sample ions will migrate into the capillary. This type of injection is known as electrokinetic sampling.
Electrokinetic Injection Process Capillary Electrode Amount of DNA is inversely Proportional to the ionic strength. DN A- DNA- The amount of salt in the sample affects how much DNA migrates into the capillary. Sample Tube
Separation • Run temperature -- 60 o. C helps reduce secondary structure on DNA and improves precision • Electrophoresis buffer -- urea in running buffer helps keep DNA strands denatured • Capillary wall coating -- dynamic coating with polymer • Polymer solution -- POP-4 acts as a sieving medium to perform the size based separation of DNA
Separation • DNA molecules posses a constant mass to charge ratio • Therefore regardless of the size of the DNA molecule they will have the same force pulling on it when an electrical field is applied • A sieving medium can then be used that will retard the bigger molecules and allow the smaller molecules to move faster. This allows for a size based separation.
Fluorescent Labeling of PCR Products • Dyes are attached to one primer in a pair used to amplify a STR marker • Dyes are coupled to oligonucleotides (primers) through NHS -esters and amine linkages on the 5’end of the primer usually through a 6 -carbon spacer --- Dye-(CH 2)6 -primer • Dye-labeled oligonucleotide is incorporated into PCR product during multiplex PCR amplification giving a specific color “tag” to each PCR product • Dyes can be spectrally distinguished using virtual filters and CCD imaging to yield different colored peaks in ABI 310 electropherogram
Laser Used in ABI 310 • • • Argon Ion Laser 488 nm and 514. 5 nm for excitation of dyes 10 m. W power Lifetime ~5, 000 hours (1 year of full-time use) Cost to replace ~$5, 500 Leads to highest degree of variability between instruments and is most replaced part • Color separation matrix is specific to laser used on the instrument
Labeled DNA fragments (PCR products) Capillary or Gel Lane Principles of Sample Separation and Detection Sample Detection Size Separation Ar+ LASER CCD Panel (488 nm) Color Separation Detection region Fluorescence ABI Prism spectrograph
CCD Chip Color Detection “VIRTUAL FILTERS” SPATIAL AXIS SPECTRAL AXIS
Detection Filters determine which wavelengths of light are collected onto the CCD camera • Virtual filters – hardware (CCD camera) – software (color matrix)
Detection Methods Fluorescence Label one of the primers for each locus
Fluorescence results when a fluorescent dye (fluorophore) absorbs incident light (excitation) and in response emits light (emission) at a different wavelength – During excitation a photon from a laser source excites fluorophore electron to an excited state. – The electron then undergoes a conformational change and the excited electron emits a photon at a lower energy as it returns to the ground state.
Fluorescence • Because energy and wavelength are inversely proportional to each other the emission photon has a higher wavelength than the excitation photon • The difference in wavelength between the fluorescence excitation maximum and fluorescence emission maximum is called the Stokes shift. • The Stokes shift allows the use of optical filters to separate excitation light from emission light.
Stokes Shift excitation emission
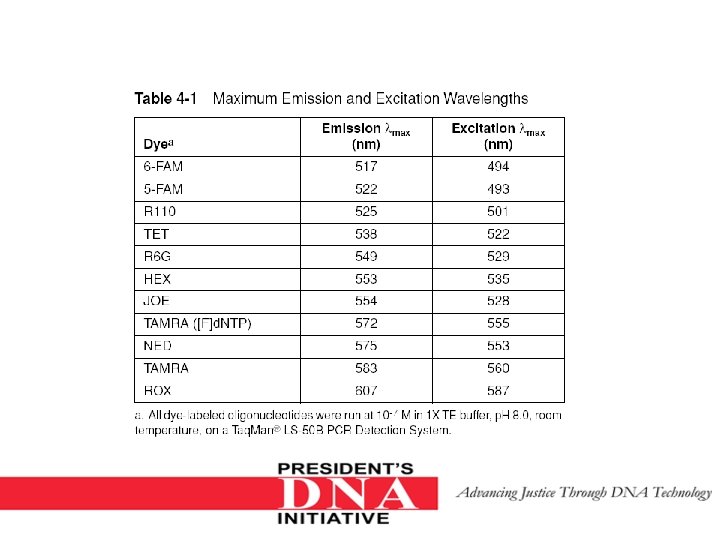
Fluorescent Emission Spectra for ABI Dyes 5 -FAM JOE NED ROX ABI 310 Filter Set F Normalized Fluorescent Intensity 100 80 60 40 20 0 520 540 560 580 600 620 Laser excitation WAVELENGTH (nm) (488, 514. 5 nm) 640
Dye Set G 5
Fluorescence Measurements • Spectral overlap occurs because there are regions between different dyes that share the same wavelength. • Multicomponent analysis is performed with a mathematical matrix that subtracts out the contributions of other dyes in each measured fluorescent dye. • One method to perform multicomponent analysis is to examine a standard set of DNA fragments labeled with each dye. This is known as matrix standard samples. • The computer software analyzes the data from each of the dyes and creates a matrix file to reflect the color overlap between the various dyes.
4 - and 5 -dye Matrices Generated on the Same ABI PRISM® 310 Genetic Analyzer 4 -dye Matrix Table 5 -dye Matrix Table
Troubleshooting Capillary Electrophoresis • • Offscale data Migration problems Laser problems Buffer depletion Capillary failure Low or no current Spikes in baseline
Offscale data ØIf too much sample DNA is added to the PCR reaction mixtures, the fluorescence intensity from the PCR products may exceed the linear dynamic range for detection by the instrument. This is referred to as “off-scale” data. ØMulticomponent analysis cannot be performed accurately on data that is off-scale. Samples with off-scale peaks will exhibit raised baselines and/or excessive “pull-up” of one or more colors under the off-scale peaks. ØAnalyzed data from off-scale peaks should not be used for quantitative comparisons. For example, the stutter peak that corresponds to an off-scale main peak is likely to be overestimated.
Pull-up Due to signal and spectral overlap
Migration Problems • Migration problems can be visualized when samples on the same run in different injections migrate at a different rate from each other. • This is best seen when the Ladder migrates differently from samples. The ladder is used to assign allele calls to the samples. • If the samples and ladder are not sized within the same range then the samples peaks will not have the correct allele calls. • One cause of migration problems is fluctuations in temperature during a run.
Migration Problems • The instruments are equipped with a hot plate or oven to keep the temperature constant during the electrophoresis process. • However there are regions of the capillary that are not in contact with the heat source. If there are variations in the room temperature during the course of a run, samples will migrate at different rates. • High temperatures will cause samples to migrate faster and colder temperatures will cause samples to migrate slower.
Migration Problems
Laser Problems • The laser used in the genetic analyzers is an Argon ion laser. • Overtime a condition known as outgassing can occur. Outgassing is the slow release of gas (argon) from the laser tube. • This results in a loss of laser power. • As the laser power reduces so does the resulting signal produced by the DNA molecules. The result is low peak heights which will continue to get lower over time.
Buffer depletion • If there is a drop off in the current this can be caused by buffer depletion. • During electrophoresis ions move through the capillary. • Positive ions move to the negatively charged electrode and negative ions to the positively charged electrode. • This ion movement results in an imbalance referred to as buffer depletion • To avoid this from happening the buffer should be changed regularly
Capillary Failure • Abnormally broad peaks due to loss of resolution can be caused by capillary failure. • Capillary failure occurs as a result of DNA and enzymes from the injected samples adhering to the capillary wall. • To prevent this Applied Biosystems does not recommend using a capillary past 100 injections. • Many laboratories have validated capillaries for use well past 100 injections.
Capillary Failure • A good way to check to see if the problem is due to capillary failure or a bad sample will be to look at the size standard peaks. • If the size standard peaks are as they should be but the samples peaks are low or appear to have lost resolution their may be a problem with the way the sample was set up. • Also if both the size standard and sample peaks are bad in one injection but there are no problems in other injections that one sample may have been injected badly.
Low or No current • There are several problems which can cause low or no current. • A common problem is if the capillary ends are not stored in water or buffer when the instrument is not in use. • If the ends of the capillary dry out then urea or other salts from the buffer will form crystals at the capillary ends. • These crystals can partially or fully clog the capillary ends resulting in low or no current. This will be seen as consistent low level data.
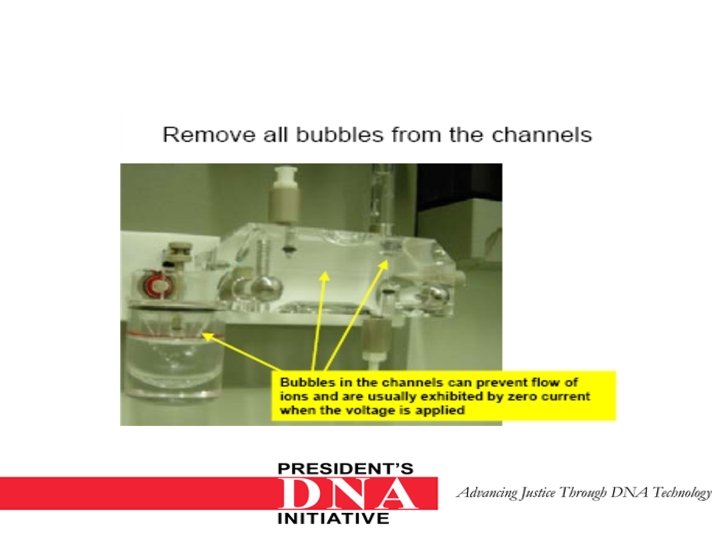
Low or no current • Low or no current can also be caused by bubbles in the pump block. • These air bubbles block the flow of current from one electrode to the next. • The pump block should always be checked to ensure no bubbles are present in pump block or in base of syringe since an air bubble there may be injected into the pump block.
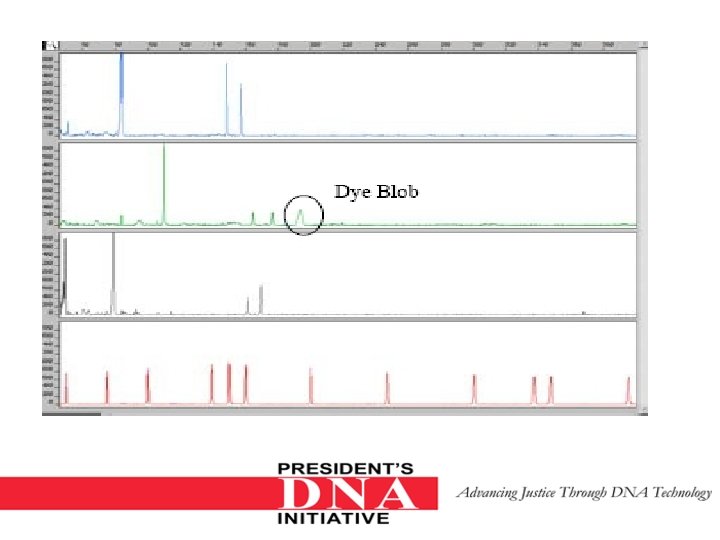
Dye Blobs • Free dye (not coupled to primer) can be injected into the CE capillary and interfere with detection of true STR alleles • Dye blobs are wider and usually of less intensity than true STR alleles (amount depends on the purity of the primers used) • Dye blobs usually appear at an apparent size that is unique for each dye (e. g. , HEX ~170 bp)
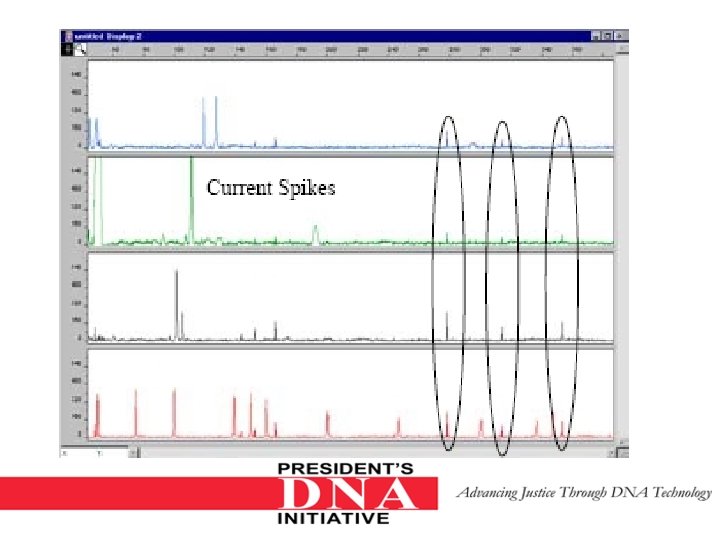
Spikes in Baseline • Spikes in baseline appear as peaks but they usually have a sharp point and are in all dye colors. • They can be caused by fluctuations in the current, precipitates in the polymer or old polymer.
Troubleshooting The operator manuals for the Capillary Electrophoresis instruments have an extensive section on troubleshooting bad data due to problems with the instrument.
ABI PRISM® 3100 Genetic Analyzer
ABI PRISM® 3100 -Avant Genetic Analyzer: Doors Open
Instrument Open • Forced air oven with two internal fans to provide thermal control and uniformity • Thermostat inside oven for continuous monitoring • Internal instrument lighting
4 -Capillary Array
3100 - Avant System Overview • 4 capillary instrument with upgrade option to 16 -capillaries without taking additional bench space • Based on 3100 technology • 16 -capillary instrument = 3100 system
3100 System Overview • Dual side illumination • Temperature range 18 -65º C • Autosampler supports 96 and 384 trays (two trays per set up) • Up to 24 hours unattended operation