An Introduction to the IRI Data Library Objectives

An Introduction to the IRI Data Library

Objectives – Become familiar with the organization of the Data Library – Learn how to find datasets and select spatial and temporal domains – See how to perform simple arithmetic analyses – See how to create customized maps and graphs – Learn how to download data and images – Understand how the Data Library is related to the IRI Map Room

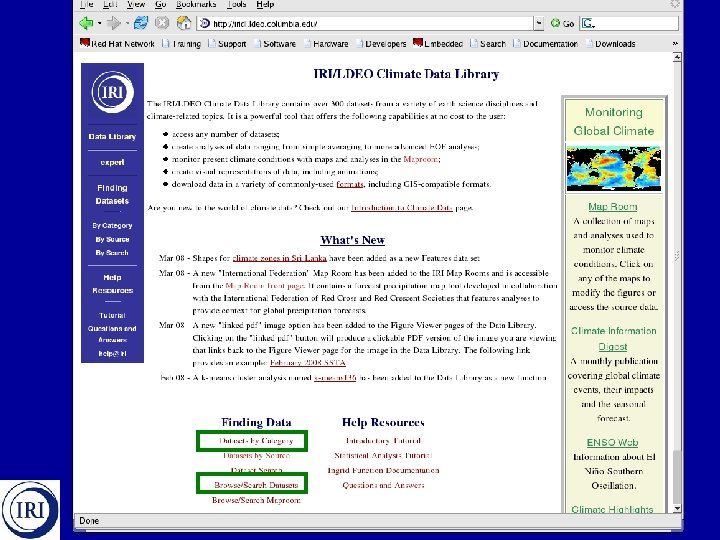
The IRI Data Library is a… • Data repository – >300 datasets covering all aspects of climate-related characteristics • Data analysis tool – Arithmetic operations EOF analysis • Data visualization tool – Time series, maps, cross-sections • Data download resource – Free access to text, binary, GIScompatible, etc. data files http: //iridl. ldeo. columbia. edu

Data Library Home Page
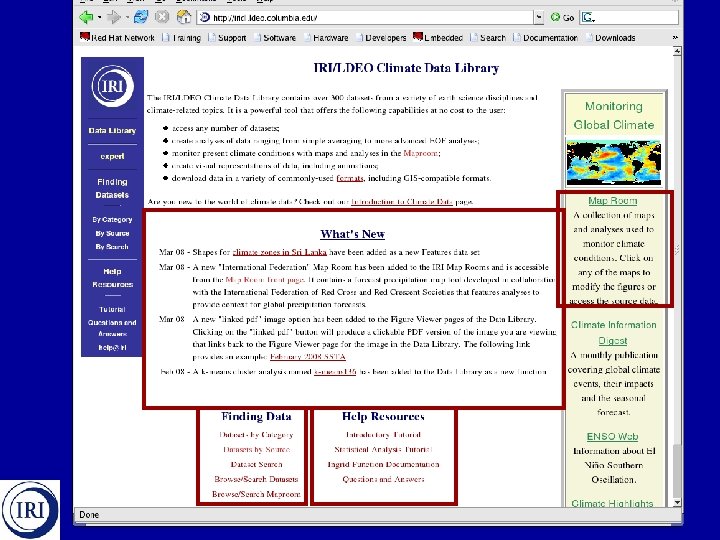

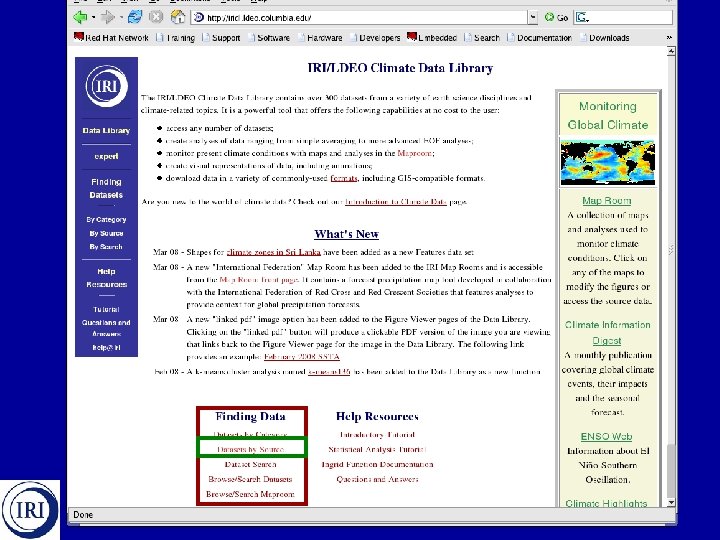
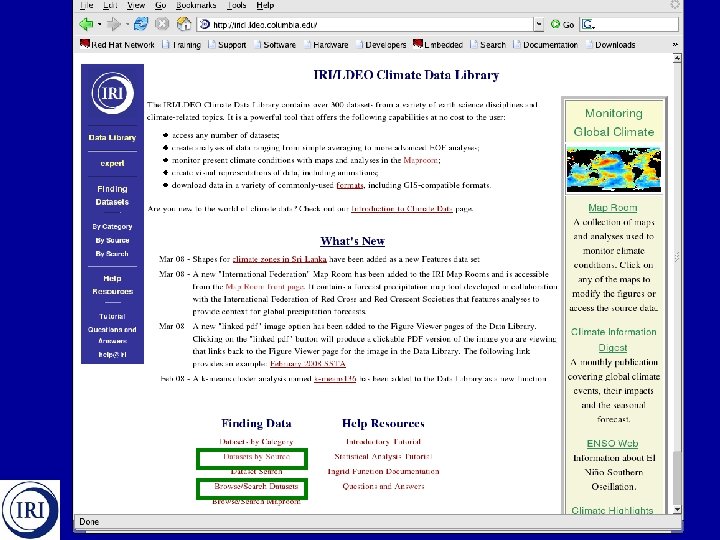
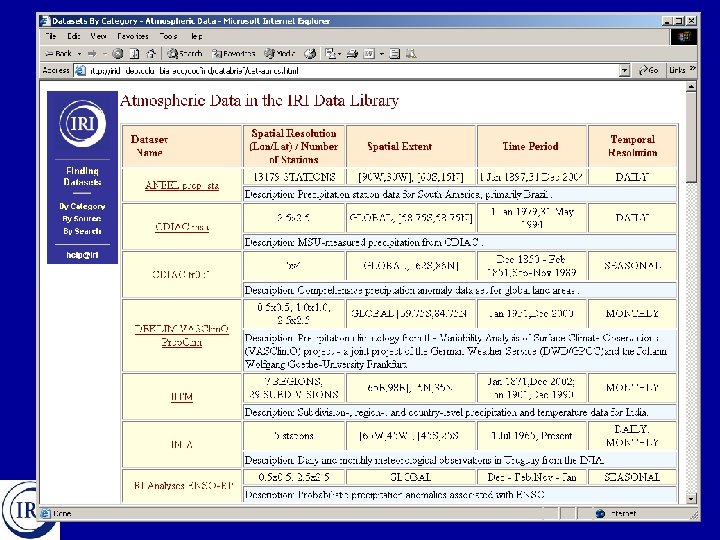
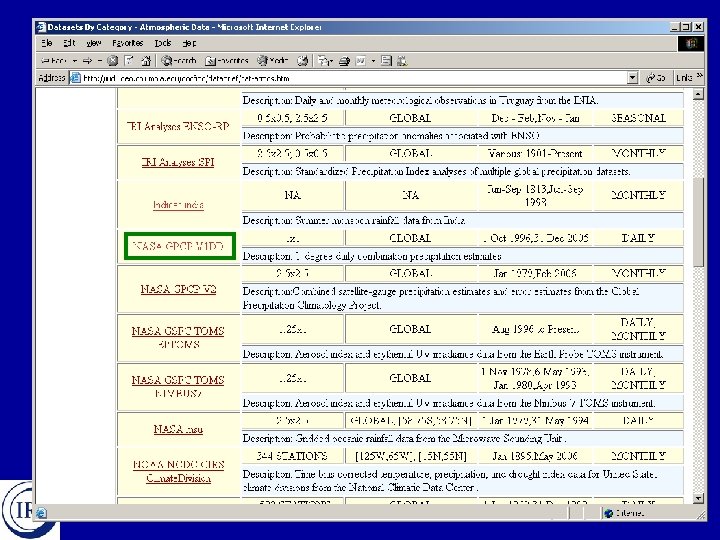
Finding Datasets
 -Datasets by instrument")
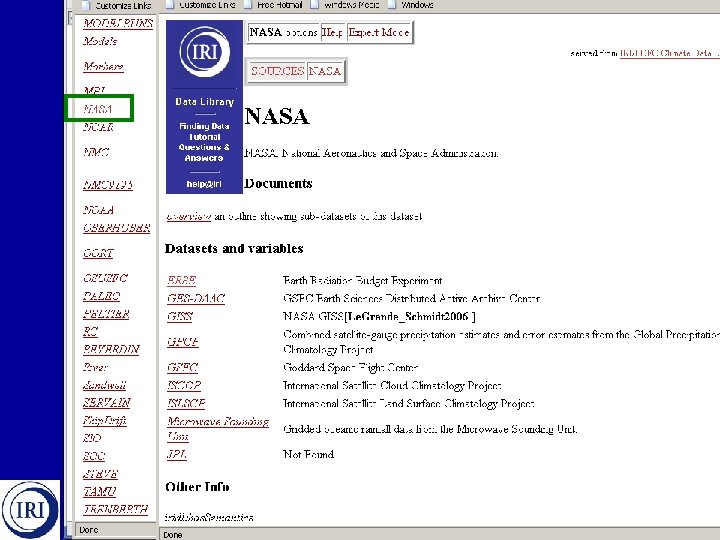
Structure of Datasets -Primary Organization -NASA -ERBE (Earth Radiation Budget Experiment) -Datasets by instrument -Dataset -Variables -GES-DAAC (Distributed Active Archive Center) -Dataset Example -GISS -Variables -Le. Grande_Schmidt 2006 (authors) -Dataset -GPCP (Global Precip Climatology Project) -Datasets by version -Variables -Primary Organization. . -Datasets by instrument -Variables . .

Data Browse/Search Map Room Search

Air-Sea Interface Atmosphere Climate Indices Cloud Characteristics and Radiation Budget Fisheries Forecasts Historical Model Simulations Hydrology Ice Oceanography Topographic and Land Characteristics

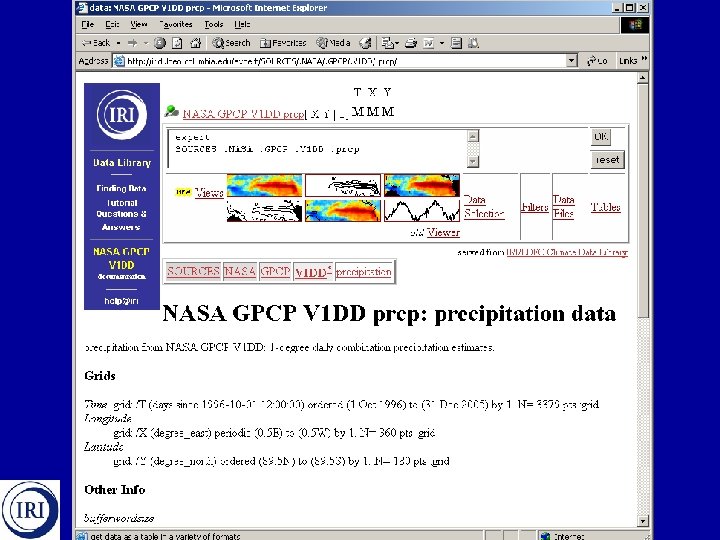
Dataset Page Contents and Structure Gridded Datasets

Function Bar -Access to data manipulation, visualization, download tools

Source Bar -Navigational information -Where am I? What operations have I performed? -Documentation access Documentation Access Points

Dataset and Variables -Access to variables or lower-level datasets
 -Information about grids on which data is dependent -Latitude (Y) -Longitude")
Grids (Independent Variables) -Information about grids on which data is dependent -Latitude (Y) -Longitude (X) -Time (T) -Others (height/depth, ensemble member, etc. )
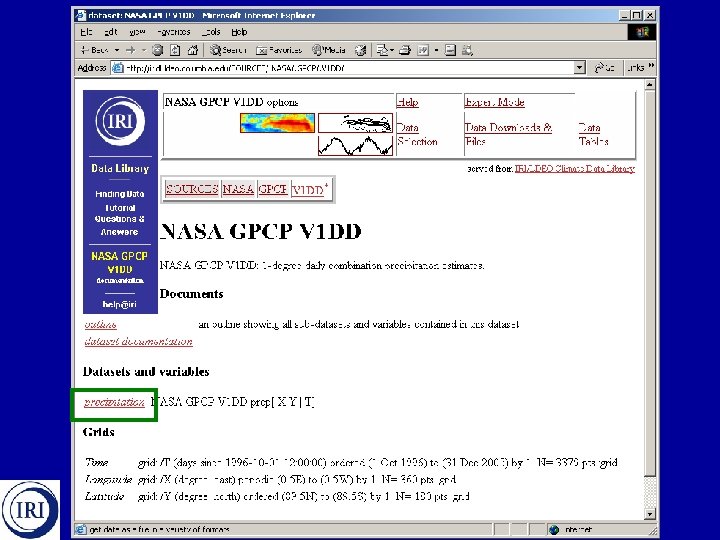

Note new information -Selected variable shown in Source Bar -Datasets and variables heading gone -More information about variable below

Important information about variable -Missing value indicator -Units

Function Bar -Access to data manipulation, visualization, download tools View Links -Access data viewer

Data Selection -Data domain selection

Filters -Common data manipulation tools

- Monthly Climatology/Anomaly - Average over any ind. variable - Root mean square - Find max/min values over any ind. variable

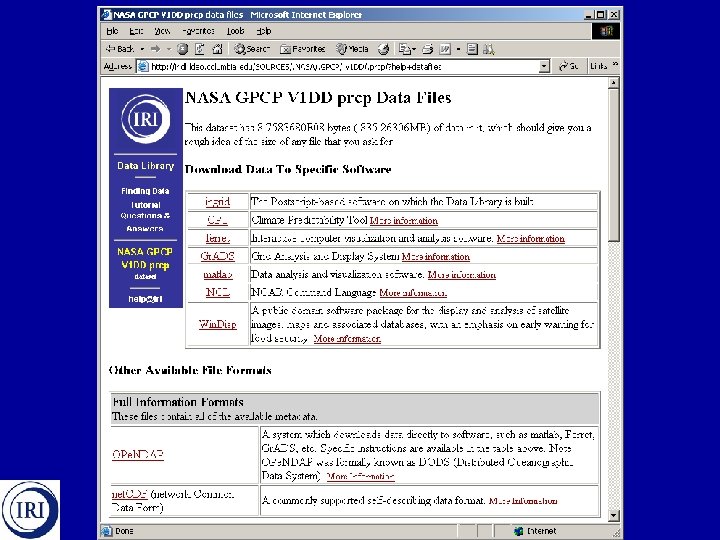
Data Files -Access to data downloads

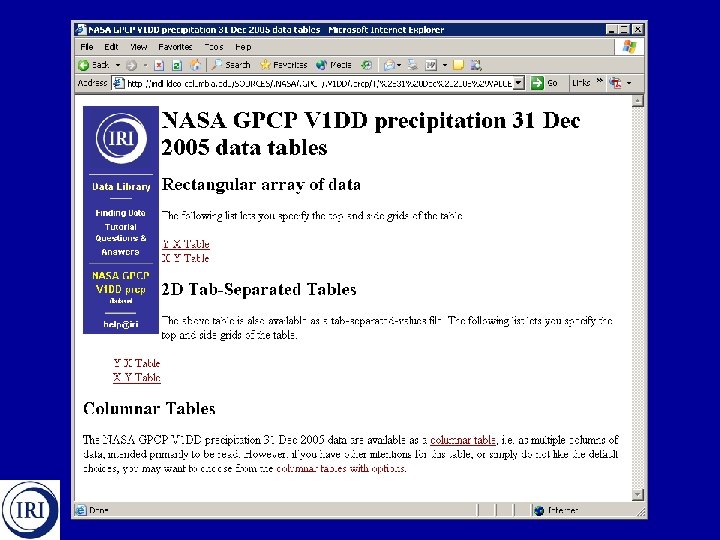
Tables -Access to tabular data for Excel, etc.

Expert mode -Manually enter Ingrid code

Dataset Page Contents and Structure Station Datasets

Three key differences 1. Maps displaying stations

Three key differences 1. Map displays station locations 2. Station ids in grid info 3. “Extra” variables provide station information A word of caution… The time grid information represents the full extent of the dataset. This does NOT mean that all of the stations in the dataset have data for the full time period.

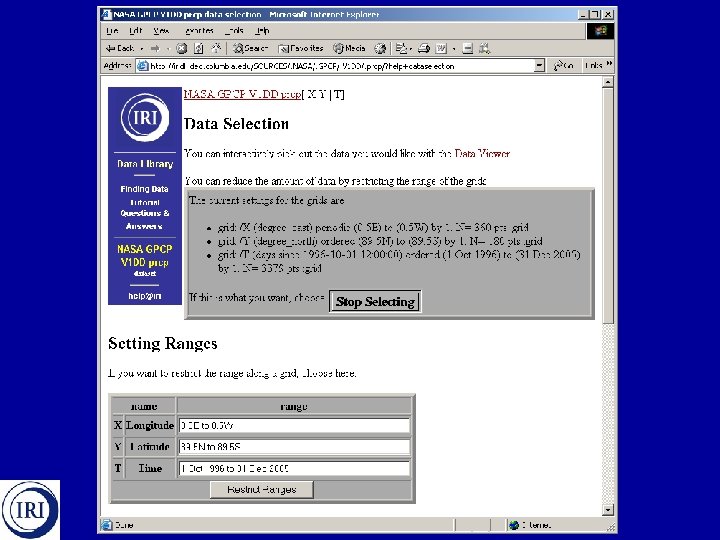
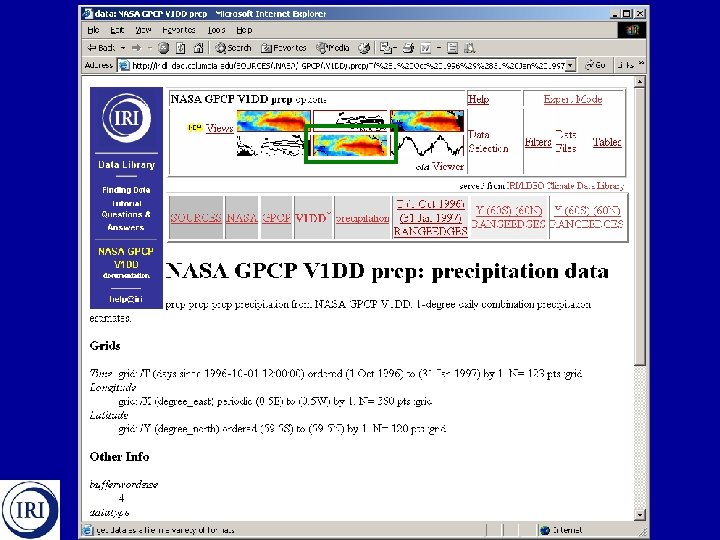
Selecting Data Domain Gridded Datasets

Data Selection -Data domain selection

Data Selection Step 1. Change text in Setting Ranges boxes using same syntax as text already there. Step 2. Click Restrict Ranges button. Step 3. When satisfied information in top box represents desired domain, click the Stop Selecting button.
 1 Oct 1996 to 31 Jan 1997 Latitude (Y) 60 S")
Example Time (T) 1 Oct 1996 to 31 Jan 1997 Latitude (Y) 60 S to 60 N Note: Center of nearest grid point automatically selected.

Note: New data domain now represented in Source Bar and grid information.

Selecting Data Domain Station Datasets
")
Key difference 1. Selecting station(s)

Option 1: Select all stations in an area Step 1. Click and drag a box over area of interest (or manually enter lat/lon limits and click redraw button). Step 2. When satisfied with area selection, click the List of stations in current view link. Step 3. Click the Dataset (and map) all data found in search link.

Example Select stations in southern tip of Africa

Example Select stations in southern tip of Africa

Note: New data domain now represented in Source Bar, map, and grid information.

Option 2: Search for a particular station Step 1. Click on the Searches link. Step 2. Enter location of interest and click on the Search [Dataset Name] button. Step 3. To select all matched stations, click the Dataset (and map) with all data found in search link. To select one or more of the matched stations, select the appropriate check boxes and click the Get Marked Stations button.
 in Windhoek, Namibia")
Example Select station(s) in Windhoek, Namibia

Note: New data domain now represented in Source Bar, map, and grid information.

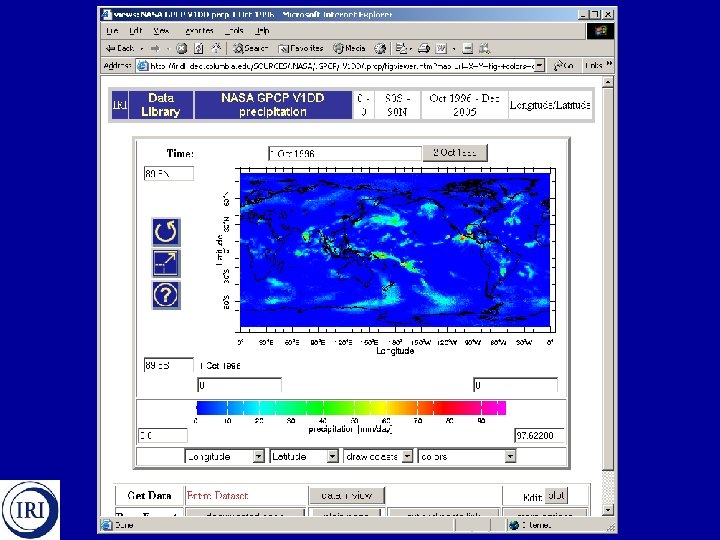
Visualizing Data: Making maps and graphs

Redraw Zoom To Full Help

Change Time -Change text and redraw -Select button with adjacent date Make Animation -Enter range of dates (date 1 “to” date 2) and redraw

Change Region -Click and drag box over area -Change lat/lon limits and redraw

Change Color Scale Limits -Enter new limits and redraw

Change Map Options -Use pull down menus to: -Change axis selection -Draw admin boundaries -Draw contours, etc. -Use Edit plot button to add more customizations

Change Map Options -Select a new color scale -Add admin boundaries Return to Viewer -Click more options

Download map -Select desired format for map and color scale

Return to dataset page -To maintain domain selections from viewer, click data in view button. -To return without saving selections, click Entire Dataset link or dataset link at top of page.

Downloading Data Files

Download Data File Step 1. Select Data Files link. Step 2. Select link for desired format.
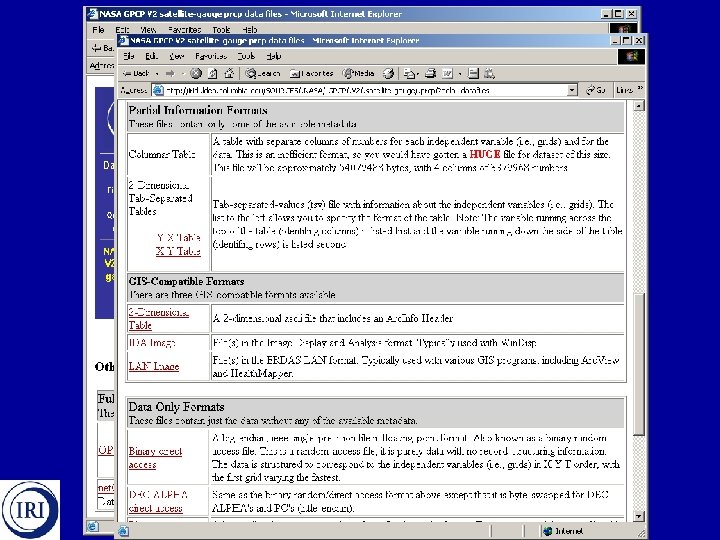

Download Tables Step 1. Select Tables link. Step 2. Select link for desired format.
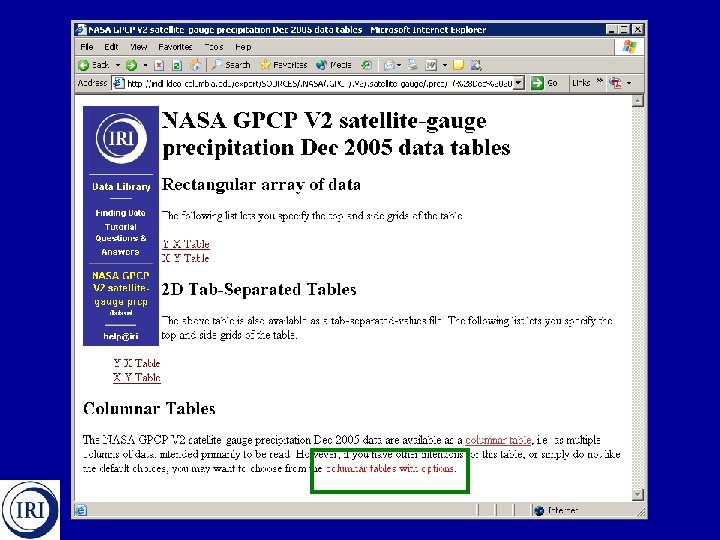

Note: If planning to import into Excel, select tsv format from columnar tables with options page.

Analysis Options… http: //iridl. ldeo. columbia. edu/dochelp/Stat. Tutorial/

IRI Map Room

Climate Information in Context http: //iridl. ldeo. columbia. edu/maproom/. IFRC/. Forecasts/

Climate Information in Context http: //iri. columbia. edu/~mbell/MDG/

Flying Solo • Tip: Bookmark analyses you might like to use again • What to do when you have a question: 1. Look for similar example in the Tutorials and Documentation resources 2. Send email to help@iri. columbia. edu ** Copy the url of the page in question into the email

Location of slides: http: //iri. columbia. edu/~mbell/ccihc/
- Slides: 74