An introduction to Quality Improvement Models Learning Outcomes


 •")

 As we")


 • Any delays? (eg. Wait")


- Slides: 41
An introduction to Quality Improvement Models
Learning Outcomes • Learning about Model for Improvement • Understanding and using Driver Diagrams • Understanding and using Process Mapping • Understanding and working on the PDSA cycle • Being able to apply these to a change for improvement scenario in your role
Quality and Improvement • Quality is the degree of excellence in healthcare (Health Foundation Definition) • Quality improvement is better patient experience and outcomes achieved through changing provider behaviour and organisation through using a systematic change method and strategies
“At the core of any model is influence over clinical behaviour to improve quality and minimise waste. Most of the solutions lie within the hearts and minds of our frontline clinical/care staff. The perfect model of care does not exist, and we need to create the capacity to piece together all the learning from other systems. The commitment, encouragement and resilience of the people who wish to progress this is our greatest asset and some of our answers may not appear so obviously to begin with. ” Extract from Improving quality and reducing inequities: a challenge in achieving best care http: //www. ncbi. nlm. nih. gov/pmc/articles/PMC 1426185/
Six Dimensions of Quality • • Safety - do no harm Timely - without undue delay; who receive and those who give Effective - produces desired results Efficient - avoiding waste, including waste of equipment, supplies, ideas, and energy • Equitable - providing care that does not vary because of gender, ethnicity, disabilities etc. in the patient; or at population level • Patient-centred - providing care that is respectful and responsive; needs, and values; seamless; provided with respect and compassion http: //www. ncbi. nlm. nih. gov/pmc/articles/PMC 1426185/
Not a New Idea… @NHS_Health. Ed. Eng
More Modern Statistics • The NHS pays out around £ 400 million in settlement of clinical negligence claims every year • Leape et al (1993) found 2/3 rd mistakes preventable - 28% due to mistake by health professional and 42% due to other factors
Quality Improvement in Healthcare In the words of Dr Mike Evans @NHS_Health. Ed. Eng
Model for Improvement
What are we trying to accomplish? How will we know that change is an improvement? What change can we make that will result in improvement? aims measurements change ideas testing ideas before implementing changes Langley, G. , Nolan, K. , and Nolan, T. , 1994. The Foundation of Improvement, Quality Progress, June 1994
• What changes are to be made to the next cycle? • Can the change be implemented? • Complete the analysis • Compare with predictions • Summarise Act Plan Study Do • Set objectives • Questions • Who, where and when • Collect data to answer questions • Carry out the plan • Collect the data • Analysis Langley, G. , Nolan, K. , and Nolan, T. , 1994. The Foundation of Improvement, Quality Progress, June 1994
PDSA Cycle How can we achieve this? nt e em ta AP v SD ro da p Im ith s w u s o p nu Ste i t n ll Co ma S AP SD Ideas/ theories AP SD AP SD SOMETHING BIG!
© NHS Institute for Innovation and Improvement 2010. All rights reserved. Meeting rooms Design Approve Implement ! Real world Spending more time on the WHAT than the HOW! Courtesy of Patient Safety First
© NHS Institute for Innovation and Improvement 2010. All rights reserved. Meeting rooms Design Approve Measurement Test & refine Real world Test & refine Implement Which is typical of your organisation? Courtesy of Patient Safety First
15 © NHS Institute for Innovation and Improvement 2010. All rights reserved. PDSA Cycle Traditional Approach to Activities D P S Time Suggested Approach P D S A Time saved Which is typical of your organisation? A
“Insanity: doing the same thing over and over again and expecting different results”
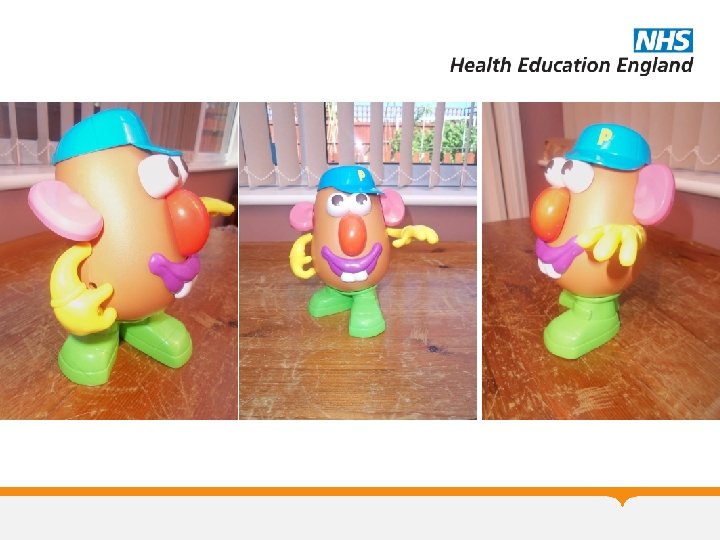
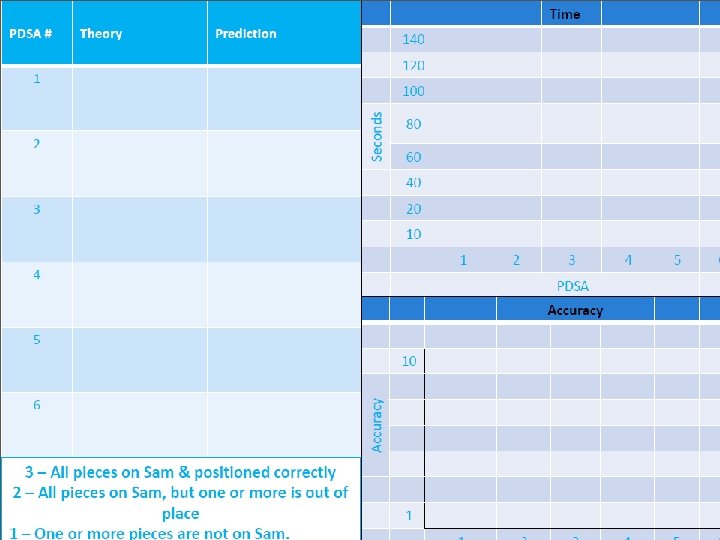
PDSA Measures • Accuracy – 10: All pieces on Sam and positioned correctly – 5: All pieces on Sam but one of more is out of place – 1: No Pieces on Sam • Time – Start: When time keeper says so – Stop: When colleague indicated last piece is in place AND removes hand
Measurement for Improvement “You can’t fatten a cow by weighing it” (Palestinian Proverb) • Improvement is not about measurement, but… • How do we know if a change is an improvement? • “if you can’t measure it, you can’t improve it”
Driver Diagrams • Used to plan improvement project activity • Provide a way of systematically laying out aspects of an improvement project • Three columns: – Aim/Outcome: What needs to be achieved – Primary Drivers: Set of factors that must be addressed to achieve the aim – Secondary Drivers: Specific areas where we plan changes.
Schematic view of a system on the left we depict outcome (aim) As we move right we drill down into the network of causes that drive the outcome, from ‘primary’ to ‘secondary’ drivers. Secondary Driver Primary Driver Secondary Driver Aim: An improved system Primary Driver Secondary Driver
On the right we depict ideas for system changes that might ultimately impact the outcome. Diagrams represents our theory about how to modify the system to change the outcome. Primary Driver Aim: An improved system Primary Driver Secondary Driver Projects Change Secondary Driver
Driver Diagram – Weight Loss Walk daily commute Energy Out Aim: 2 stones lighter! Stairs not lift Exercise Energy In Pedometer Gym work out 3 days Squash weekends Reduce alcohol intake No pub weekdays Eat Less Take packed lunch Low fat meals
Exercise: Driver Diagram • Using the template provided make a driver diagram for reducing fuel costs
Outcome Primary Drivers Reduce fuel price per gallon Decrease my Fuel Cost Reduce miles driven Increase efficiency (miles per gallon) Secondary Drivers • Shop at a cheaper petrol station • Take advantage of loyalty cards • Walk to work instead of driving • Utilise public transport • Use car pooling • • • Increase car efficiency (buy a more fuel efficient car) Improve driving pattern (improving driving habits) Avoid unnecessarily accelerating and decelerating
Process Mapping • Views the system from patient perspective, following their journey • Help staff understand the complexity of processes • Diagnostic and used as a basis for redesign, actively involving staff in the process
Process Map - Example Go to sleep Alarm goes off Is a thi w s da ork y? Ye s Get up! No Groan heavily
Process Mapping-2 Stages • Stage 1 Understand what actually happens to the Patient. Where it happens and who is involved. • Stage 2 Use the map to identify steps that could be changed.
Using the map • Look for bottle necks/constraints (Queues) • Any delays? (eg. Wait for clinician/consent/results/parking) • Repetition (eg. Patient identity check) • Unnecessary travel/movement in the department. (eg. Patient or notes) • Unnecessary steps? • Inefficient order of events?
Look at the whole process, not just the individual steps. Mind the gap !
Process Mapping • What are you trying to achieve? Describe your aim. For example-To reduce the time Patients spend waiting in out patients. • Who do you need at the meeting? • Do you need to walk the journey yourself? • Do you need to plot the timings/experiences of a series of cases?
Process Mapping-What do you need • • Your aim The right people (not just clinicians) Time Paper (flip chart/backing paper) Coloured pens Post its Facilitator
Process Mapping-What do you need • • Your aim The right people (not just clinicians) Time Paper (flip chart/backing paper) Coloured pens Post its Facilitator
Summary • Driver Diagram – understanding context of outcome • Process Mapping – understanding processes involved in achieving outcome • PDSA – Testing changes in that process and their impact on the context to ensure they are an improvement
Resources Available • QI Resource website http: //www. vle. eastmidlandsdeanery. nhs. uk/cour se/view. php? id=934 Links to resources, example projects, events
www. hee. em. nhs. uk
www. hee. em. nhs. uk
Health Education East Midlands Quality Improvement Forum 2016 SAVE THE DATE! Health Education England working across the East Midlands are pleased to announce that the next Quality Improvement Forum will take place on 29 th June 2016 @ the Kube, Leicester Racecourse in Oadby, Leicester. Key HEEMQIF 16 activities for your diary: • Call for Quality Improvement Projects Abstracts – 1 st February 2016 • Call for bookings & workshop bookings open – 1 st February 2016 • Abstract submissions close –March 2016 • Bookings close –May 2016 • HEEMQIF 16 – 29 th June 2016 Join in the conversation on Twitter using @HEE_EMids #HEEMQIF 16 #loveourlearners
A Final Thought from Don Berwick “The most important single change in the NHS in response to this report would be for it to become…. a system devoted to continual learning and improvement of patient care, top to bottom and end to end. ” Don Berwick. A promise to learn - a commitment to act. August 2013.