An introduction to Outcome Mapping AEA Friday 26


- Slides: 20
An introduction to Outcome Mapping AEA, Friday 26 October 2012 Simon Hearn, Overseas Development Institute s. hearn@odi. org. uk www. outcomemapping. ca
Acknowledgements This presentation makes use of various materials that were shared by members of the global OM community. Without being exhaustive, special thanks goes to Terry Smutylo, Steff Deprez, Jan Van Ongevalle, Robert Chipimbi, Daniel Roduner, Kaia Ambrose, Ricardo Wilson-Grau and many others.
Source: A guide for project M&E: IFAD
Social change can be… • Complex: • Unstable: involve a confluence of actors and factors independent of project duration • Non-linear: • Two-way: unexpected, emergent, discontinuous intervention may change • Beyond control: but subject to influence • Incremental, cumulative: watersheds & tipping points Source: Terry Smutylo
Conventional thinking clashes with relationships of cause and effect that are unknown IMPACT OUTCOMES OUTPUTS ACTIVITIES INPUTS Time Source: Ricardo Wilson-Grau (inspired by Jeff Conklin)
O Conventional thinking clashes with UT CO M E relationships of cause and effect OUTPUT ME O C T that are. Ounknown U OUTCOME OUTPUT OUTCOM E ACTIVITY ME OUTPUT ACTIVITY INPUTS ACTIVITY OUTPUT INPUTS OUTCOME OU TC OM E ACTIVITY INPUTS CO OUT INPUTS Time Source: Ricardo Wilson-Grau
Definition of OM • A participatory method for planning, monitoring and evaluation • Focused on changes in behaviour of those with whom the project or program works • Oriented towards social & organizational learning
“The only real voyage of discovery exists, not in seeing new landscapes, but in having new eyes” Marcel Proust
Three key concepts in OM: 1. Sphere of influence 2. Boundary Partners 3. Outcomes understood as changes in behaviour
There is a limit to our influence Project Sphere of control Partners Sphere of influence Beneficiaries Sphere of interest
There is a limit to our influence Inputs, activities, outputs Sphere of control Outcomes: Changes in behavior Sphere of influence Impact: Changes in state Sphere of interest
Who are your boundary partners? Programme Beneficiaries Stakeholders Boundary Partners
Focus of Outcome Mapping Progr am in fluenc e dec rease s s ity n u m Com Inputs hip s r e own Activities ase e r c in Outputs Outcome Mapping Impacts
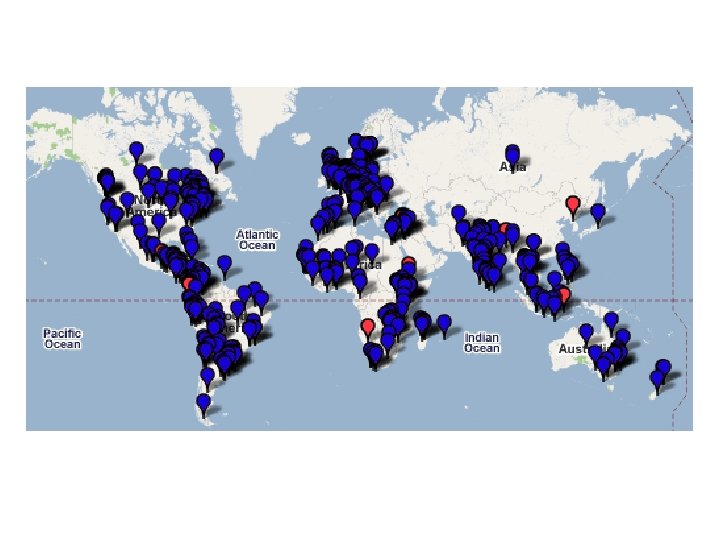
OM use by region Sub-Saharan Africa 30 Latin America & Caribbean 28 18 Multi-regional Asia Pacific 16 South Asia 9 Europe 8 Middle East & North Africa US & Canada 123 cases identified 6 3 Source: Richard Smth, John Mauremootoo and Kornelia Rassmann, 2012
OM use by sector Governance Agriculture and forestry Health Education Emergency relief Multi-sectoral Water and sanitation Environmental Social work Research ICT 4 D Climate change Finance Child care Other 24 20 12 11 8 8 5 4 123 cases identified 3 3 2 2 8 Source: Richard Smth, John Mauremootoo and Kornelia Rassmann, 2012
Uses of OM Planning 83 68 Monitoring Evaluation 56 PM&E 55 123 cases identified Source: Richard Smth, John Mauremootoo and Kornelia Rassmann, 2012
Thank you! For more info on OM: • Visit the OM learning community: www. outcomemapping. ca • Contact: Simon Hearn s. hearn@odi. org. uk