
An Introduction to Optimal Estimation Theory Chris ODell
- Slides: 34
An Introduction to Optimal Estimation Theory Chris O´Dell AT 652 Fall 2013
The Bible of Optimal Estimation: Rodgers, 2000
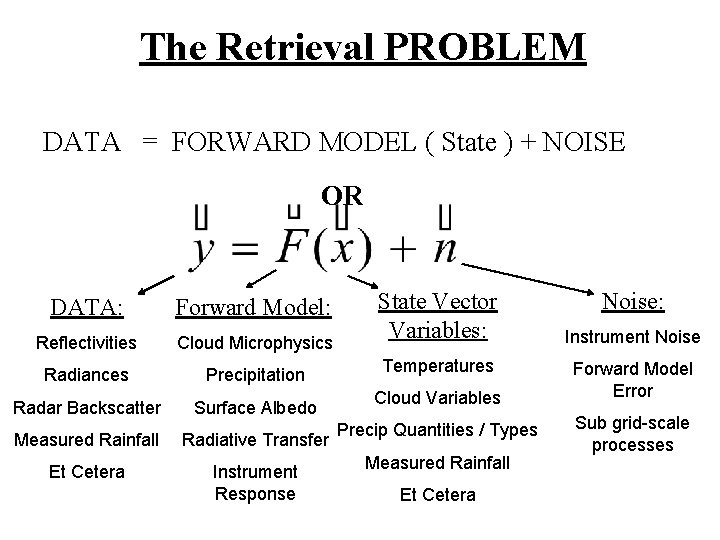
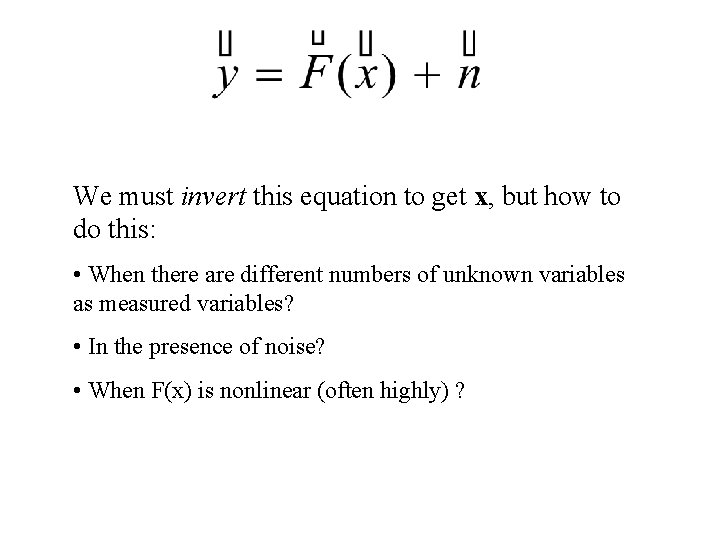
The Retrieval PROBLEM DATA = FORWARD MODEL ( State ) + NOISE OR DATA: Forward Model: Reflectivities Cloud Microphysics Radiances Precipitation Radar Backscatter Surface Albedo Measured Rainfall Radiative Transfer Et Cetera Instrument Response State Vector Variables: Temperatures Cloud Variables Precip Quantities / Types Measured Rainfall Et Cetera Noise: Instrument Noise Forward Model Error Sub grid-scale processes
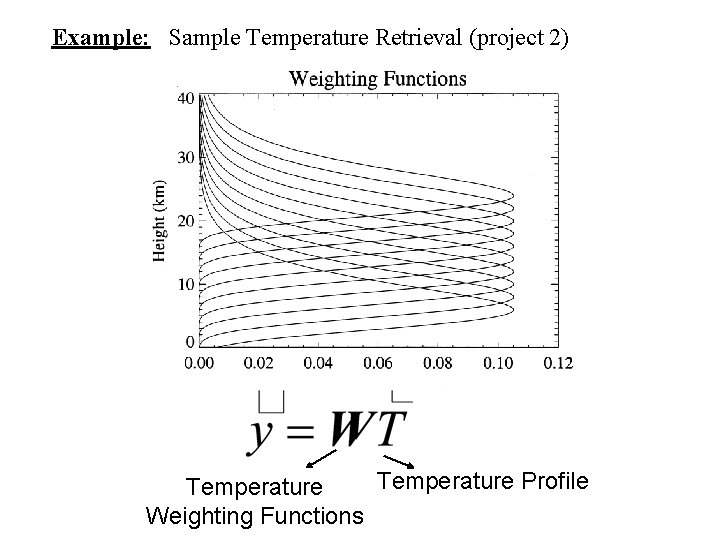
Example: Sample Temperature Retrieval (project 2) Temperature Profile Temperature Weighting Functions
We must invert this equation to get x, but how to do this: • When there are different numbers of unknown variables as measured variables? • In the presence of noise? • When F(x) is nonlinear (often highly) ?
Retrieval Solution Techniques • Direct Solution (requires invertible forward model and same number of measured quantities as unknowns) • Multiple Linear Regression • Semi-Empirical Fitting • Neural Networks • Optimal Estimation Theory
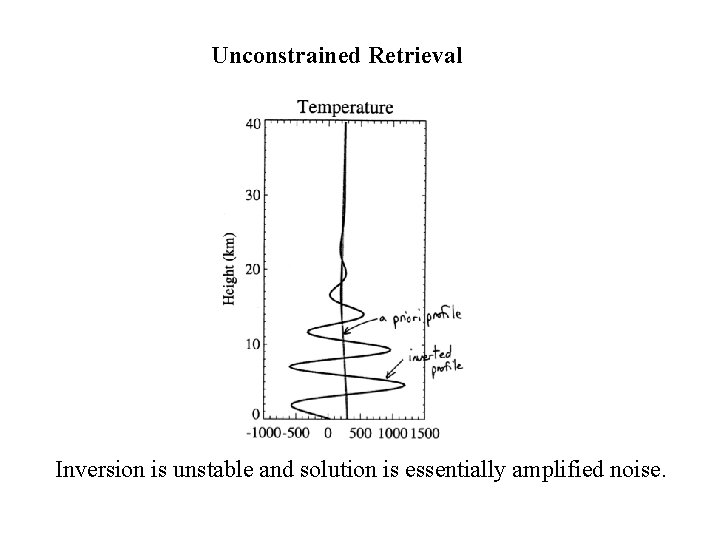
Unconstrained Retrieval Inversion is unstable and solution is essentially amplified noise.
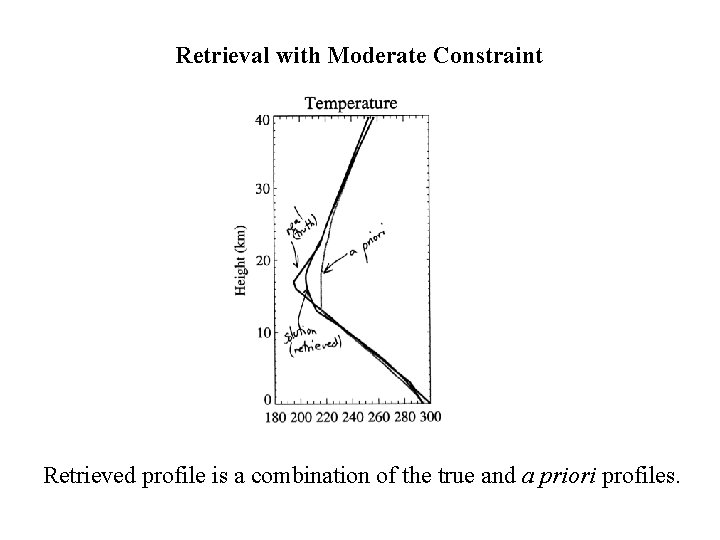
Retrieval with Moderate Constraint Retrieved profile is a combination of the true and a priori profiles.
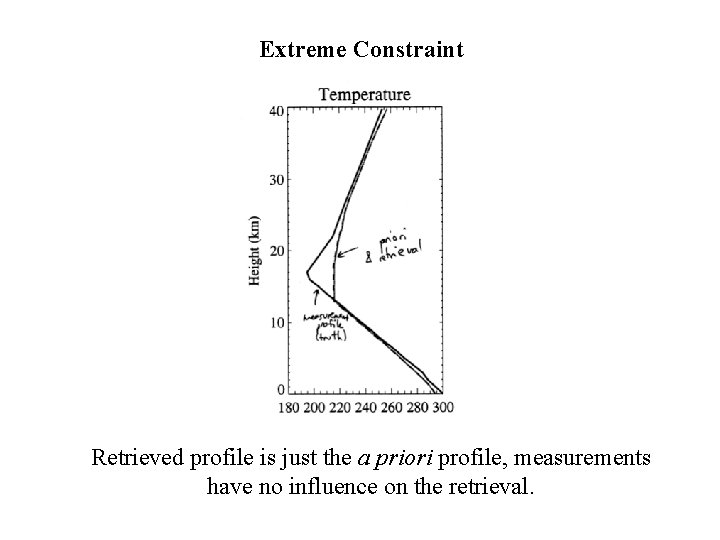
Extreme Constraint Retrieved profile is just the a priori profile, measurements have no influence on the retrieval.
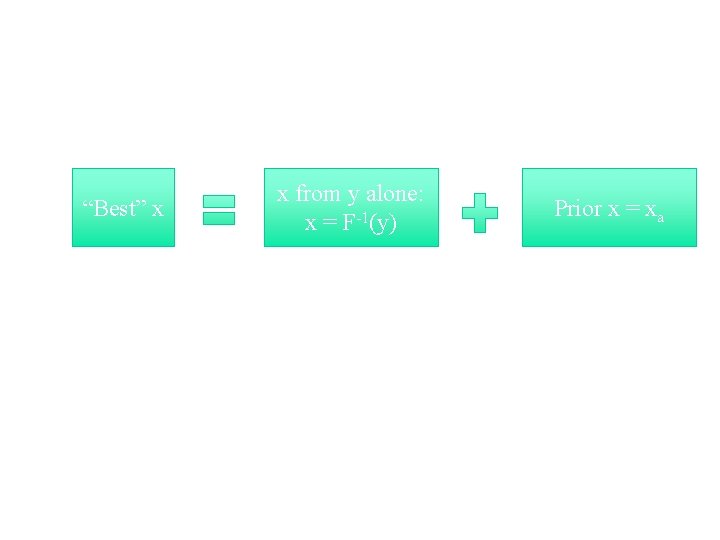
“Best” x x from y alone: x = F-1(y) Prior x = xa
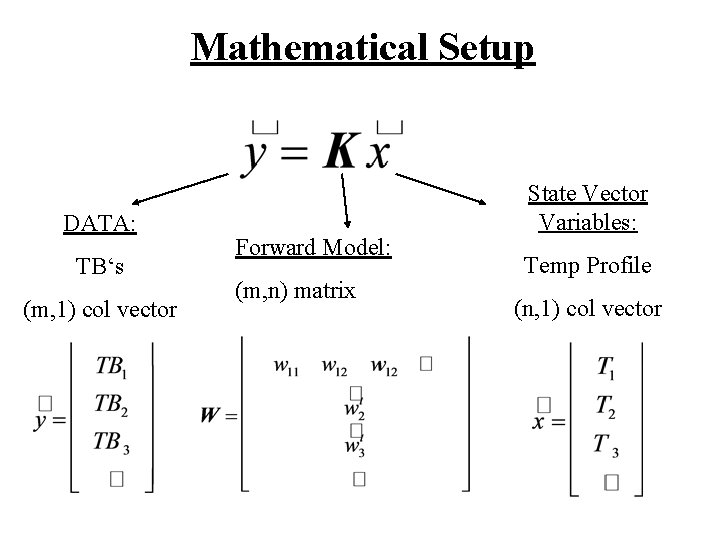
Mathematical Setup DATA: TB‘s (m, 1) col vector Forward Model: (m, n) matrix State Vector Variables: Temp Profile (n, 1) col vector
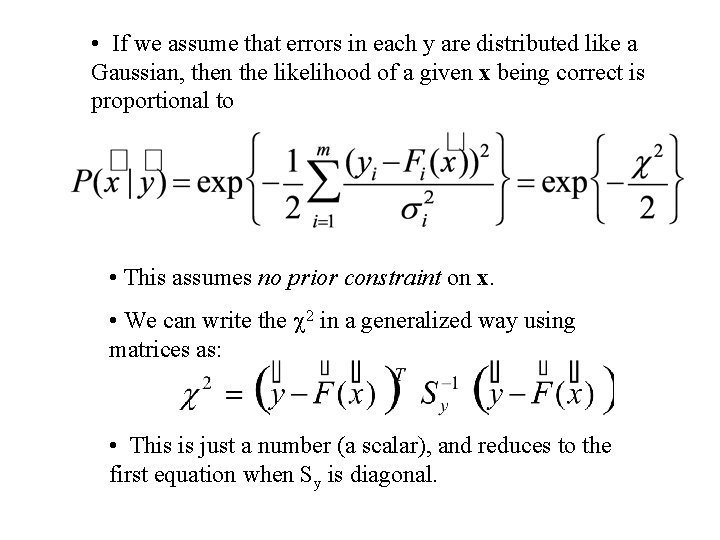
• If we assume that errors in each y are distributed like a Gaussian, then the likelihood of a given x being correct is proportional to • This assumes no prior constraint on x. • We can write the 2 in a generalized way using matrices as: • This is just a number (a scalar), and reduces to the first equation when Sy is diagonal.
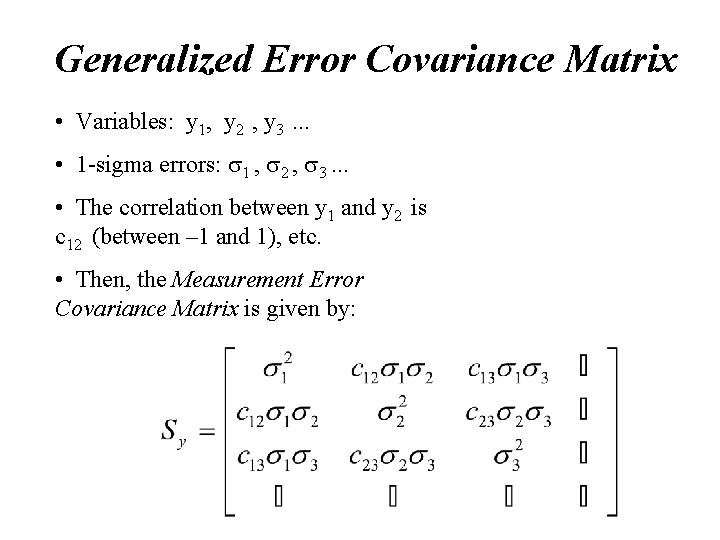
Generalized Error Covariance Matrix • Variables: y 1, y 2 , y 3. . . • 1 -sigma errors: 1 , 2 , 3. . . • The correlation between y 1 and y 2 is c 12 (between – 1 and 1), etc. • Then, the Measurement Error Covariance Matrix is given by:
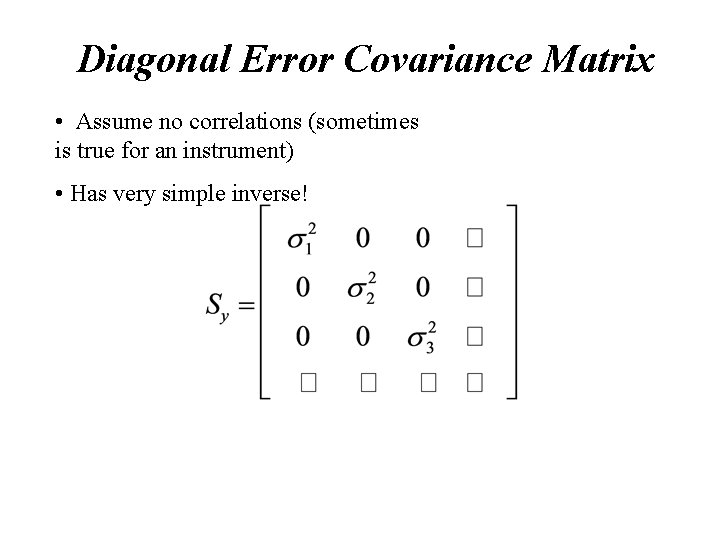
Diagonal Error Covariance Matrix • Assume no correlations (sometimes is true for an instrument) • Has very simple inverse!
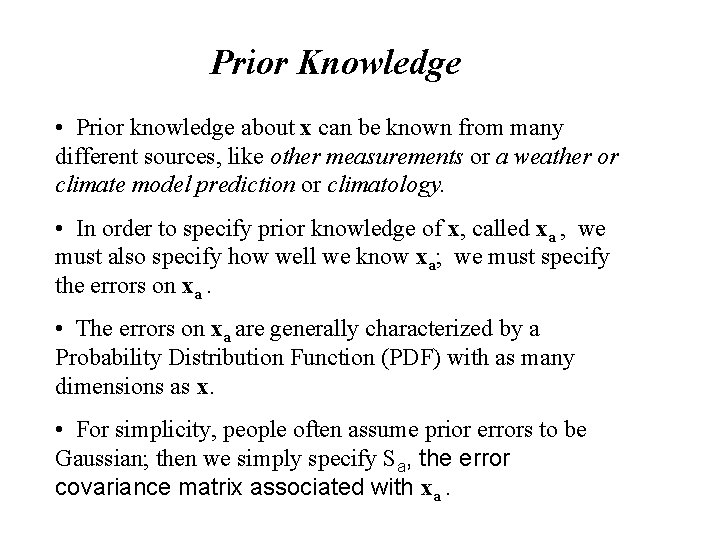
Prior Knowledge • Prior knowledge about x can be known from many different sources, like other measurements or a weather or climate model prediction or climatology. • In order to specify prior knowledge of x, called xa , we must also specify how well we know xa; we must specify the errors on xa. • The errors on xa are generally characterized by a Probability Distribution Function (PDF) with as many dimensions as x. • For simplicity, people often assume prior errors to be Gaussian; then we simply specify Sa, the error covariance matrix associated with xa.
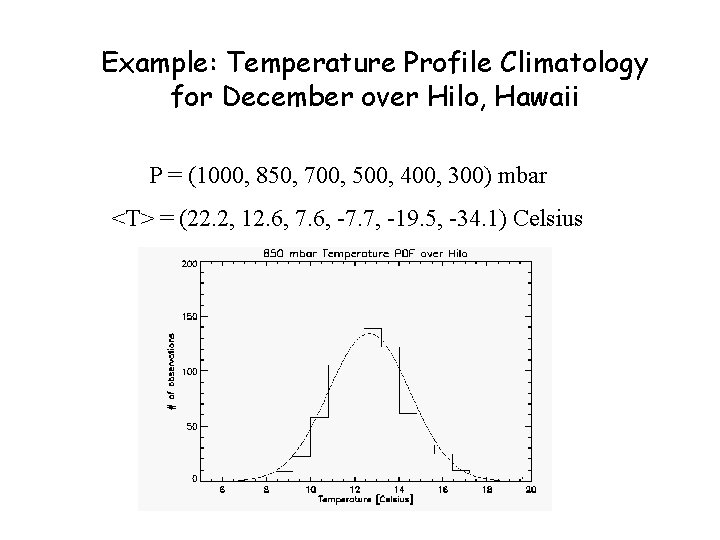
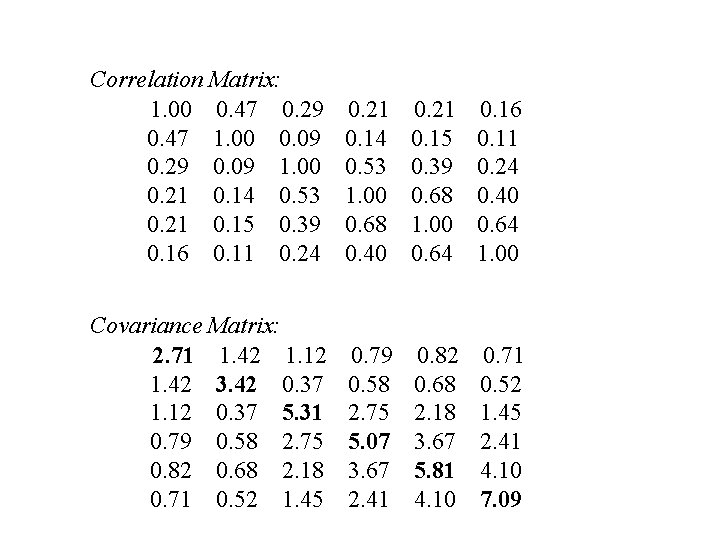
Example: Temperature Profile Climatology for December over Hilo, Hawaii P = (1000, 850, 700, 500, 400, 300) mbar <T> = (22. 2, 12. 6, 7. 6, -7. 7, -19. 5, -34. 1) Celsius
Correlation Matrix: 1. 00 0. 47 0. 29 0. 47 1. 00 0. 09 0. 29 0. 09 1. 00 0. 21 0. 14 0. 53 0. 21 0. 15 0. 39 0. 16 0. 11 0. 24 0. 21 0. 14 0. 53 1. 00 0. 68 0. 40 0. 21 0. 15 0. 39 0. 68 1. 00 0. 64 0. 16 0. 11 0. 24 0. 40 0. 64 1. 00 Covariance Matrix: 2. 71 1. 42 1. 12 1. 42 3. 42 0. 37 1. 12 0. 37 5. 31 0. 79 0. 58 2. 75 0. 82 0. 68 2. 18 0. 71 0. 52 1. 45 0. 79 0. 58 2. 75 5. 07 3. 67 2. 41 0. 82 0. 68 2. 18 3. 67 5. 81 4. 10 0. 71 0. 52 1. 45 2. 41 4. 10 7. 09
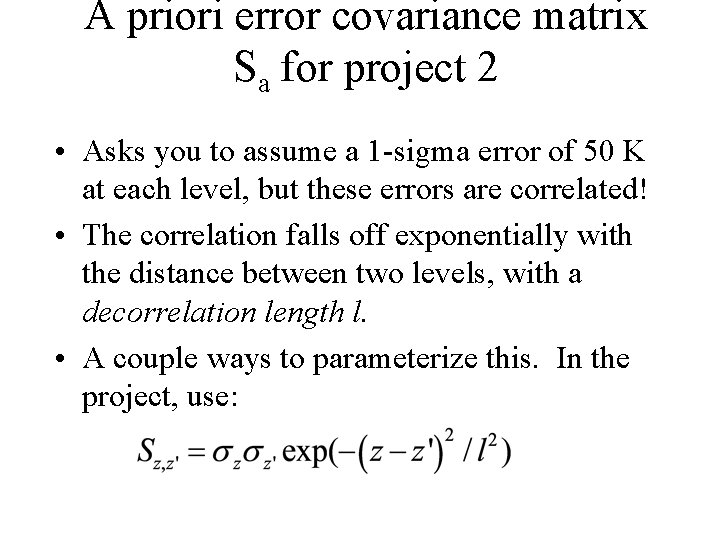
A priori error covariance matrix Sa for project 2 • Asks you to assume a 1 -sigma error of 50 K at each level, but these errors are correlated! • The correlation falls off exponentially with the distance between two levels, with a decorrelation length l. • A couple ways to parameterize this. In the project, use:
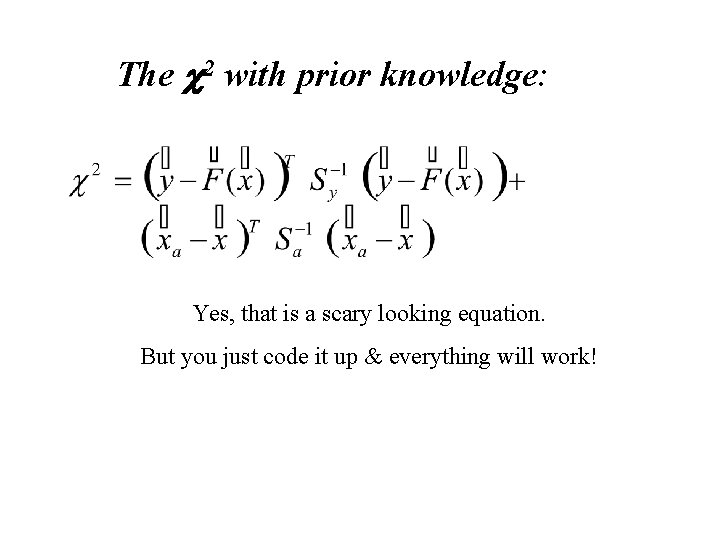
The 2 with prior knowledge: Yes, that is a scary looking equation. But you just code it up & everything will work!
Minimizing the 2 • Minimizing the 2 is hard. In general, you can use a look-up table (if you have tabulated values of F(x) ), but if the lookup table approach is not feasible (i. e. , it’s too big), then: • If the problem is linear (like Project 2), then there is an analytic solution for the x the minimized 2, which we will call • If the problem is nonlinear, a minimization technique must be used such as Gauss-Newton iteration, Steepest. Descent, etc.
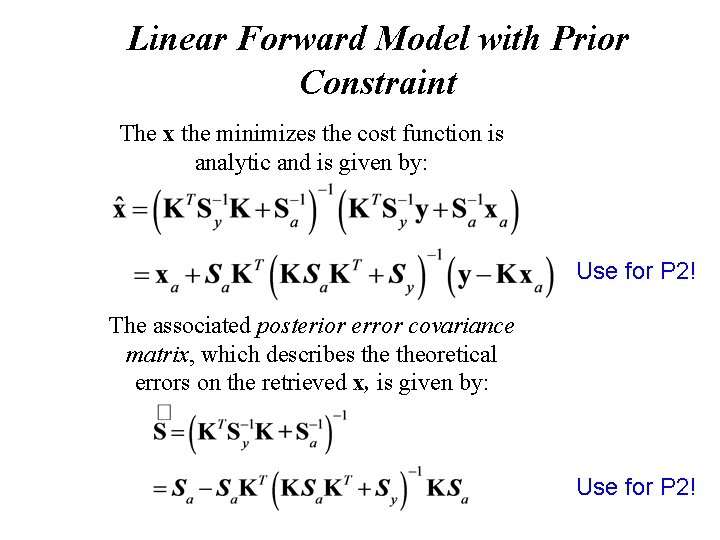
Linear Forward Model with Prior Constraint The x the minimizes the cost function is analytic and is given by: Use for P 2! The associated posterior error covariance matrix, which describes theoretical errors on the retrieved x, is given by: Use for P 2!
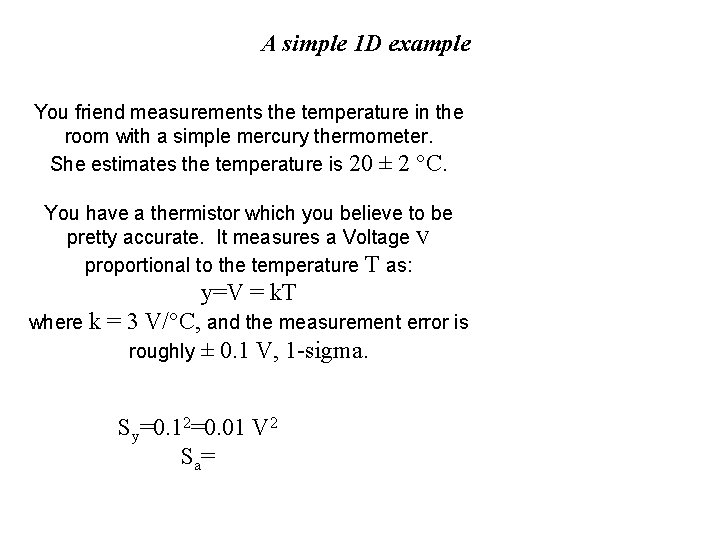
A simple 1 D example You friend measurements the temperature in the room with a simple mercury thermometer. She estimates the temperature is 20 ± 2 °C. You have a thermistor which you believe to be pretty accurate. It measures a Voltage V proportional to the temperature T as: y=V = k. T where k = 3 V/°C, and the measurement error is roughly ± 0. 1 V, 1 -sigma. Sy=0. 12=0. 01 V 2 Sa =
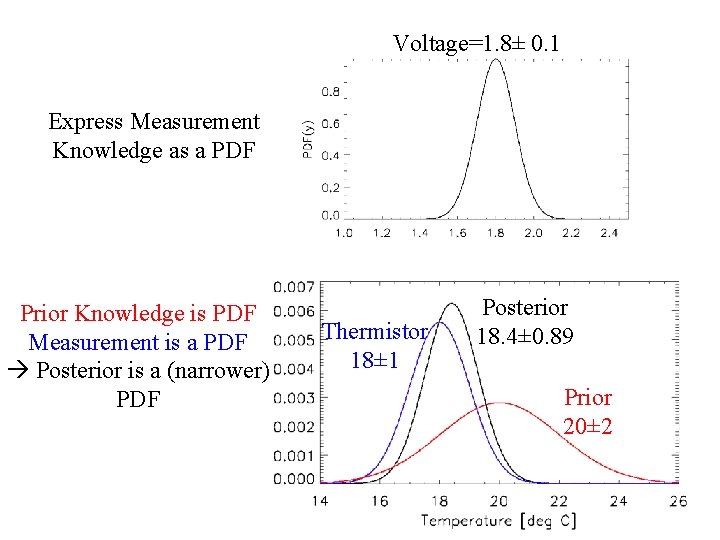
Voltage=1. 8± 0. 1 Express Measurement Knowledge as a PDF Prior Knowledge is PDF Measurement is a PDF Posterior is a (narrower) PDF Thermistor 18± 1 Posterior 18. 4± 0. 89 Prior 20± 2
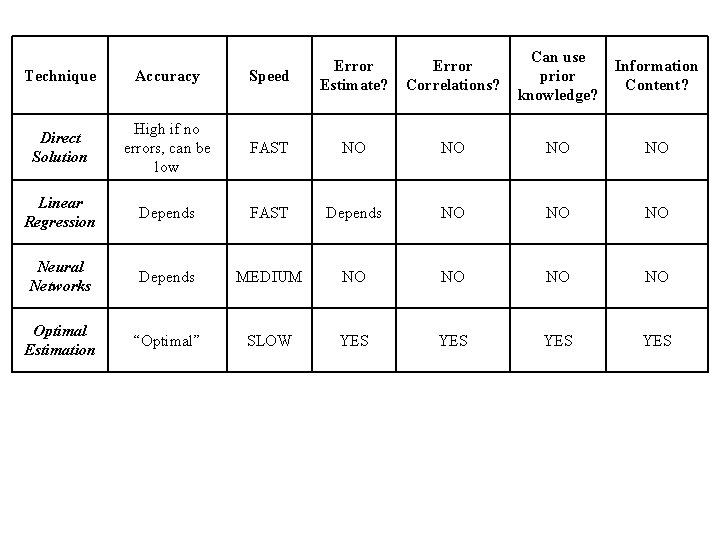
Error Correlations? Can use prior knowledge? Information Content? Technique Accuracy Speed Error Estimate? Direct Solution High if no errors, can be low FAST NO NO Linear Regression Depends FAST Depends NO NO NO Neural Networks Depends MEDIUM NO NO Optimal Estimation “Optimal” SLOW YES YES
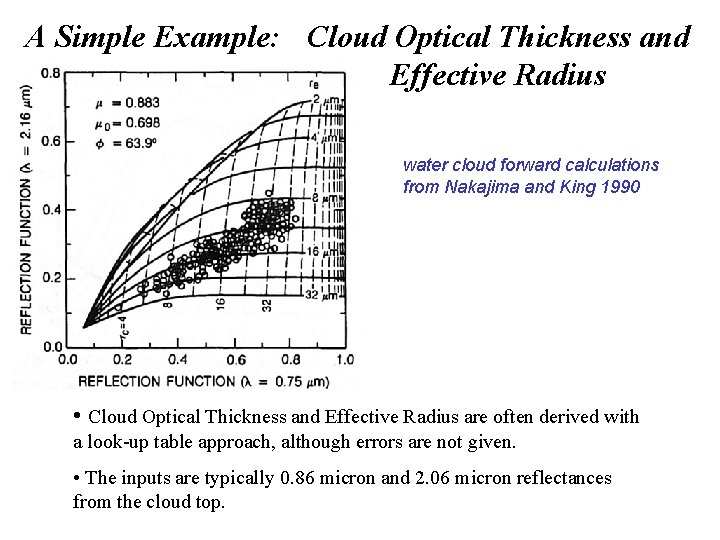
A Simple Example: Cloud Optical Thickness and Effective Radius water cloud forward calculations from Nakajima and King 1990 • Cloud Optical Thickness and Effective Radius are often derived with a look-up table approach, although errors are not given. • The inputs are typically 0. 86 micron and 2. 06 micron reflectances from the cloud top.
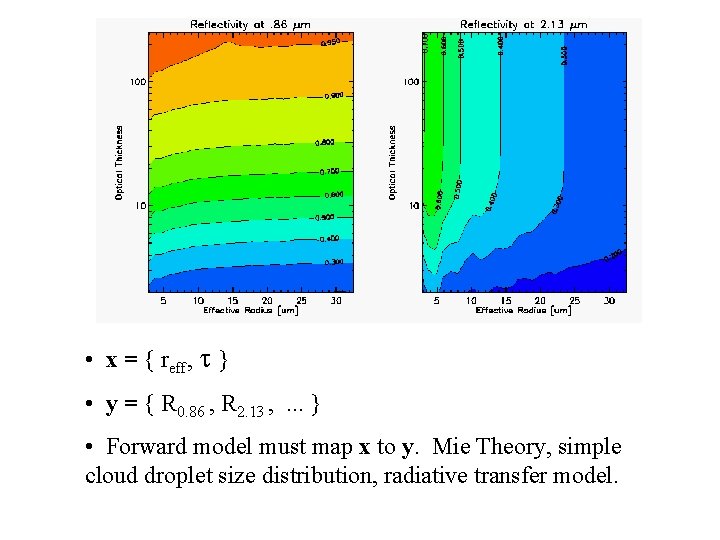
• x = { reff, } • y = { R 0. 86 , R 2. 13 , . . . } • Forward model must map x to y. Mie Theory, simple cloud droplet size distribution, radiative transfer model.
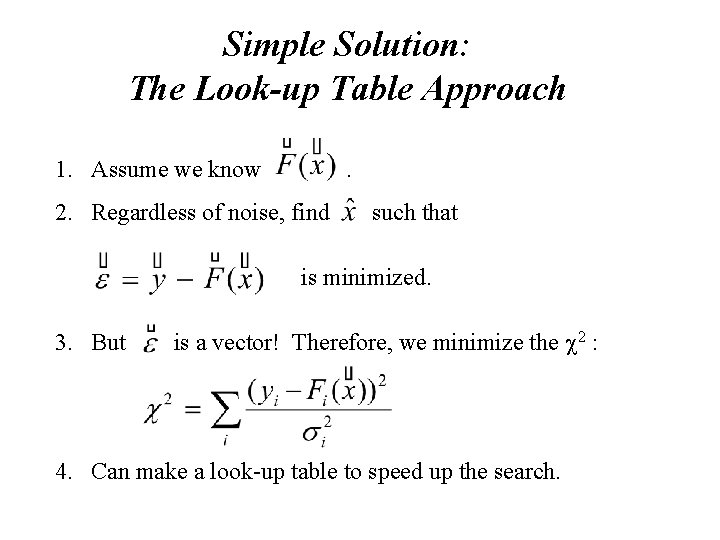
Simple Solution: The Look-up Table Approach 1. Assume we know . 2. Regardless of noise, find such that is minimized. 3. But is a vector! Therefore, we minimize the 2 : 4. Can make a look-up table to speed up the search.
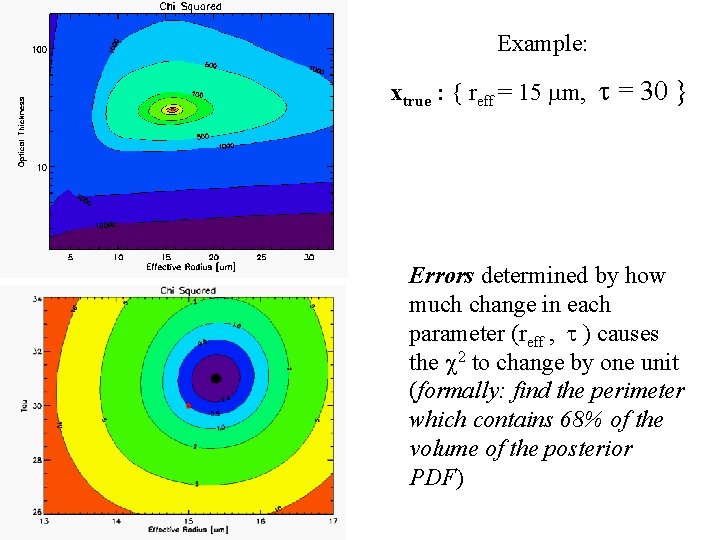
Example: xtrue : { reff = 15 m, = 30 } Errors determined by how much change in each parameter (reff , ) causes the 2 to change by one unit (formally: find the perimeter which contains 68% of the volume of the posterior PDF)
BUT • What if the Look-Up Table is too big? • What if the errors in y are correlated? • How do we account for errors in the forward model? • Shouldn’t the output errors be correlated as well? • How do we incorporate prior knowledge about x ?
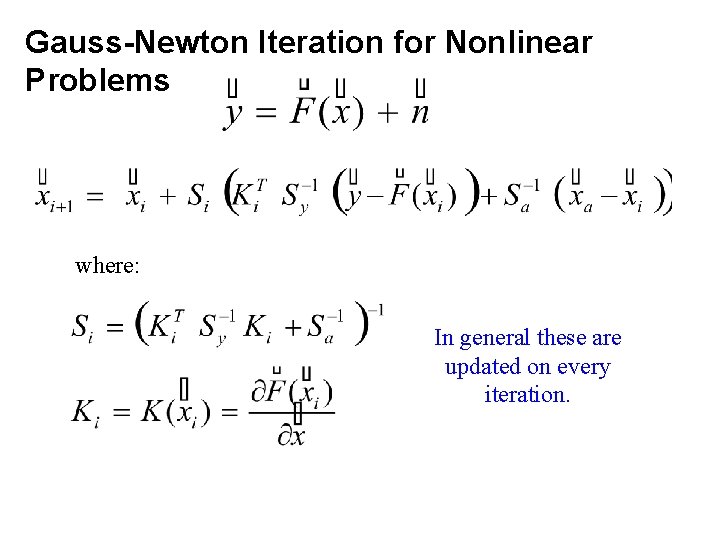
Gauss-Newton Iteration for Nonlinear Problems where: In general these are updated on every iteration.
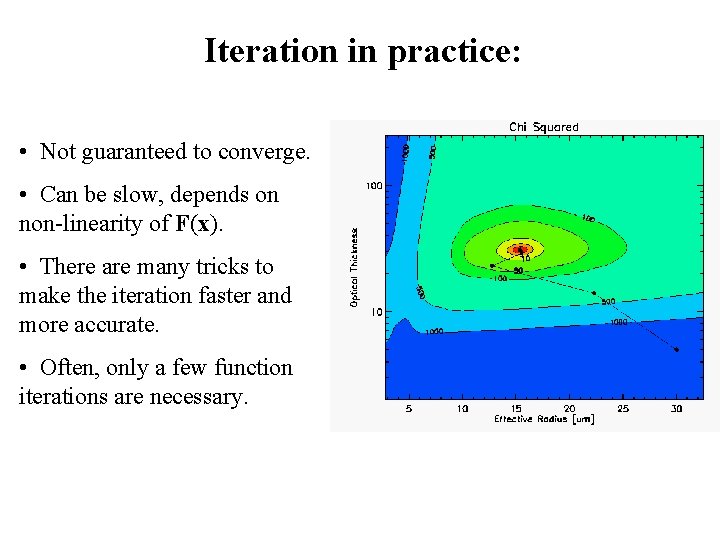
Iteration in practice: • Not guaranteed to converge. • Can be slow, depends on non-linearity of F(x). • There are many tricks to make the iteration faster and more accurate. • Often, only a few function iterations are necessary.
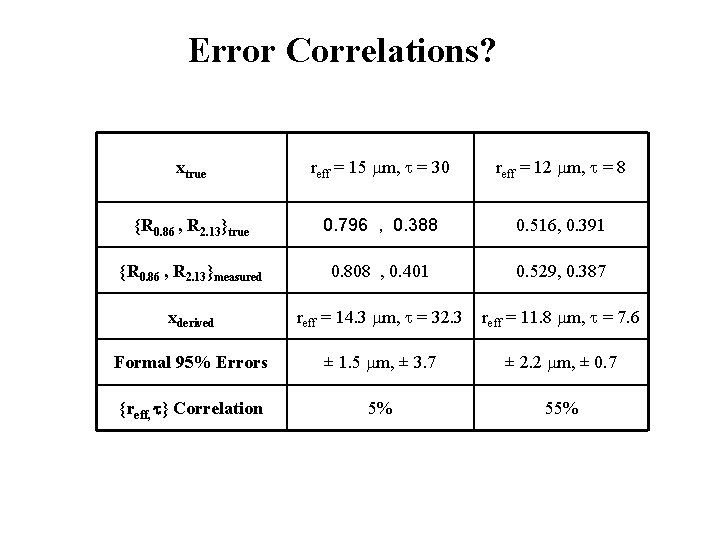
Error Correlations? xtrue reff = 15 m, = 30 reff = 12 m, = 8 {R 0. 86 , R 2. 13}true 0. 796 , 0. 388 0. 516, 0. 391 {R 0. 86 , R 2. 13}measured 0. 808 , 0. 401 0. 529, 0. 387 xderived reff = 14. 3 m, = 32. 3 reff = 11. 8 m, = 7. 6 Formal 95% Errors ± 1. 5 m, ± 3. 7 ± 2. 2 m, ± 0. 7 {reff, } Correlation 5% 55%
So, again, what is optimal estimation? Optimal Estimation is a way to infer information about a system, based on observations. It is necessary to be able to simulate the observations, given complete knowledge of the system state. Optimal Estimation can: • Combine different observations of different types. • Utilize prior knowledge of the system state (climatology, model forecast, etc). • Errors are automatically provided, as are error correlations. • Estimate the information content of additional measurements.
Applications of Optimal Estimation • Retrieval Theory (standard, or using climatology, or using model forecast. Combine radar & satellite. Combine multiple satellites. Etc. ) • Data Assimilation – optimally combine model forecast with measurements. Not just for weather! Example: carbon source sink models, hydrology models. • Channel Selection: can determine information content of additional channels when retrieving certain variables. Example: SIRICE mission is using this technique to select their IR channels to retrieve cirrus IWP.