An Introduction to Native Postmortem Debugging I think
An Introduction to Native Postmortem Debugging “I think it’s dead, Jim” Dr. L Mc. Coy, Star date 3196 “Hex codes never lie” Mark Bartosik, 2003 AD This talk contains x 86 and OS and compiler specific details. Helps if you know a little assembler (understand “push EAX”) ACCU Conference 2003, © Mark Bartosik, www. bugbrowser. com 1
Motivation ? • Software phases – Requirement – Design – Code – Test – Debug – Support & maintenance ACCU Conference 2003, © Mark Bartosik, www. bugbrowser. com 2
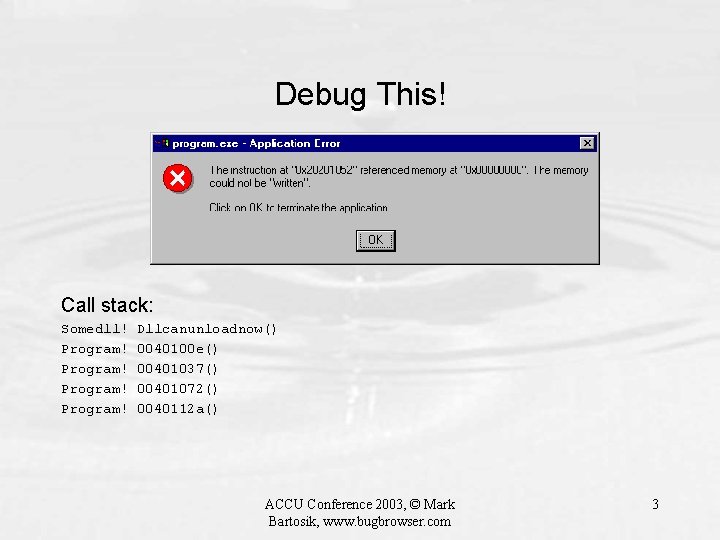
Debug This! Call stack: Somedll! Program! Dllcanunloadnow() 0040100 e() 00401037() 00401072() 0040112 a() ACCU Conference 2003, © Mark Bartosik, www. bugbrowser. com 3
Importance of a Stack Trace Information on the stack: • History of which functions executed what the program / thread was doing before it crashed • Contents of automatic variables ACCU Conference 2003, © Mark Bartosik, www. bugbrowser. com 4
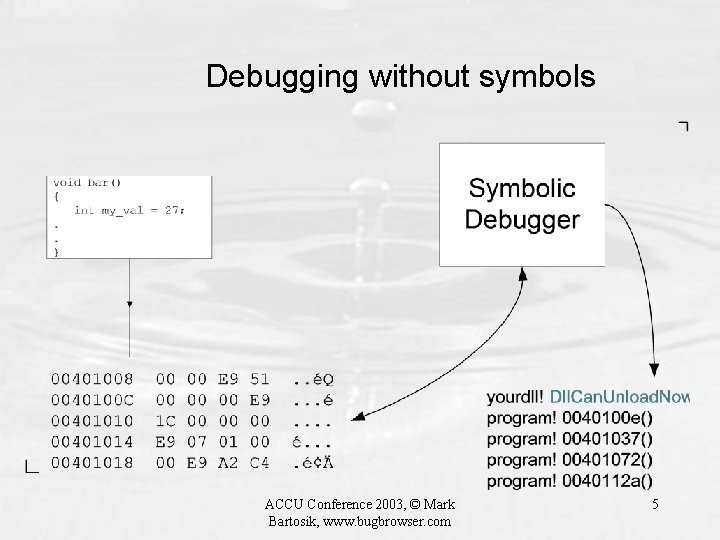
Debugging without symbols ACCU Conference 2003, © Mark Bartosik, www. bugbrowser. com 5
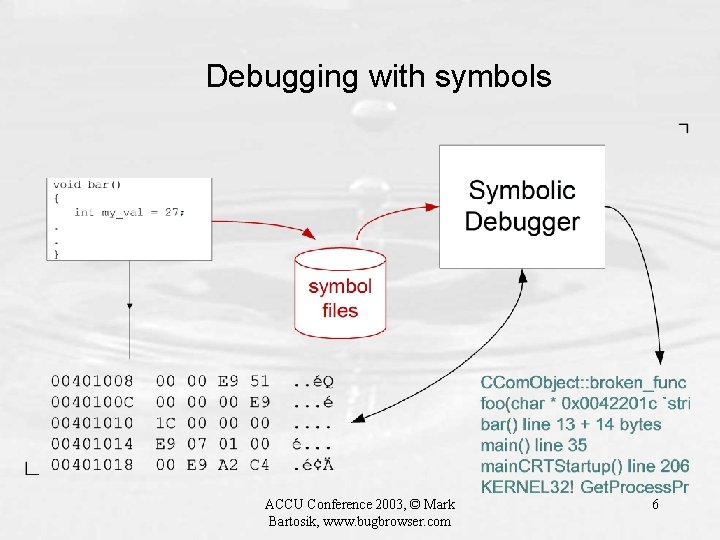
Debugging with symbols ACCU Conference 2003, © Mark Bartosik, www. bugbrowser. com 6
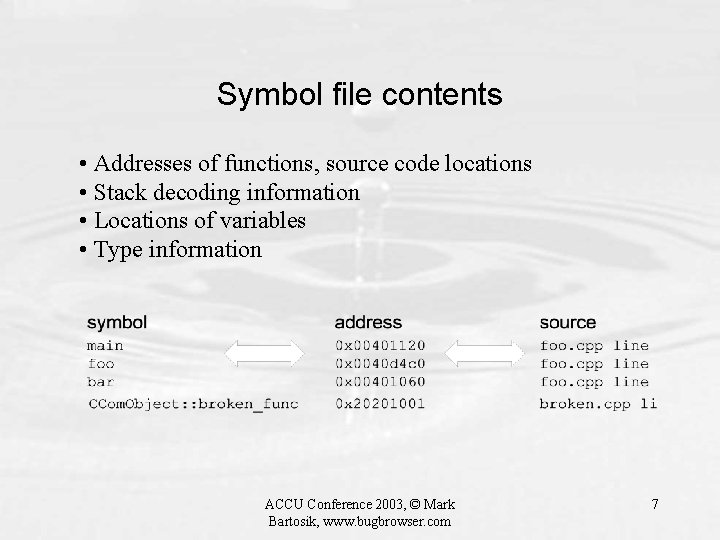
Symbol file contents • Addresses of functions, source code locations • Stack decoding information • Locations of variables • Type information ACCU Conference 2003, © Mark Bartosik, www. bugbrowser. com 7
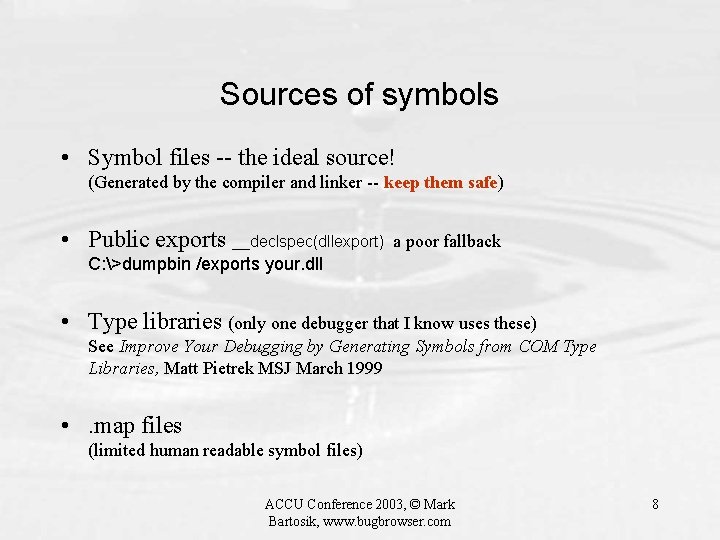
Sources of symbols • Symbol files -- the ideal source! (Generated by the compiler and linker -- keep them safe) • Public exports __declspec(dllexport) a poor fallback C: >dumpbin /exports your. dll • Type libraries (only one debugger that I know uses these) See Improve Your Debugging by Generating Symbols from COM Type Libraries, Matt Pietrek MSJ March 1999 • . map files (limited human readable symbol files) ACCU Conference 2003, © Mark Bartosik, www. bugbrowser. com 8
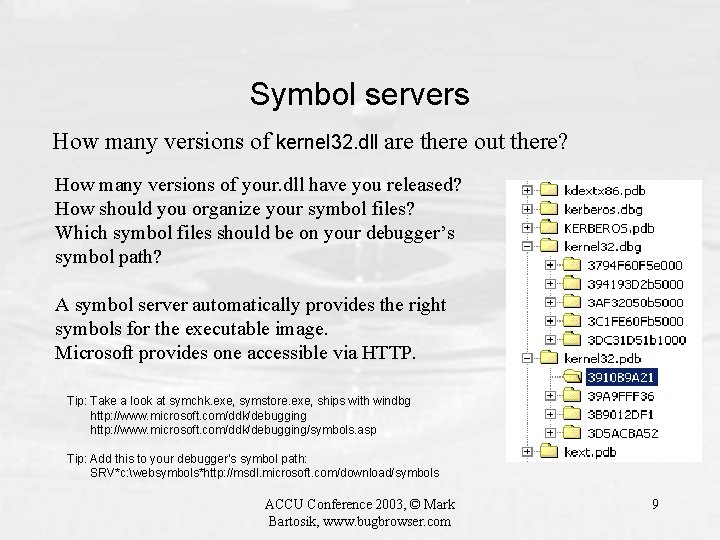
Symbol servers How many versions of kernel 32. dll are there out there? How many versions of your. dll have you released? How should you organize your symbol files? Which symbol files should be on your debugger’s symbol path? A symbol server automatically provides the right symbols for the executable image. Microsoft provides one accessible via HTTP. Tip: Take a look at symchk. exe, symstore. exe, ships with windbg http: //www. microsoft. com/ddk/debugging/symbols. asp Tip: Add this to your debugger’s symbol path: SRV*c: websymbols*http: //msdl. microsoft. com/download/symbols ACCU Conference 2003, © Mark Bartosik, www. bugbrowser. com 9
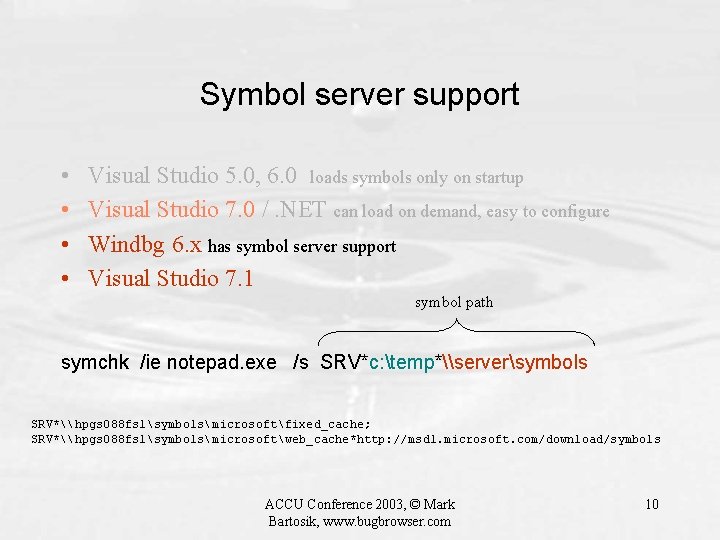
Symbol server support • • Visual Studio 5. 0, 6. 0 loads symbols only on startup Visual Studio 7. 0 /. NET can load on demand, easy to configure Windbg 6. x has symbol server support Visual Studio 7. 1 symbol path symchk /ie notepad. exe /s SRV*c: temp*\serversymbols SRV*\hpgs 088 fs 1symbolsmicrosoftfixed_cache; SRV*\hpgs 088 fs 1symbolsmicrosoftweb_cache*http: //msdl. microsoft. com/download/symbols ACCU Conference 2003, © Mark Bartosik, www. bugbrowser. com 10
User / mini dump files aka “core files” A photograph of a process or part of a process Microsoft: see MSDN Mini. Dump. Write. Dump, and/or userdump, mscordmp cygwin: see dumper, and error_start environment variable • • Stacks + data sections (global variables) All accessible memory Operating system handles Can be loaded into a debugger, but you need the module files Can be save by a debugger for later use ACCU Conference 2003, © Mark Bartosik, www. bugbrowser. com 11
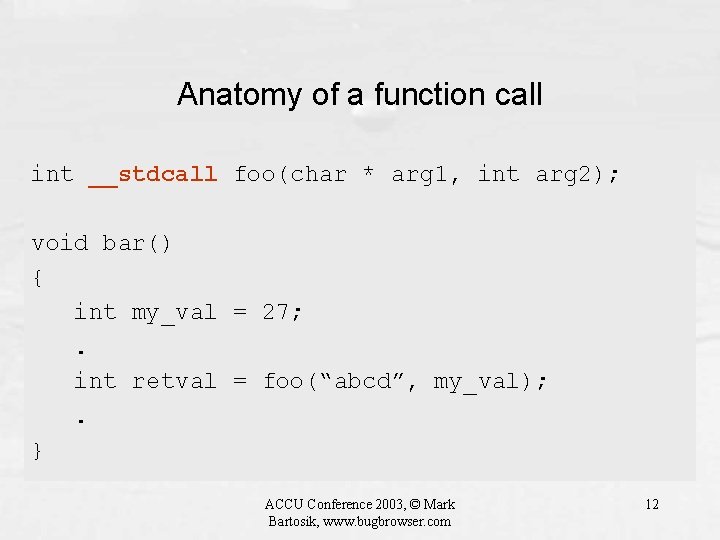
Anatomy of a function call int foo(char __stdcall*foo(char arg 1, int * arg 2); arg 1, int arg 2); void bar() { int my_val = 27; . int retval = foo(“abcd”, my_val); . } ACCU Conference 2003, © Mark Bartosik, www. bugbrowser. com 12
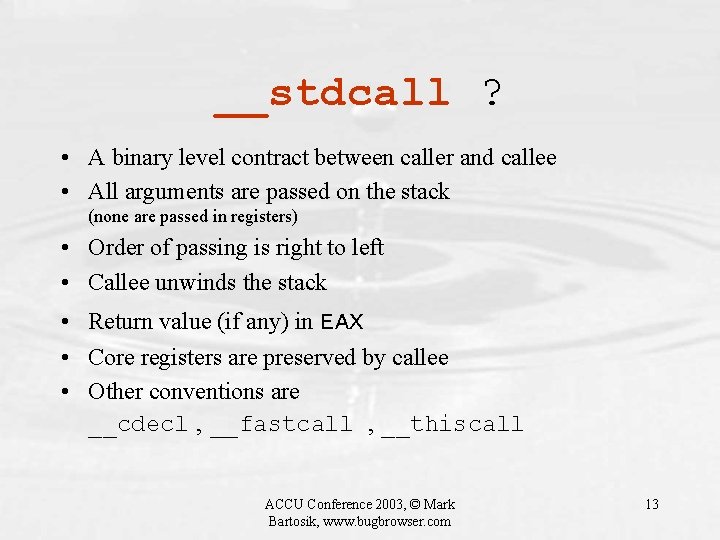
__stdcall ? • A binary level contract between caller and callee • All arguments are passed on the stack (none are passed in registers) • Order of passing is right to left • Callee unwinds the stack • Return value (if any) in EAX • Core registers are preserved by callee • Other conventions are __cdecl , __fastcall , __thiscall ACCU Conference 2003, © Mark Bartosik, www. bugbrowser. com 13
![retval = foo(“abcd”, my_val); compiler’s view mov push call mov eax, DWORD PTR _my_val$[ebp] retval = foo(“abcd”, my_val); compiler’s view mov push call mov eax, DWORD PTR _my_val$[ebp]](http://slidetodoc.com/presentation_image/da41224b6bed5e5b1a1072ac8eadd662/image-14.jpg)
retval = foo(“abcd”, my_val); compiler’s view mov push call mov eax, DWORD PTR _my_val$[ebp] eax OFFSET FLAT: $SG 171 ? foo@@YGHPADAAH@Z DWORD PTR _retval$[ebp], eax ; foo c: tmp>Cl /Fas /Od foo. cpp output in foo. asm ACCU Conference 2003, © Mark Bartosik, www. bugbrowser. com 14
![retval = foo(“abcd”, my_val); debugger’s view mov push call mov eax, [ebp-4] eax offset retval = foo(“abcd”, my_val); debugger’s view mov push call mov eax, [ebp-4] eax offset](http://slidetodoc.com/presentation_image/da41224b6bed5e5b1a1072ac8eadd662/image-15.jpg)
retval = foo(“abcd”, my_val); debugger’s view mov push call mov eax, [ebp-4] eax offset string “abcd” foo DWORD PTR [ebp-8], eax // store value of my_val in eax // push arg 2 onto stack // push arg 1 onto stack // transfer control to foo // save return value in an automatic Stop on a break point Show disassembler ACCU Conference 2003, © Mark Bartosik, www. bugbrowser. com 15
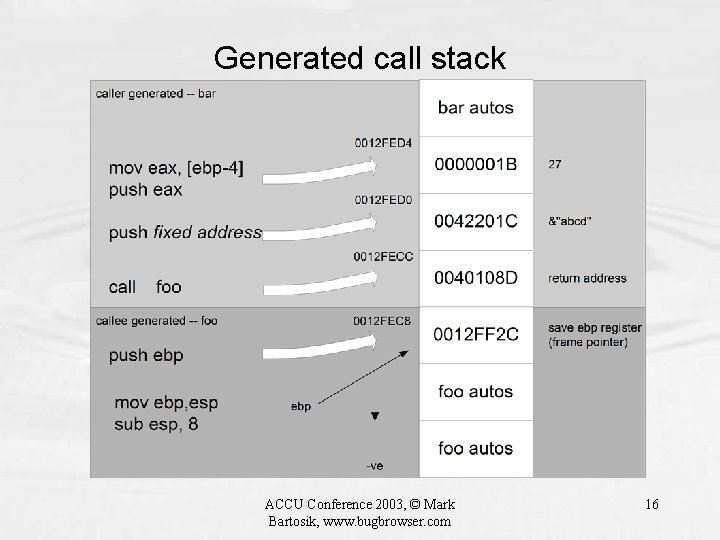
Generated call stack ACCU Conference 2003, © Mark Bartosik, www. bugbrowser. com 16
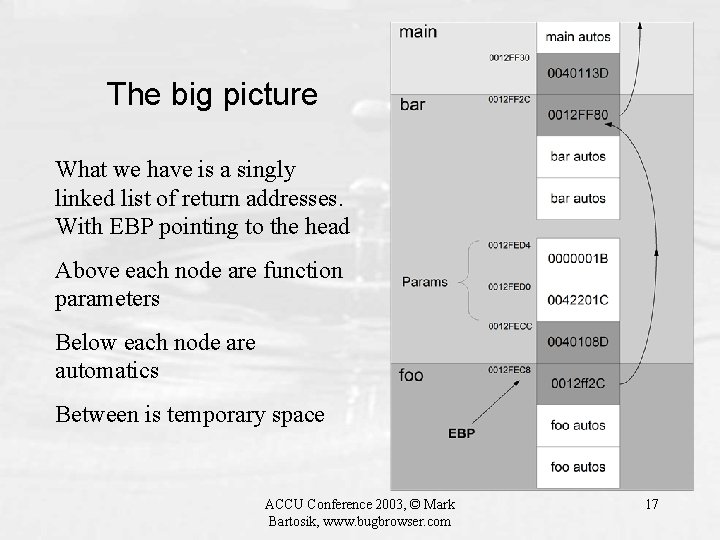
The big picture What we have is a singly linked list of return addresses. With EBP pointing to the head Above each node are function parameters Below each node are automatics Between is temporary space ACCU Conference 2003, © Mark Bartosik, www. bugbrowser. com 17
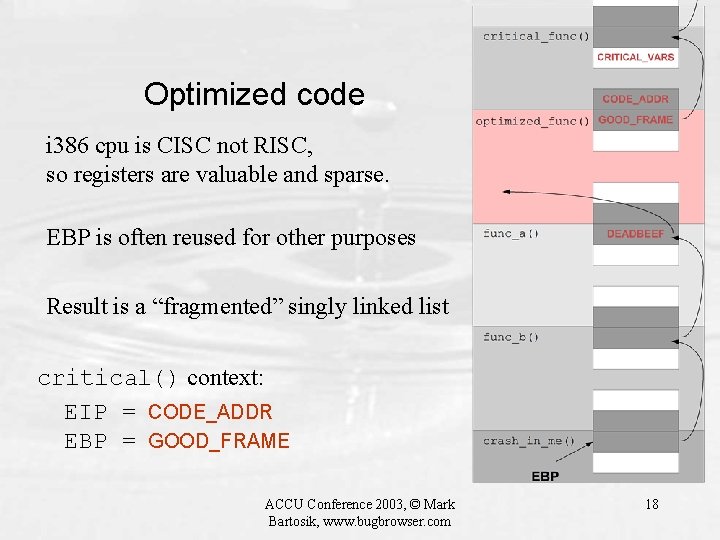
Optimized code i 386 cpu is CISC not RISC, so registers are valuable and sparse. EBP is often reused for other purposes Result is a “fragmented” singly linked list critical() context: EIP = CODE_ADDR EBP = GOOD_FRAME ACCU Conference 2003, © Mark Bartosik, www. bugbrowser. com 18
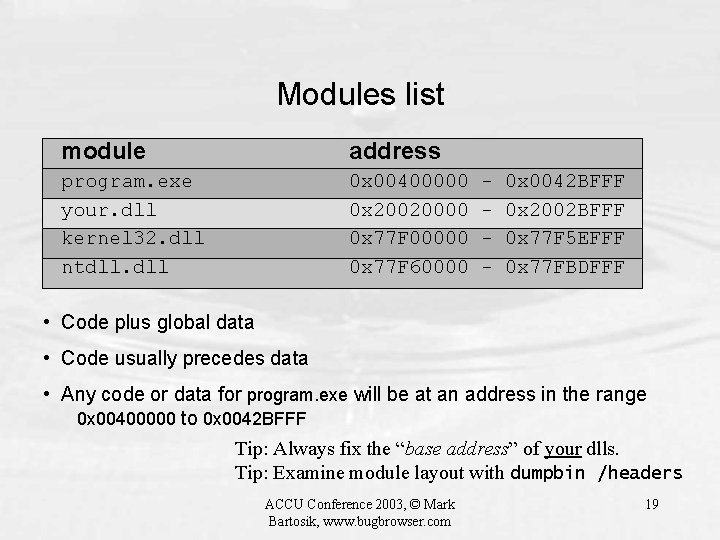
Modules list module address program. exe your. dll kernel 32. dll ntdll. dll 0 x 00400000 0 x 20020000 0 x 77 F 00000 0 x 77 F 60000 - 0 x 0042 BFFF 0 x 2002 BFFF 0 x 77 F 5 EFFF 0 x 77 FBDFFF • Code plus global data • Code usually precedes data • Any code or data for program. exe will be at an address in the range 0 x 00400000 to 0 x 0042 BFFF Tip: Always fix the “base address” of your dlls. Tip: Examine module layout with dumpbin /headers ACCU Conference 2003, © Mark Bartosik, www. bugbrowser. com 19
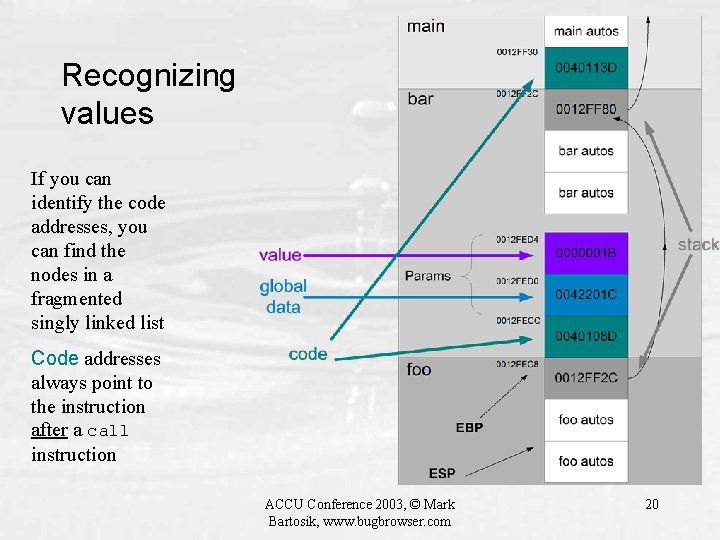
Recognizing values If you can identify the code addresses, you can find the nodes in a fragmented singly linked list Code addresses always point to the instruction after a call instruction ACCU Conference 2003, © Mark Bartosik, www. bugbrowser. com 20
![Laying false trails int bar() { int array[100]; //uninitialized // sub esp, 400 int Laying false trails int bar() { int array[100]; //uninitialized // sub esp, 400 int](http://slidetodoc.com/presentation_image/da41224b6bed5e5b1a1072ac8eadd662/image-21.jpg)
Laying false trails int bar() { int array[100]; //uninitialized // sub esp, 400 int bar() { int array[100] = {0}; ACCU Conference 2003, © Mark Bartosik, www. bugbrowser. com 21
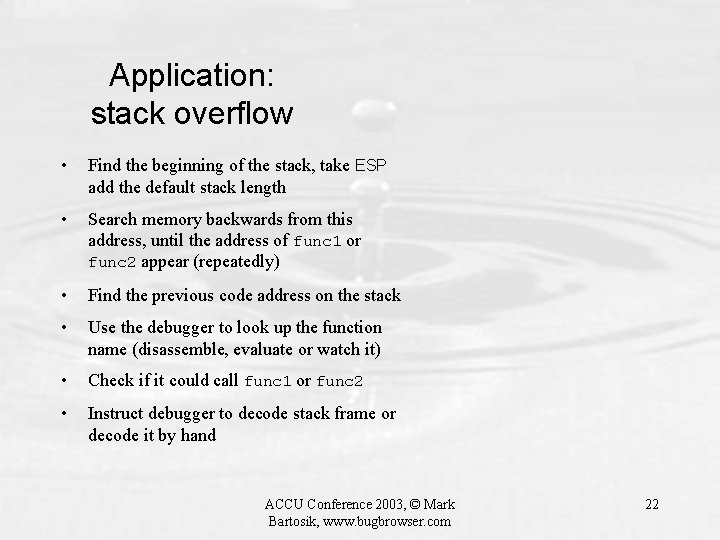
Application: stack overflow • Find the beginning of the stack, take ESP add the default stack length • Search memory backwards from this address, until the address of func 1 or func 2 appear (repeatedly) • Find the previous code address on the stack • Use the debugger to look up the function name (disassemble, evaluate or watch it) • Check if it could call func 1 or func 2 • Instruct debugger to decode stack frame or decode it by hand ACCU Conference 2003, © Mark Bartosik, www. bugbrowser. com 22
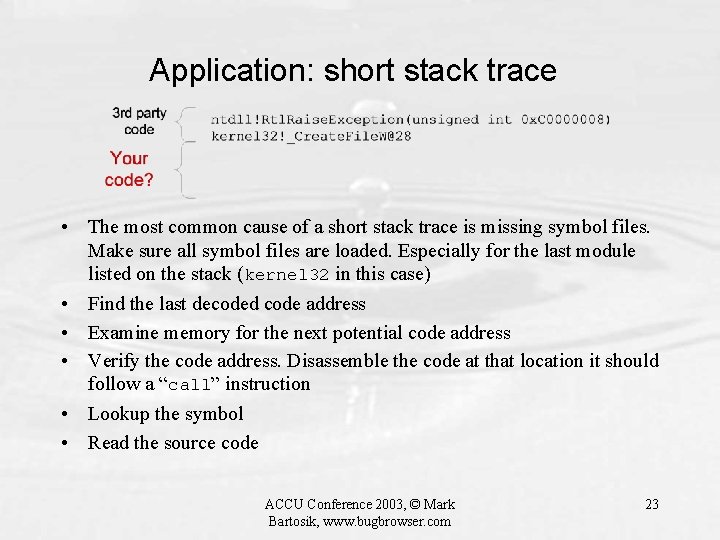
Application: short stack trace • The most common cause of a short stack trace is missing symbol files. Make sure all symbol files are loaded. Especially for the last module listed on the stack (kernel 32 in this case) • Find the last decoded code address • Examine memory for the next potential code address • Verify the code address. Disassemble the code at that location it should follow a “call” instruction • Lookup the symbol • Read the source code ACCU Conference 2003, © Mark Bartosik, www. bugbrowser. com 23
Application: no stack trace • EIP is corrupt, thus the crash, and EBP is probably useless • Take ESP find the first potential code address on the stack • Set the function context manually: set EIP to this value set EBP to the position of this code on the stack -4 • Instruct the debugger to redisplay the call stack ACCU Conference 2003, © Mark Bartosik, www. bugbrowser. com 24
Summary • • • Symbolic debuggers need symbols! Use a symbol server and symbol cache Get familiar with more than one debugger Use mini dumps Code locations are readily identifiable on the stack Links and further reading John Robbins, Debugging Applications, Microsoft Press. Also his Bug Slayer columns MSJ/MSDN magazine. Various MSJ/MSDN magazine articles by Matt Pietrek How debuggers work, Rosenberg, Wiley www. microsoft. com/ddk/debugging news: microsoft. public. windbg microsoft. public. vc. debugger www. sysinternals. com www. bugbrowser. com ACCU Conference 2003, © Mark Bartosik, www. bugbrowser. com 25
- Slides: 25