AN INTRODUCTION TO GENE EXPRESSION ANALYSIS BY MICROARRAY
 DR. AYAT B.")
AN INTRODUCTION TO GENE EXPRESSION ANALYSIS BY MICROARRAY TECHNIQUE (PART II) DR. AYAT B. AL-GHAFARI MONDAY 10 TH OF MUHARAM 1436

OLIGONUCLEOTIDE MICROARRAY WORK FLOW http: //www. affymetrix. com/technology/ge_analysis/index. affx

AFFYMETRIX FILE TYPES • Each sample hybridized on Affymetrix Gene. Chip Microarray generates several files and each file has important information for the researcher. • These files can be distinguished from each other by their name or file type such as: 1. . CEL file, the cell intensity file contains the calculated intensities for each cell in the array. It can be used as well to re-calculate data with different algorithm parameters. 2. . RPT file, the report file gives information about each hybridization quality control data (Affymetrix Inc. , 2002).

Overview of steps in a typical gene expression microarray experiment Slonim DK, Yanai I (2009) Getting Started in Gene Expression Microarray Analysis. PLo. S Comput Biol 5(10): e 1000543. doi: 10. 1371/journal. pcbi. 1000543 http: //www. ploscompbiol. org/article/info: doi/10. 1371/journal. pcbi. 1000543
 DATA NORMALIZATION • Normalization is a critical step in Oligonucleotide Microarray")
OLIGONUCLEOTIDE MICROARRAY (A) DATA NORMALIZATION • Normalization is a critical step in Oligonucleotide Microarray • It is important to ensure that a standardized RNA quantity is present among all chips • The challenge of normalization is to remove as much of the technical variation as possible while leaving the biological variation untouched • This can be achieved through detecting and correcting any abnormalities in the chips intensities by organizing all the information in the. CEL files generated by the Microarray software
 DATA ANALYSIS • There are many commercial packages for microarray analyses")
OLIGONUCLEOTIDE MICROARRAY (B) DATA ANALYSIS • There are many commercial packages for microarray analyses • The fundamental goal of most microarray experiments is to identify biological processes or pathways that consistently display differential expression between groups of samples • While the exact approach depends in part on the design of the experiment
 EXAMPLE ALGHAFARI, A. 2013. Drug resistance mechanisms in a high grade")
OLIGONUCLEOTIDE MICROARRAY (C) EXAMPLE ALGHAFARI, A. 2013. Drug resistance mechanisms in a high grade glioma cell line. Ph. D, University of Nottingham
 EXAMPLE RNA concentration readings by Agilent 2100 bioanalyzer Concentration RNA integrity")
OLIGONUCLEOTIDE MICROARRAY (C) EXAMPLE RNA concentration readings by Agilent 2100 bioanalyzer Concentration RNA integrity number (ng/μl) (RIN) C 6 (P 22) 424 9. 8 C 6 (P 23) 356 6. 2 C 6 (P 24) 735 6. 8 C 6 -irinotecan (P 7) 615 9. 2 C 6 -irinotecan (P 9) 491 8. 8 C 6 -irinotecan (P 11) 474 9. 3 C 6 -etoposide (P 11) 475 2. 7 C 6 -etoposide (P 12) 1, 652 9. 1 C 6 -etoposide (P 18) 296 7. 9 Sample number ALGHAFARI, A. 2013. Drug resistance mechanisms in a high grade glioma cell line. Ph. D, University of Nottingham
 EXAMPLE • The determination of genes which showed expression changes among")
OLIGONUCLEOTIDE MICROARRAY (C) EXAMPLE • The determination of genes which showed expression changes among the three glioma cell lines and their role in different pathways and processes was done in two analytical steps: 1. All the raw data obtained from the Affymetrix Gene. Chip Microarray for all samples were imported into the Gene. Spring GX 11 software. 2. In the second step, after identifying entities showing altered expression, further analysis of genes was performed on Ingenuity Pathway Analysis (IPA) software version 8. 7 to identify their functions, and their correlation with different signaling pathways.
 EXAMPLE • Regarding the reproducibility between replicates, the C 6 etoposide")
OLIGONUCLEOTIDE MICROARRAY (C) EXAMPLE • Regarding the reproducibility between replicates, the C 6 etoposide (P 11) sample had a low percentage ―present call (i. e. , a low number of hybridization signals above a threshold). Therefore, was marked as an outlier and has been excluded from the analysis

Hybridization and data quality analysis of all microarray samples on Gene. Spring GX 11 ALGHAFARI, A. 2013. Drug resistance mechanisms in a high grade glioma cell line. Ph. D, University of Nottingham
 EXAMPLE • After the normalization step was completed, the data were")
OLIGONUCLEOTIDE MICROARRAY (C) EXAMPLE • After the normalization step was completed, the data were statistically calculated using one way ANOVA test to compare three cell lines or unpaired T test to compare two groups each time. • In addition, the "filter by volcano plot" analysis was performed to look at the number of differentially expressed genes. It looks like that the similarity between samples means that there are very few differentially expressed genes.

The number of differentially expressed genes determined with volcano plot analysis A volcano plot is a type of scatter plot that is used to quickly identify changes in large datasets composed of replicate data. By applying unpaired t test, P<0. 05, and FC≥ 1. 5, two possible lists were determined with 83 genes and 70 genes showed significant differences between C 6 irinotecan vs. C 6 and C 6 -etoposide vs. C 6, respectively. Among these two lists, only 14 genes were commonly expressed between the three cell lines ALGHAFARI, A. 2013. Drug resistance mechanisms in a high grade glioma cell line. Ph. D, University of Nottingham

C 6 -Etoposide vs. C 6 unique genes list FC 2. 499 Symbol ABCF 2 2. 010 ATP 1 B 1 1. 597 BMP 7 Entrez Gene Name ATP-binding cassette, sub-family F (GCN 20), member 2 ATPase, Na+/K+ transporting, beta 1 polypeptide Location Type(s) Cytoplasm transporter Plasma Membrane Extracellular bone morphogenetic protein 7 Space Plasma transporter growth factor -1. 709 CDH 10 -1. 722 CDH 2 1. 533 CDK 5 cyclin-dependent kinase 5 Nucleus kinase 2. 311 CEP 76 centrosomal protein 76 k. Da Cytoplasm other 3. 860 COL 1 A 2 cadherin 10, type 2 (T 2 -cadherin) cadherin 2, type 1, N-cadherin (neuronal) Membrane Plasma Membrane Extracellular collagen, type I, alpha 2 Space other ALGHAFARI, A. 2013. Drug resistance mechanisms in a high grade glioma cell line. Ph. D, University of Nottingham
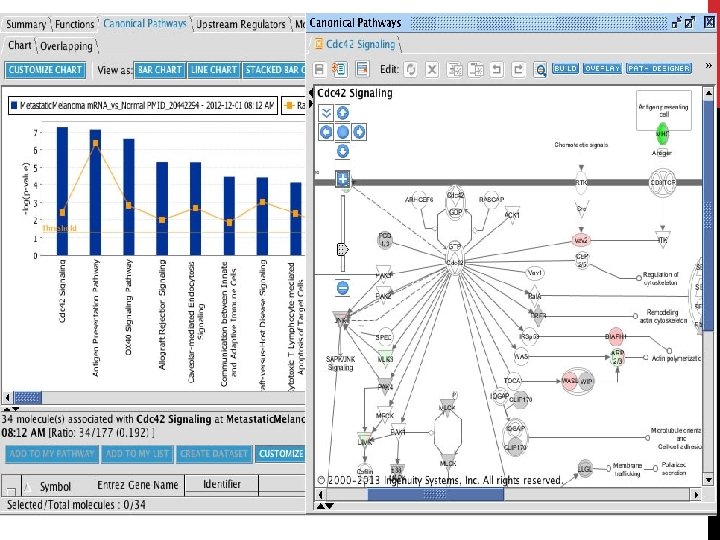
 EXAMPLE Signaling pathway profiling results • Three possible comparisons were performed")
OLIGONUCLEOTIDE MICROARRAY (C) EXAMPLE Signaling pathway profiling results • Three possible comparisons were performed (1) C 6 irinotecan vs. C 6, (2) C 6 -etoposide vs. C 6, and (3) C 6 irinotecan vs. C 6 -etoposide. • To start the analysis on IPA, data from Gene. Spring GX 11 was exported as an Excel file format containing the gene ID and the fold change for all comparisons made. • At the end of each analysis a report was produced describing the major signaling pathway or major biological processes and a list of the candidate genes which showed either up or down expression differences in each comparison made.

ALGHAFARI, A. 2013. Drug resistance mechanisms in a high grade glioma cell line. Ph. D, University of Nottingham

ALGHAFARI, A. 2013. Drug resistance mechanisms in a high grade glioma cell line. Ph. D, University of Nottingham

Overall strategies to determine drug resistance mechanisms in HGG cell line ALGHAFARI, A. 2013. Drug resistance mechanisms in a high grade glioma cell line. Ph. D, University of Nottingham

REFERENCES Terry Speed, „Statistical Analysis of Gene Expression Microarray Data”. Chapman & Hall/CRC Giovanni Parmigani et al, „The Analysis of Gene Expression Data“, Springer David W. Mount, „Bioinformatics“, Cold Spring Harbor Pierre Baldi & G. Wesley Hatfield, „DNA Microarrays and Gene Expression”, Cambridge

THANKS FOR YOUR ATTENTION ………
- Slides: 21