An Internet Tool Forecasting Land Use Change And


- Slides: 28
An Internet Tool Forecasting Land Use Change And Land Degradation In The Mediterranean Region Richard Kingston & Andy Turner University of Leeds UK
The presentation • • Some background The problem Aims and objectives Work packages Building a common spatial framework Land use predictors Building the web interface Conclusions & next stages
Background • Med. Action funded by the EU – Fifth framework program – Key Action 2: Energy, Environment and Sustainable Development • Specifically looking at: – Policies for land use to combat desertification http: //www. icis. unimaas. nl/medaction/
The problem • Increasing desertification in the Mediterranean region is having a direct impact upon land use • It is largely a society-driven problem combated by various EC agricultural subsidies • A lack of coordinated action across the Mediterranean has led to a patchwork of policy actions
Overall aims and objectives • The EC have decided that we need to: – Develop land use change scenarios at various scales – Analyse effects of past policies in four target areas – Analyse the costs of land degradation and benefits of mitigation measures – Develop options for land use policies, mitigation strategies, and incentives to combat desertification
Specific aims and objectives • Develop a scenario based integrated land use and land degradation prediction model • Develop an interactive internet interface to the modelling system and associated data • Encourage experts, policy makers and the public to use the on-line modelling system and develop the way it operates, its functionality and its capabilities based on feedback from these users
Work Packages our work
Work Package 3. 3 • Develop an internet interface to an existing stand-alone modelling system that – allows users to select which variables to include – enables them to try out different types of model – search for and evaluate available data with respect to the modelling tasks
Previous research • Developed a means of estimating the likely impacts of climate change on agricultural land use and land degradation • In order to – gain and raise awareness of the problems – inform political and public debate – have a way of contributing to the development of mitigation strategies
Previous modelling challenge • To predict contemporary agricultural land use based on a range of climatic, physical and socioeconomic indicators • Forecast the various indicators for some time in the future in order to forecast land use and provide a land use change scenario • Translate land use change scenarios into land degradation indicators • Combine land degradation indicators to produce a synoptic forecast of land degradation
What was required • Highest possible level of spatial resolution • Complete coverage over the Mediterranean climate region of the EU • Produce forecasts for about 50 years hence • Base the results on global climate change scenarios • Incorporate socio-economic data • Produce outputs as maps • Provide a modelling framework that could be refined as better data and understanding of the processes is gained • something we are doing now
Creating the common spatial framework • Step 1: Assemble a database of all relevant physical, socio-economic & environmental data • Step 2: Model the relationships between land use and other data assembled • Step 3: Obtain and make forecasts of the data • Step 4: Create and analyse maps of changes • Step 5: Translate the changes into land degradation risk indicators • Step 6: Repeat forecasting based on different climate change scenarios
Assembling the data • Decided upon a grid at a 1 -decimal-minute resolution with a fixed origin aligned in terms of latitude and longitude covering the entire Mediterranean climate region of the EU • Manipulating available source data into the framework involved the use of GIS operations and/or modelling applications – Most environmental data could be manipulated into it in a relatively straight forward manner – BUT. . . socio-economic data need to be interpolated
The land use predictors • • soil type soil quality biomass temperature precipitation height above sea level population density
Climatic Biomass Potential Height above Sea level
Predicting future land use • An example rule • If a high proportion of land use estimated/predicted now is arable and a high proportion of estimated/forecast future land use is: arable then land degradation is possible trees then land degradation is unlikely barren then land degradation is serious other land use then land degradation is probable
Building a web interface • WP 3. 3 main aim is to develop a Web interface to the existing stand-alone prototype modelling system – allow the viewing of available input data and existing model results – allow users to alter climate change scenarios and input data and view the effects on land use change and land degradation
Work so far • On-line data viewer – allows users to view relevant spatial data – meta data • Developing web-based GIS – allows users to decide on input variables – model type
Step 1: Choose data and view in the on-line map viewer Step 2: Run model choose between model types Step 5: Run another scenario? Neural Net Fuzzy Logic Step 3: Obtain Results Not Satisfied? Step 4: Submit Results to policy makes
Datasets library • Split into – socio-economic land use predictors • e. g. distance to nearest built-up area • e. g. frequency of night-time lights observation – physical land use predictors • e. g. soil type • e. g. biomass data
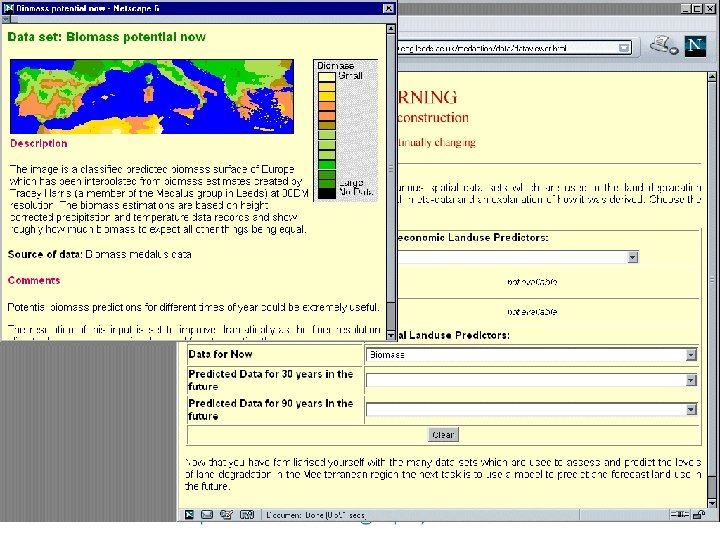
The Data Viewer • Extracts relevant gif image and associated meta data – drop down lists of data types – data for • now • 50 years in the future
Web enabled GIS • Developing in house GIS – Java based open source – vector and raster capabilities – runs on the Web or stand alone • http: //mapkenzie. sourceforge. net/
The modelling interface • After using the data library users then – select which variables to include – enables them to try out different types of model • Neural networks for classification • Fuzzy logic based for subjective interpretation – view results – re-run with different data-sets and/or models • The modelling interface still has to be developed!
Here’s an example from some previous work
Next stages • Update the system with new – socio-economic – environmental – physical data • Develop the Web-based interface • Develop the modelling system • Allow users to add their own data
Conclusions • This work is still in its early stages • Results will only be good enough to enlighten debate – not control policy • It is a first step towards providing wider access to land degradation data and models • It has the potential to open up the decision making process to those who are interested • It provide an example web-based tool for planners, decision makers and citizens interested in visualising the consequences of environmental change
Further details Med. Action http: //www. ccg. leeds. ac. uk/medaction/ richard@geog. leeds. ac. uk a. turner@geog. leeds. ac. uk Java GIS http: //geotools. sourceforge. net/ http: //mapkenzie. sourceforge. net/ Other examples http: /www. ccg. leeds. ac. uk/atomic/