An ensemble prediction system for polar lows over

An ensemble prediction system for polar lows over the Norwegian and Barents Sea Harold Mc Innes, Jørn Kristiansen, Eivind Støylen, Andrew Singleton, Gunnar Noer, Hanneke Luijting

Polar lows Small but intense maritime cyclone (200 – 1000 km horizontal scale and wind speeds exceeding 15 m/s) Form when very cold air originating over the Arctic ice is advected over open sea Due to strong wind and heavy precipitation polar lows are a danger to maritime activity Sea level pressure analysis from 0600 UTC 4 March 2008 overlaid NOAA satellite image from 0547 UTC. Small scale and rapid development represent a challenge forecasters Strong desire for prediction systems targeting polar lows Dropsonde released from DLR Falcon aircraft 1112 UTC 4 March 66°N, 2. 8°E during the IPY-THORPEX field campaign

IPY-THORPEX field campaign 2008 DLR Falcon aircraft Photo: Christian Bjørnæs, CICERO Research flights during the Norwegian IPY-THORPEX. Kristjánsson et al. (2011). Bulletin of American Meteorological Society. Adressed polar lows and arctic fronts over the Norwegian, Barents and Greenland Seas. Observations from 150 dropsondes and LIDAR systems carried onboard the aircraft. The full life cycle of a polar low (3 - 4 March 2008) was observed during three fligths Numerical experiments on the observations indicate that high-resolution EPS could improve polar low forecasting. The Norwegian Meteorological Institute has applied a high resolution EPS for polar lows during the winter season 2012/2013

Why would increased horizontal resolution improve polar low forecasts ? UM 12 NOAA image from 3 March 2008 1737 UTC. Pseudo images based on liquid and ice water from UK Unified Model UM 4 has a structure of convective cells that is more realistic compared to the NOAA image. Inidicates that UM 4 has better treatment of convection. Diabatic heating and hence convection has an important role in polar low development UM 4 Pseudo images from 42 h simulations with UM valid at 3 March 18 UTC. From Mc Innes et al, 2011.
 Based on the Harmonie model 2. 5")
An EPS for polar lows (Harmon. EPS) Based on the Harmonie model 2. 5 km horizontal grid spacing, 65 layers Ensemble members: 10 + control Boundary and initial data are dynamical downscaled from ECMWFeps Barents Sea Two different domains. Duty meteorologist selects domain. EPS run from 06 UTC and 18 UTC until + 42 hours The work is part of the Barents. Watch project http: //www. barentswatch. no/ Polar low tracks and probabilities are calculated Norwegian Sea

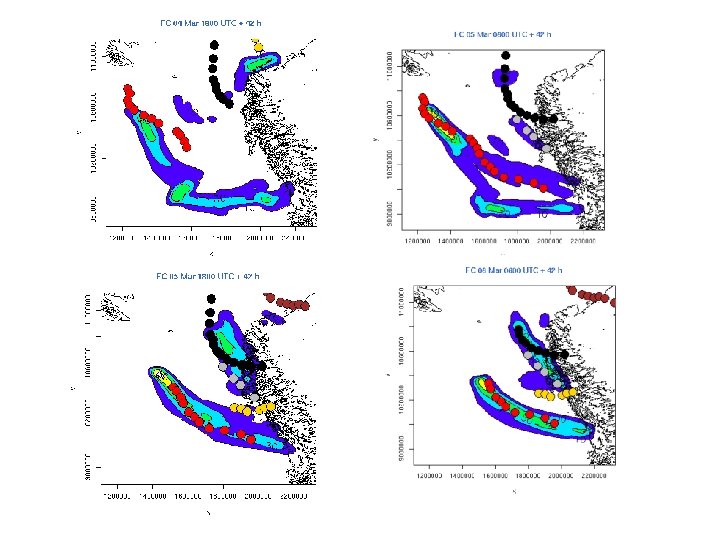
Output from Harmon. EPS Probabilities Individual tracks Tracks and probabilities between 5 March 06 UTC and 7 March 00 UTC Criteria for polar low track: Horizontal scale between 200 and 600 km Minimum temperature difference between sea surface and 500 h. Pa is 43 K 925 h. Pa vorticity is used to localize polar low

Verification against coastal and maritime observations 30 stations, mainly at the Norwegian coast Parameter: 10 minutes mean wind speed

Verification October 2012 – April 2013 Reliability + 30 h > 15 m/s ROC + 30 h > 15 m/s Harmon. EPS GLAMEPS Reliability diagram: Relative operating characteristics (ROC) diagram: Observed frequency of event against forecasted probability Hit rate against false alarm rate GLAMEPS reliability disturbed due to small number of events ROC diagram: GLAMEPS better than Harmon. EPS
")
Verification October 2012 – April 2013 Mean bias Harmon. EPS GLAMEPS Reference forecast (climatology) is Oktober 2012 – April 2013 Brier skill score > 15 m/s Brier skill score (BSS): BSS = 1 – B/Bclim BSS = 1 is perfect BSS= ≤ 0 is no better than climatology Mean Bias: Harmon. EPS underestimates wind Why is GLAMEPS better than Harmon. EPS ? GLAMEPS has four different models (ALADIN, 2 versions of HIRLAM and ECMWF model) Harmon. EPS has only 11 members and dynamically downscaled boundary values

20 m/s wind speed event at offshore station Norne 27 - 28 December 2012 SLP analysis 27 December 2012 21 UTC

20 m/s wind speed event at offshore station Norne Harmon. EPS data plotted against observations Observations Control run EPS mean

20 m/s wind speed event at offshore station Norne 28 February 2013 SLP analysis 28 February 2013 06 UTC

20 m/s wind speed event at offshore station Norne Harmon. EPS data plotted against observations Observations Control run EPS mean
 and tracks of polar lows on")
Validation against AVHRR images Observed postions (red dots) and tracks of polar lows on an AVHRR image from 23 March 2013 Tracks and positions have been identified by experienced forecasters

Future plans Increase number of domains to three for the 2013 -2014 season. 2 -way coupling to the ECMWF wave model WAM Post-processing of wind forecasts Default domain Three alternative domains for the coming winter season

Acknowledgements Barents. Watch project http: //www. barentswatch. no/ The Norwegian Research Council through the project “THORPEX-IPY: Improved forecasting of adverse weather in the Arctic – present and future” Deutschen Zentrums für Luft- und Raumfahrt (DLR) Thank you for your attention
- Slides: 18