
An efficient way in quantifying the nonlinear response

- Slides: 20
An efficient way in quantifying the nonlinear response of air pollution to emission changes using the indicator-based response surface model Jia Xing 1, Shuxiao Wang 1, James T. Kelly 2, Carey Jang 2, Yun Zhu 3, Dian Ding 1, Zhaoxin Dong 1, Song Liu 1, Jiming Hao 1 School of Environment, Tsinghua University, Beijing, China 2 Office of Air Quality Planning & Standards, US EPA, RTP, NC, USA 1 3 South China University of Technology, Guangzhou, China 2019 CMAS annual meeting, Oct 21 st, Chapel Hill, NC
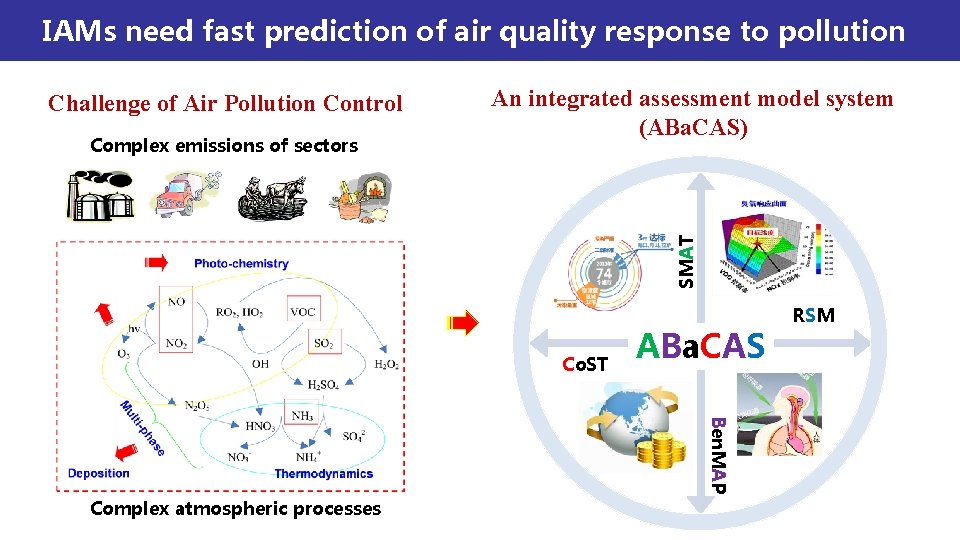
IAMs need fast prediction of air quality response to pollution Challenge of Air Pollution Control SMAT Complex emissions of sectors An integrated assessment model system (ABa. CAS) Co. ST ABa. CAS Ben. MAP Complex atmospheric processes RSM
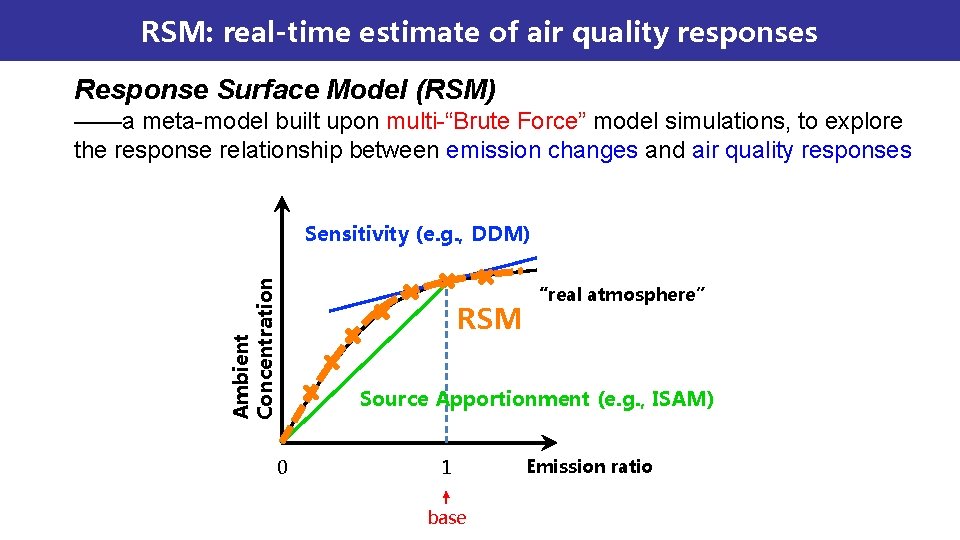
RSM: real-time estimate of air quality responses Response Surface Model (RSM) ——a meta-model built upon multi-“Brute Force” model simulations, to explore the response relationship between emission changes and air quality responses Ambient Concentration Sensitivity (e. g. , DDM) 0 RSM “real atmosphere” Source Apportionment (e. g. , ISAM) 1 base Emission ratio
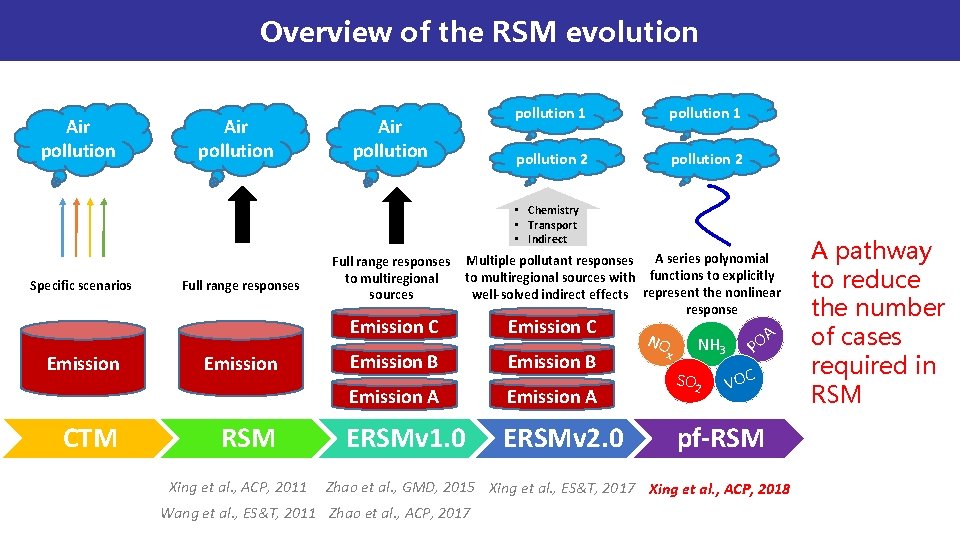
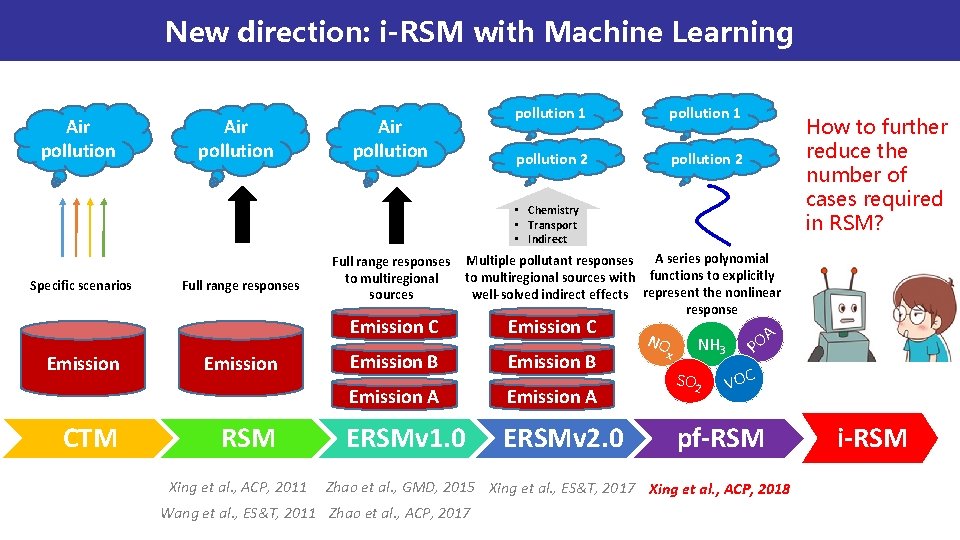
Overview of the RSM evolution Air pollution 1 pollution 2 • Chemistry • Transport • Indirect Specific scenarios Full range responses to multiregional sources Emission CTM Emission RSM Xing et al. , ACP, 2011 A series polynomial Multiple pollutant responses to multiregional sources with functions to explicitly well-solved indirect effects represent the nonlinear response Emission C Emission B Emission A ERSMv 1. 0 ERSMv 2. 0 NO x NH 3 SO 2 A PO VOC pf-RSM Zhao et al. , GMD, 2015 Xing et al. , ES&T, 2017 Xing et al. , ACP, 2018 Wang et al. , ES&T, 2011 Zhao et al. , ACP, 2017 A pathway to reduce the number of cases required in RSM
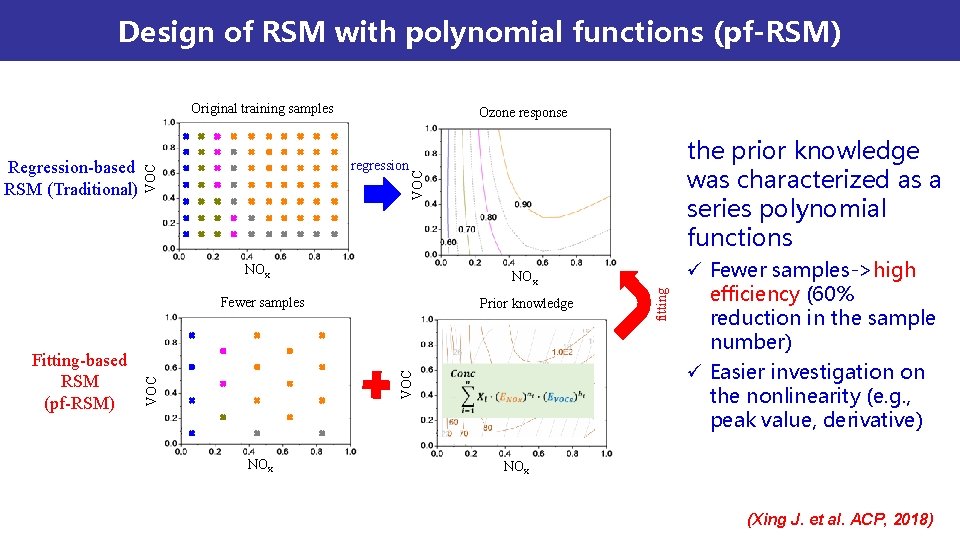
Design of RSM with polynomial functions (pf-RSM) Original training samples the prior knowledge was characterized as a series polynomial functions VOC regression NOx Fewer samples VOC Fitting-based RSM (pf-RSM) Prior knowledge NOx fitting VOC Regression-based RSM (Traditional) Ozone response ü Fewer samples->high efficiency (60% reduction in the sample number) ü Easier investigation on the nonlinearity (e. g. , peak value, derivative) NOx (Xing J. et al. ACP, 2018)
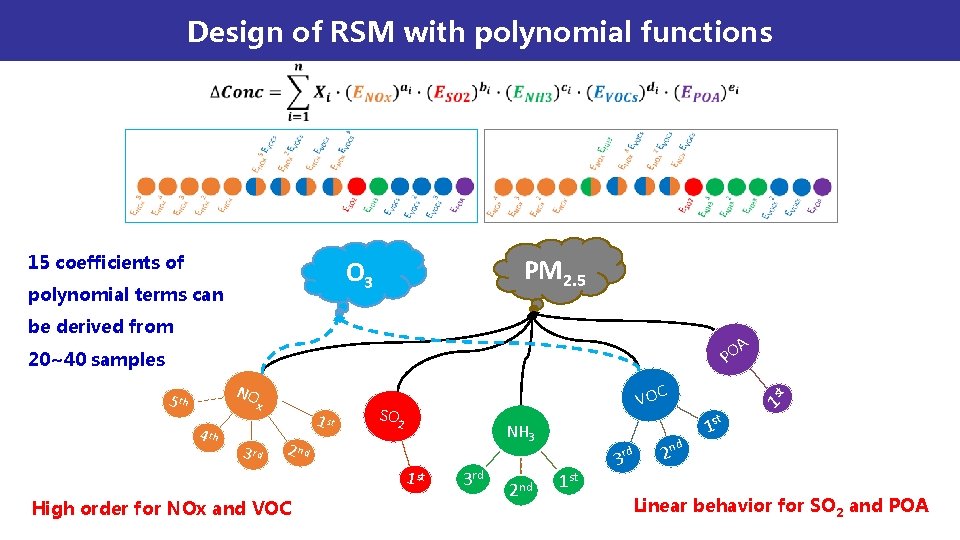
Design of RSM with polynomial functions 15 coefficients of PM 2. 5 O 3 polynomial terms can be derived from A O P 20~40 samples NO 5 th x 4 th 3 rd 1 st VOC SO 2 NH 3 2 nd 1 st High order for NOx and VOC 3 rd 2 nd rd 1 st 3 st st d 1 1 2 n Linear behavior for SO 2 and POA
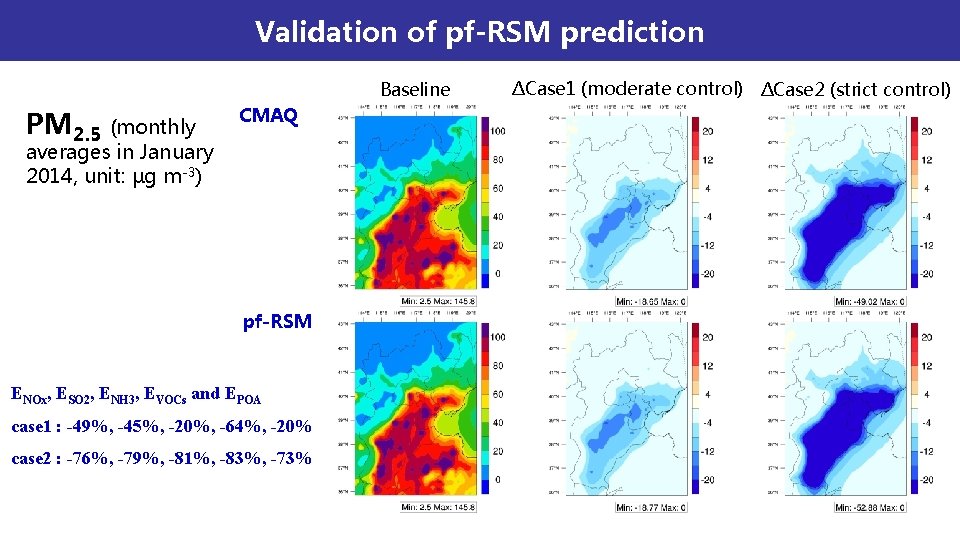
Validation of pf-RSM prediction Baseline PM 2. 5 (monthly CMAQ averages in January 2014, unit: µg m-3) pf-RSM ENOx, ESO 2, ENH 3, EVOCs and EPOA case 1 : -49%, -45%, -20%, -64%, -20% case 2 : -76%, -79%, -81%, -83%, -73% ΔCase 1 (moderate control) ΔCase 2 (strict control)
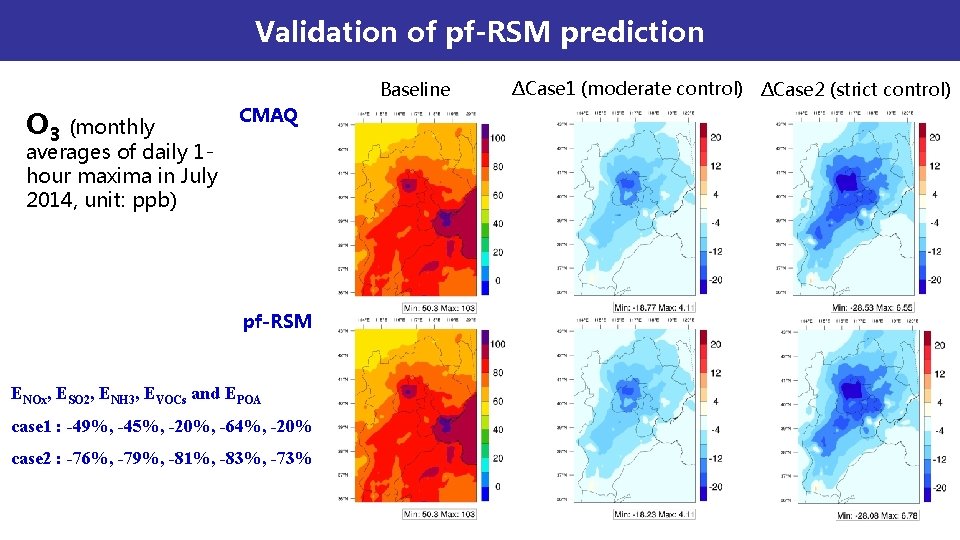
Validation of pf-RSM prediction Baseline O 3 (monthly CMAQ averages of daily 1 hour maxima in July 2014, unit: ppb) pf-RSM ENOx, ESO 2, ENH 3, EVOCs and EPOA case 1 : -49%, -45%, -20%, -64%, -20% case 2 : -76%, -79%, -81%, -83%, -73% ΔCase 1 (moderate control) ΔCase 2 (strict control)
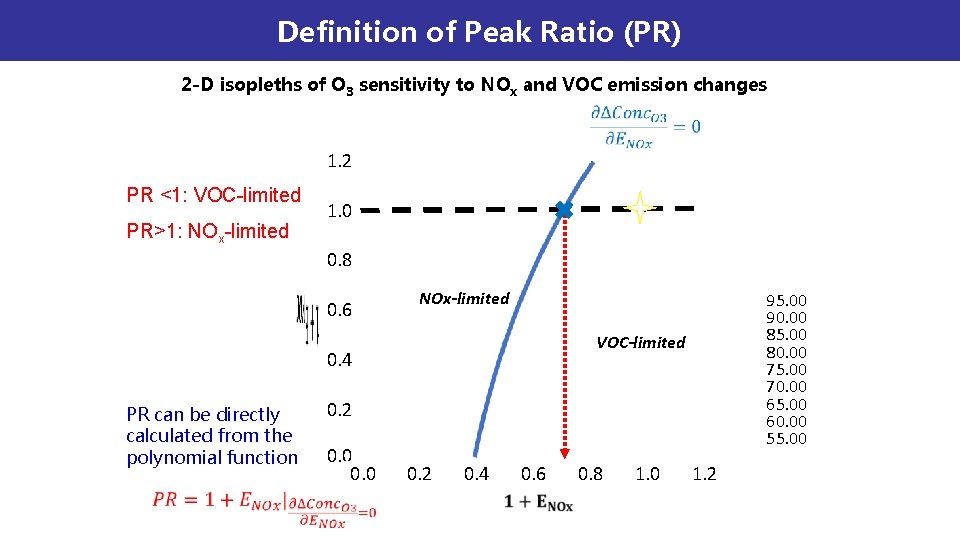
Definition of Peak Ratio (PR) 2 -D isopleths of O 3 sensitivity to NOx and VOC emission changes 1. 2 PR <1: VOC-limited PR>1: NOx-limited 1. 0 0. 8 0. 6 PR can be directly calculated from the polynomial function NOx-limited 95. 00 90. 00 85. 00 80. 00 75. 00 70. 00 65. 00 60. 00 55. 00 VOC-limited 0. 4 0. 2 0. 0 0. 2 0. 4 0. 6 0. 8 1. 0 1. 2
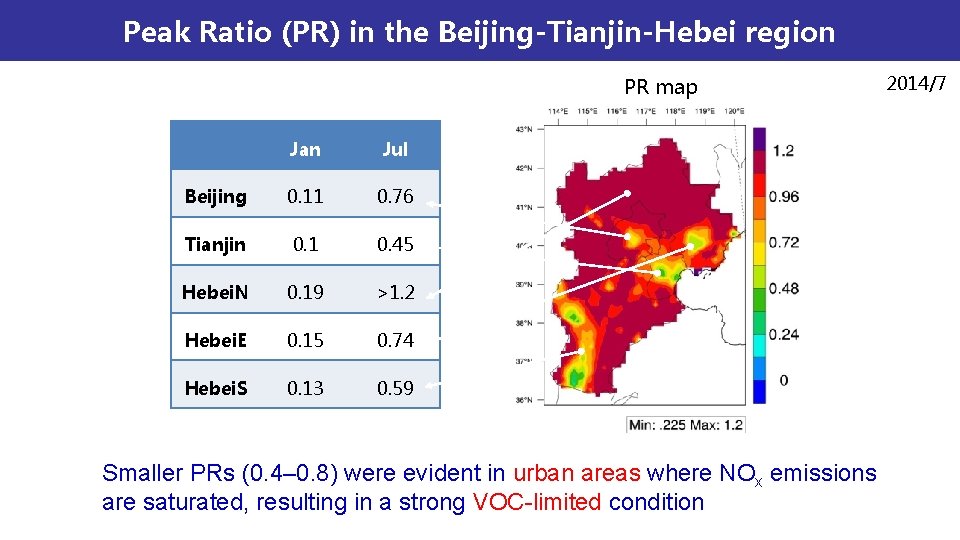
Peak Ratio (PR) in the Beijing-Tianjin-Hebei region PR map Jan Jul Beijing 0. 11 0. 76 Tianjin 0. 1 0. 45 Hebei. N 0. 19 >1. 2 Hebei. E 0. 15 0. 74 Hebei. S 0. 13 0. 59 Smaller PRs (0. 4– 0. 8) were evident in urban areas where NOx emissions are saturated, resulting in a strong VOC-limited condition 2014/7
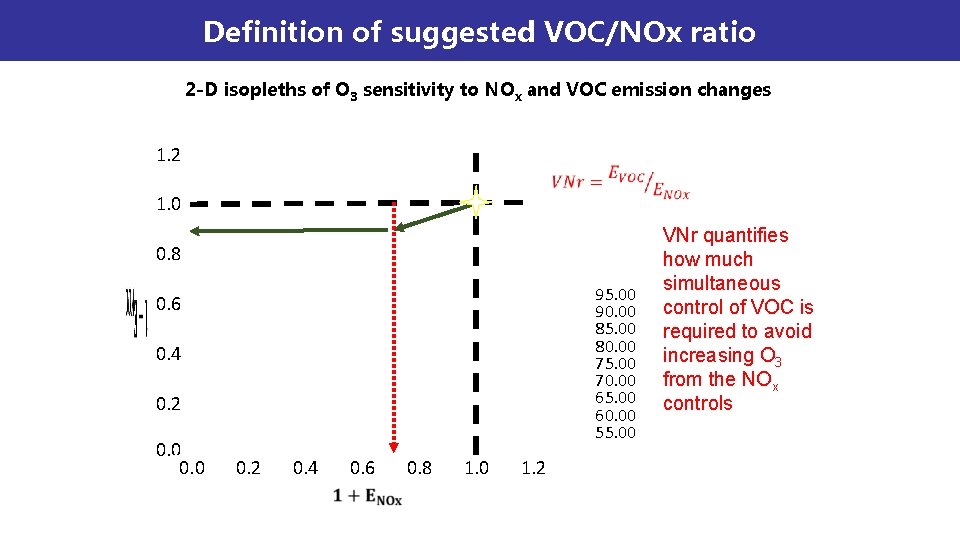
Definition of suggested VOC/NOx ratio 2 -D isopleths of O 3 sensitivity to NOx and VOC emission changes 1. 2 1. 0 0. 8 95. 00 90. 00 85. 00 80. 00 75. 00 70. 00 65. 00 60. 00 55. 00 0. 6 0. 4 0. 2 0. 0 0. 2 0. 4 0. 6 0. 8 1. 0 1. 2 VNr quantifies how much simultaneous control of VOC is required to avoid increasing O 3 from the NOx controls
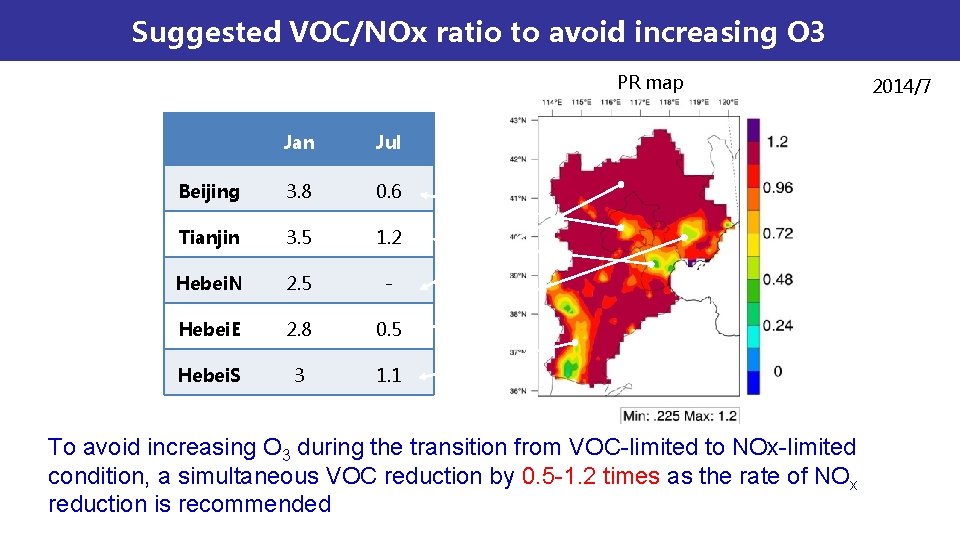
Suggested VOC/NOx ratio to avoid increasing O 3 PR map Jan Jul Beijing 3. 8 0. 6 Tianjin 3. 5 1. 2 Hebei. N 2. 5 - Hebei. E 2. 8 0. 5 Hebei. S 3 1. 1 To avoid increasing O 3 during the transition from VOC-limited to NOx-limited condition, a simultaneous VOC reduction by 0. 5 -1. 2 times as the rate of NOx reduction is recommended 2014/7
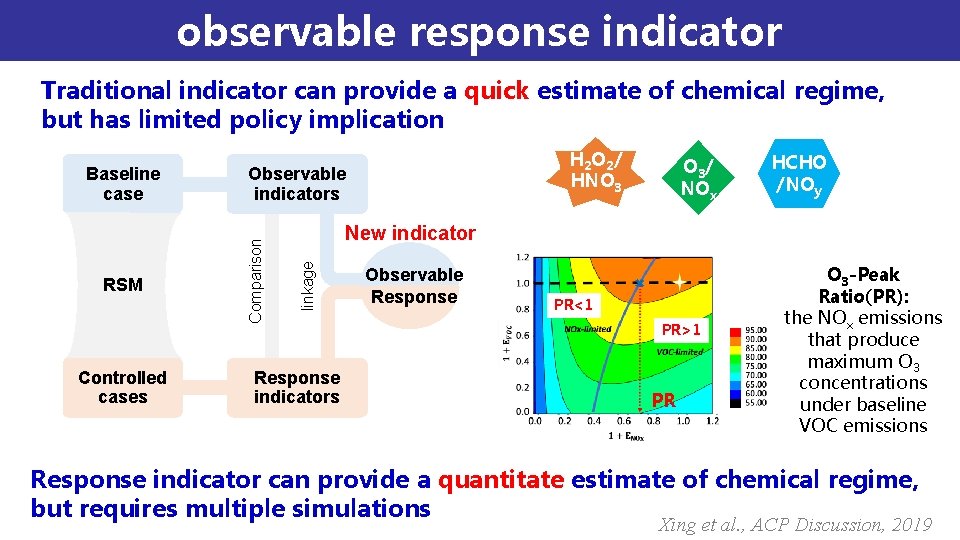
observable response indicator Traditional indicator can provide a quick estimate of chemical regime, but has limited policy implication Controlled cases O 3 / NOx HCHO /NOy New indicator linkage RSM Observable indicators Comparison Baseline case H 2 O 2 / HNO 3 Response indicators Observable Response PR<1 PR>1 PR O 3 -Peak Ratio(PR): the NOx emissions that produce maximum O 3 concentrations under baseline VOC emissions Response indicator can provide a quantitate estimate of chemical regime, but requires multiple simulations Xing et al. , ACP Discussion, 2019
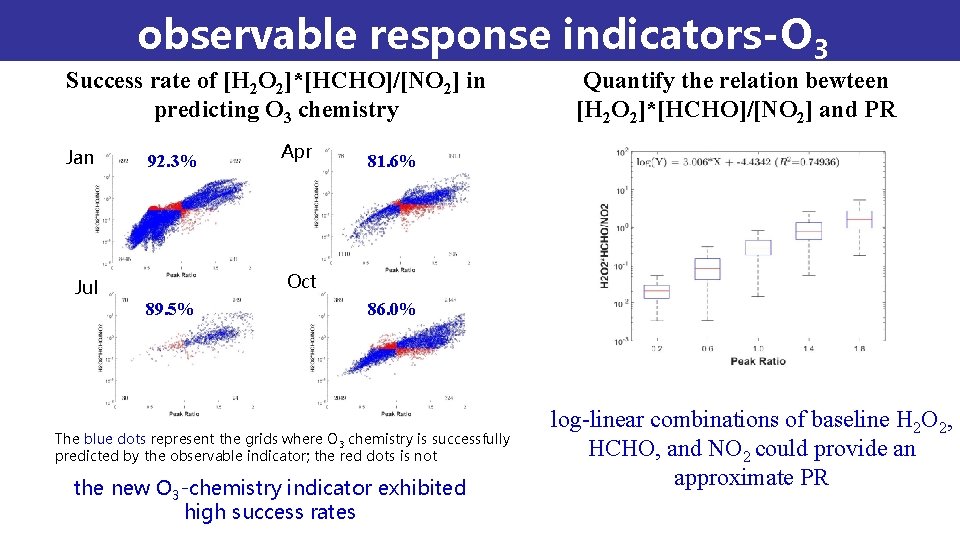
observable response indicators-O 3 Success rate of [H 2 O 2]*[HCHO]/[NO 2] in predicting O 3 chemistry Jan 92. 3% Apr Quantify the relation bewteen [H 2 O 2]*[HCHO]/[NO 2] and PR 81. 6% Oct Jul 89. 5% 86. 0% The blue dots represent the grids where O 3 chemistry is successfully predicted by the observable indicator; the red dots is not the new O 3 -chemistry indicator exhibited high success rates log-linear combinations of baseline H 2 O 2, HCHO, and NO 2 could provide an approximate PR
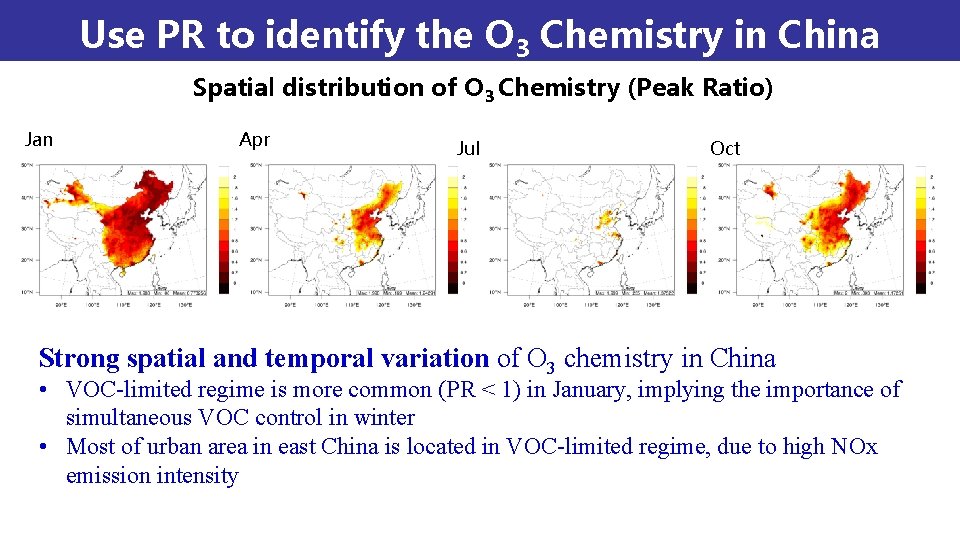
Use PR to identify the O 3 Chemistry in China Spatial distribution of O 3 Chemistry (Peak Ratio) Jan Apr Jul Oct Strong spatial and temporal variation of O 3 chemistry in China • VOC-limited regime is more common (PR < 1) in January, implying the importance of simultaneous VOC control in winter • Most of urban area in east China is located in VOC-limited regime, due to high NOx emission intensity
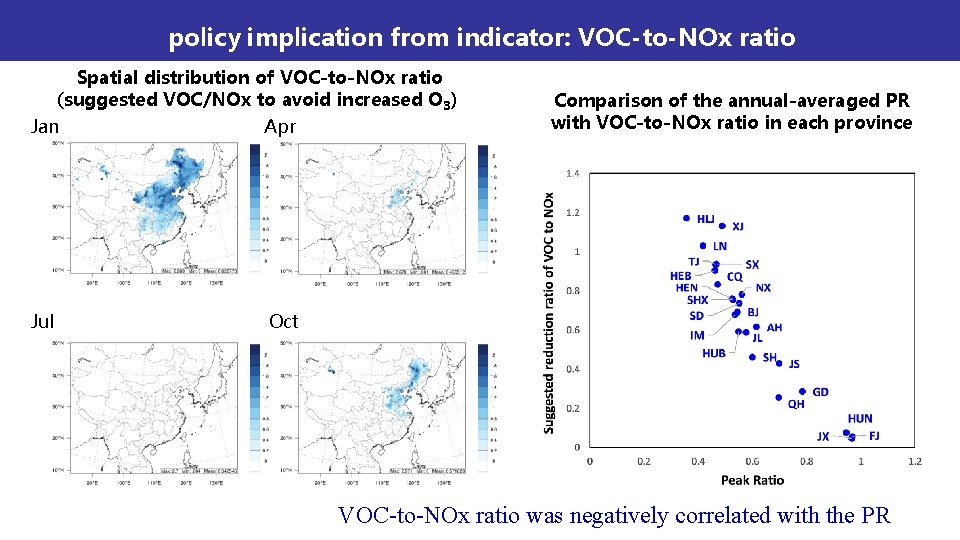
policy implication from indicator: VOC-to-NOx ratio Spatial distribution of VOC-to-NOx ratio (suggested VOC/NOx to avoid increased O 3) Jan Apr Jul Oct Comparison of the annual-averaged PR with VOC-to-NOx ratio in each province VOC-to-NOx ratio was negatively correlated with the PR
New direction: i-RSM with Machine Learning Air pollution 1 pollution 2 How to further reduce the number of cases required in RSM? • Chemistry • Transport • Indirect Specific scenarios Full range responses to multiregional sources Emission CTM Emission RSM Xing et al. , ACP, 2011 A series polynomial Multiple pollutant responses to multiregional sources with functions to explicitly well-solved indirect effects represent the nonlinear response Emission C Emission B Emission A ERSMv 1. 0 ERSMv 2. 0 NO x NH 3 SO 2 A PO VOC pf-RSM Zhao et al. , GMD, 2015 Xing et al. , ES&T, 2017 Xing et al. , ACP, 2018 Wang et al. , ES&T, 2011 Zhao et al. , ACP, 2017 i-RSM
Development of indicator-based RSM Xing et al. , in prep
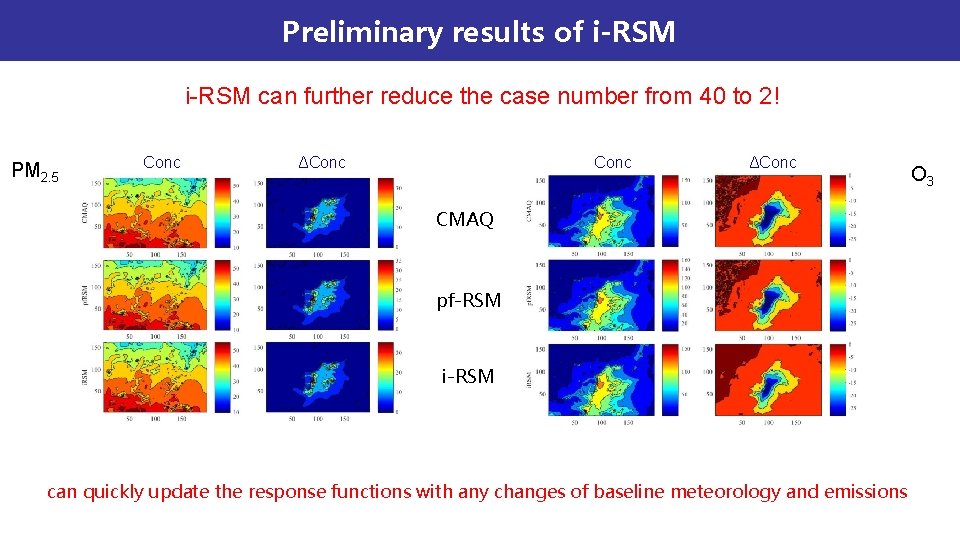
Preliminary results of i-RSM can further reduce the case number from 40 to 2! PM 2. 5 Conc ΔConc CMAQ pf-RSM i-RSM can quickly update the response functions with any changes of baseline meteorology and emissions O 3
Thank you very much! Jia Xing Associate Professor School of Environment, Room 229 Tsinghua University, Beijing, China, 10084 Email: xingjia@tsinghua. edu. cn