An Automatic Software Quality Measurement System Overview of


 • Depth of Inheritance Tree (DIT)")


 •")


 • Maintains a repository of results on different")


- Slides: 28
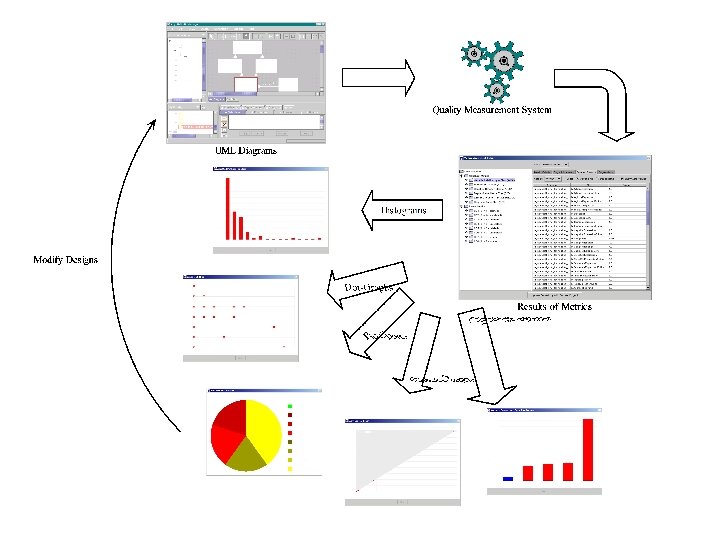
An Automatic Software Quality Measurement System
Overview of Project • Gain an insight into the world of software quality assurance. • A tool that measures the quality of object oriented designs expressed in UML.
Tasks Undertaken • Researching Software Quality in General • Researching Quality of OO Designs – What structures affect the quality of OO Designs? • Choosing a metrics suite • Methodology for extracting metric information from UML • Implementing a tool to measure the quality of systems designed with UML
Why measure the quality of designs? $100 Requirements $500 Design Max Min $1000 Coding $3000 Testing Acceptance Test $5000 $8200 Operation 0 50 100 Source: Software Education Associates Ltd
Why measure the quality of designs? Origins of Defects Code Other 10% 7% 28% Design 55% Requirements Source: Software Education Associates Ltd
What makes a good OO Design? • No clear definition exists • Quality is a subjective and ambiguous concept • Conflicts and contradictions can occur when asking for a ‘good quality’ design
Approaches to Measuring Quality
Measurable Structures in OO Designs • Class – Template from which objects are created – The way in which classes are designed affects the overall understandability and maintainability of a system – Reusability could also be affected
Measurable Structures in OO Designs • Message – A request that one object makes to another object – It is important to study message flows between classes in a system – More complex message flows make for less understandable and maintainable systems
Measurable Structures in OO Designs • Cohesion – The degree to which methods are related to one another and work together to provide wellbounded behavior – High degree of cohesion indicates selfcontained classes increasing efficiency – Self-contained classes are easily reused
Measurable Structures in OO Designs • Coupling – The strength of association from one entity to another – Indicates level of efficiency (strong coupling complicates a system making it inefficient) – Indicates level of maintainability (changes in one class won’t have a lot of ripple effect if coupling is low) – Indicates level of reuse (classes with low coupling are easily reused)
Measurable Structures in OO Designs • Inheritance – Mechanism whereby object acquires characteristics from one or more other objects – Can by analyzed from the ‘depth’ or ‘breadth’ perspective – Affects reusability and complexity of a system
Choice of Metrics • Suite of 14 metrics • Measure each of the above structures • Separated into two groups: Structural Metrics and Reusability Metrics
Structural Metrics • Weighted Methods per Class (WMC) • Depth of Inheritance Tree (DIT) • Number of Children (NOC) • Coupling Between Objects (CBO) • Response for a Class (RFC) • Lack of Cohesion of Methods (LCOM)
Reusability Metrics • Developed by Price and Demurijan in 1997 • Combine subjective and objective techniques • 8 coupling-based metrics
Overview of the Price/Demurijan Method 1. Allowing designer to design system 2. Collecting Subjective Information from Designer 3. Use objective metrics on subjective data to obtain reusability readings
Collecting Subjective Data • General and Specific Classes • Related / Unrelated Hierarchies
Types of Coupling • 8 Types of Coupling can Occur • Reuse Metrics are basically counts of these different types of coupling • Each type of coupling is judged to have a positive, negative or neutral influence on the reusability of a system
Enumeration of Coupling Types • CC 1 = G G (among related hierarchies) • CC 2 = G G (among unrelated hierarchies) • CC 3 = G S (among related hierarchies) • CC 4 = G S (among unrelated hierarchies) • CC 5 = S G (among related hierarchies) • CC 6 = S G (among unrelated hierarchies) • CC 7 = S S (among related hierarchies) • CC 8 = S S (among unrelated hierarchies)
Methodology • For each metric, a methodology was developed for extracting information from UML diagrams • 4 UML diagrams are utilized in total: – Class Diagrams – Activity Diagrams – Sequence Diagrams – Collaboration Diagrams • 2 Light-weight extensions were defined for UML in the form of stereo-types.
Design and Implementation of the Tool
Features provided by the Tool • • Plugs into an existing UML editor Collection of extra data for Metrics Function Points calculation Function Points-based productivity estimates • Calculation of Metrics • Provides help on specific metrics and their use
Features provided by the Tool (Cont) • Maintains a repository of results on different projects • Provides graphs for easier interpretation of Metric Results • Detailed help system describing how graphs could be interpreted.
Design Decisions • The architecture of the system should make it easier for new metrics to be added at a later stage if needed • Both quality-related data and the metrics repository will be saved in XML format.
An Quick Overview of System Modules
Program Demonstration